Downloaded 13 times
![Praise for Plan B
“Lester Brown tells us how to build a more just world and save the plan-
et . . . in a practical, straightforward way. We should all heed his advice.”
—President Bill Clinton
“. . . a far-reaching thinker.”
—U.S. News & World Report
“It’s exciting . . . a masterpiece!”
—Ted Turner
“[Brown’s] ability to make a complicated subject accessible to the general
reader is remarkable. . . ”
—Katherine Salant, Washington Post
“If the 2007 Nobel Peace Prize had been extended to a third recipient, the
logical candidate would have been Lester Brown.”
—Edward O. Wilson
“Brown is impassioned and convincing when talking about the world’s
ills and what he considers the four great goals to restoring civilization’s
equilibrium. . . ”
—April Streeter, TreeHugger.com
“In this impressively researched manifesto for change, Brown bluntly
sets out the challenges and offers an achievable road map for solving the
climate change crisis.”
—The Guardian
“In tackling a host of pressing issues in a single book, Plan B 2.0 makes for
an eye-opening read.”
—Times Higher Education Supplement
“The best big-picture summary of our environmental situation—both the
problems and the solutions—I’ve ever read.”
—Grist
“A great book which should wake up humankind!”
—Klaus Schwab, World Economic Forum
“Lester R. Brown, one of the world’s preeminent eco-economists . . . has a
solution for dealing with the threat . . . Plans must be periodically revised
and refined, which Brown has done with insight and foresight in this vol-
ume.”
—Ode
continued . . .](https://image.slidesharecdn.com/planb4-0-100602035908-phpapp02/75/Plan-b-4-0-Mobilizing-to-Save-Civilization-1-2048.jpg)

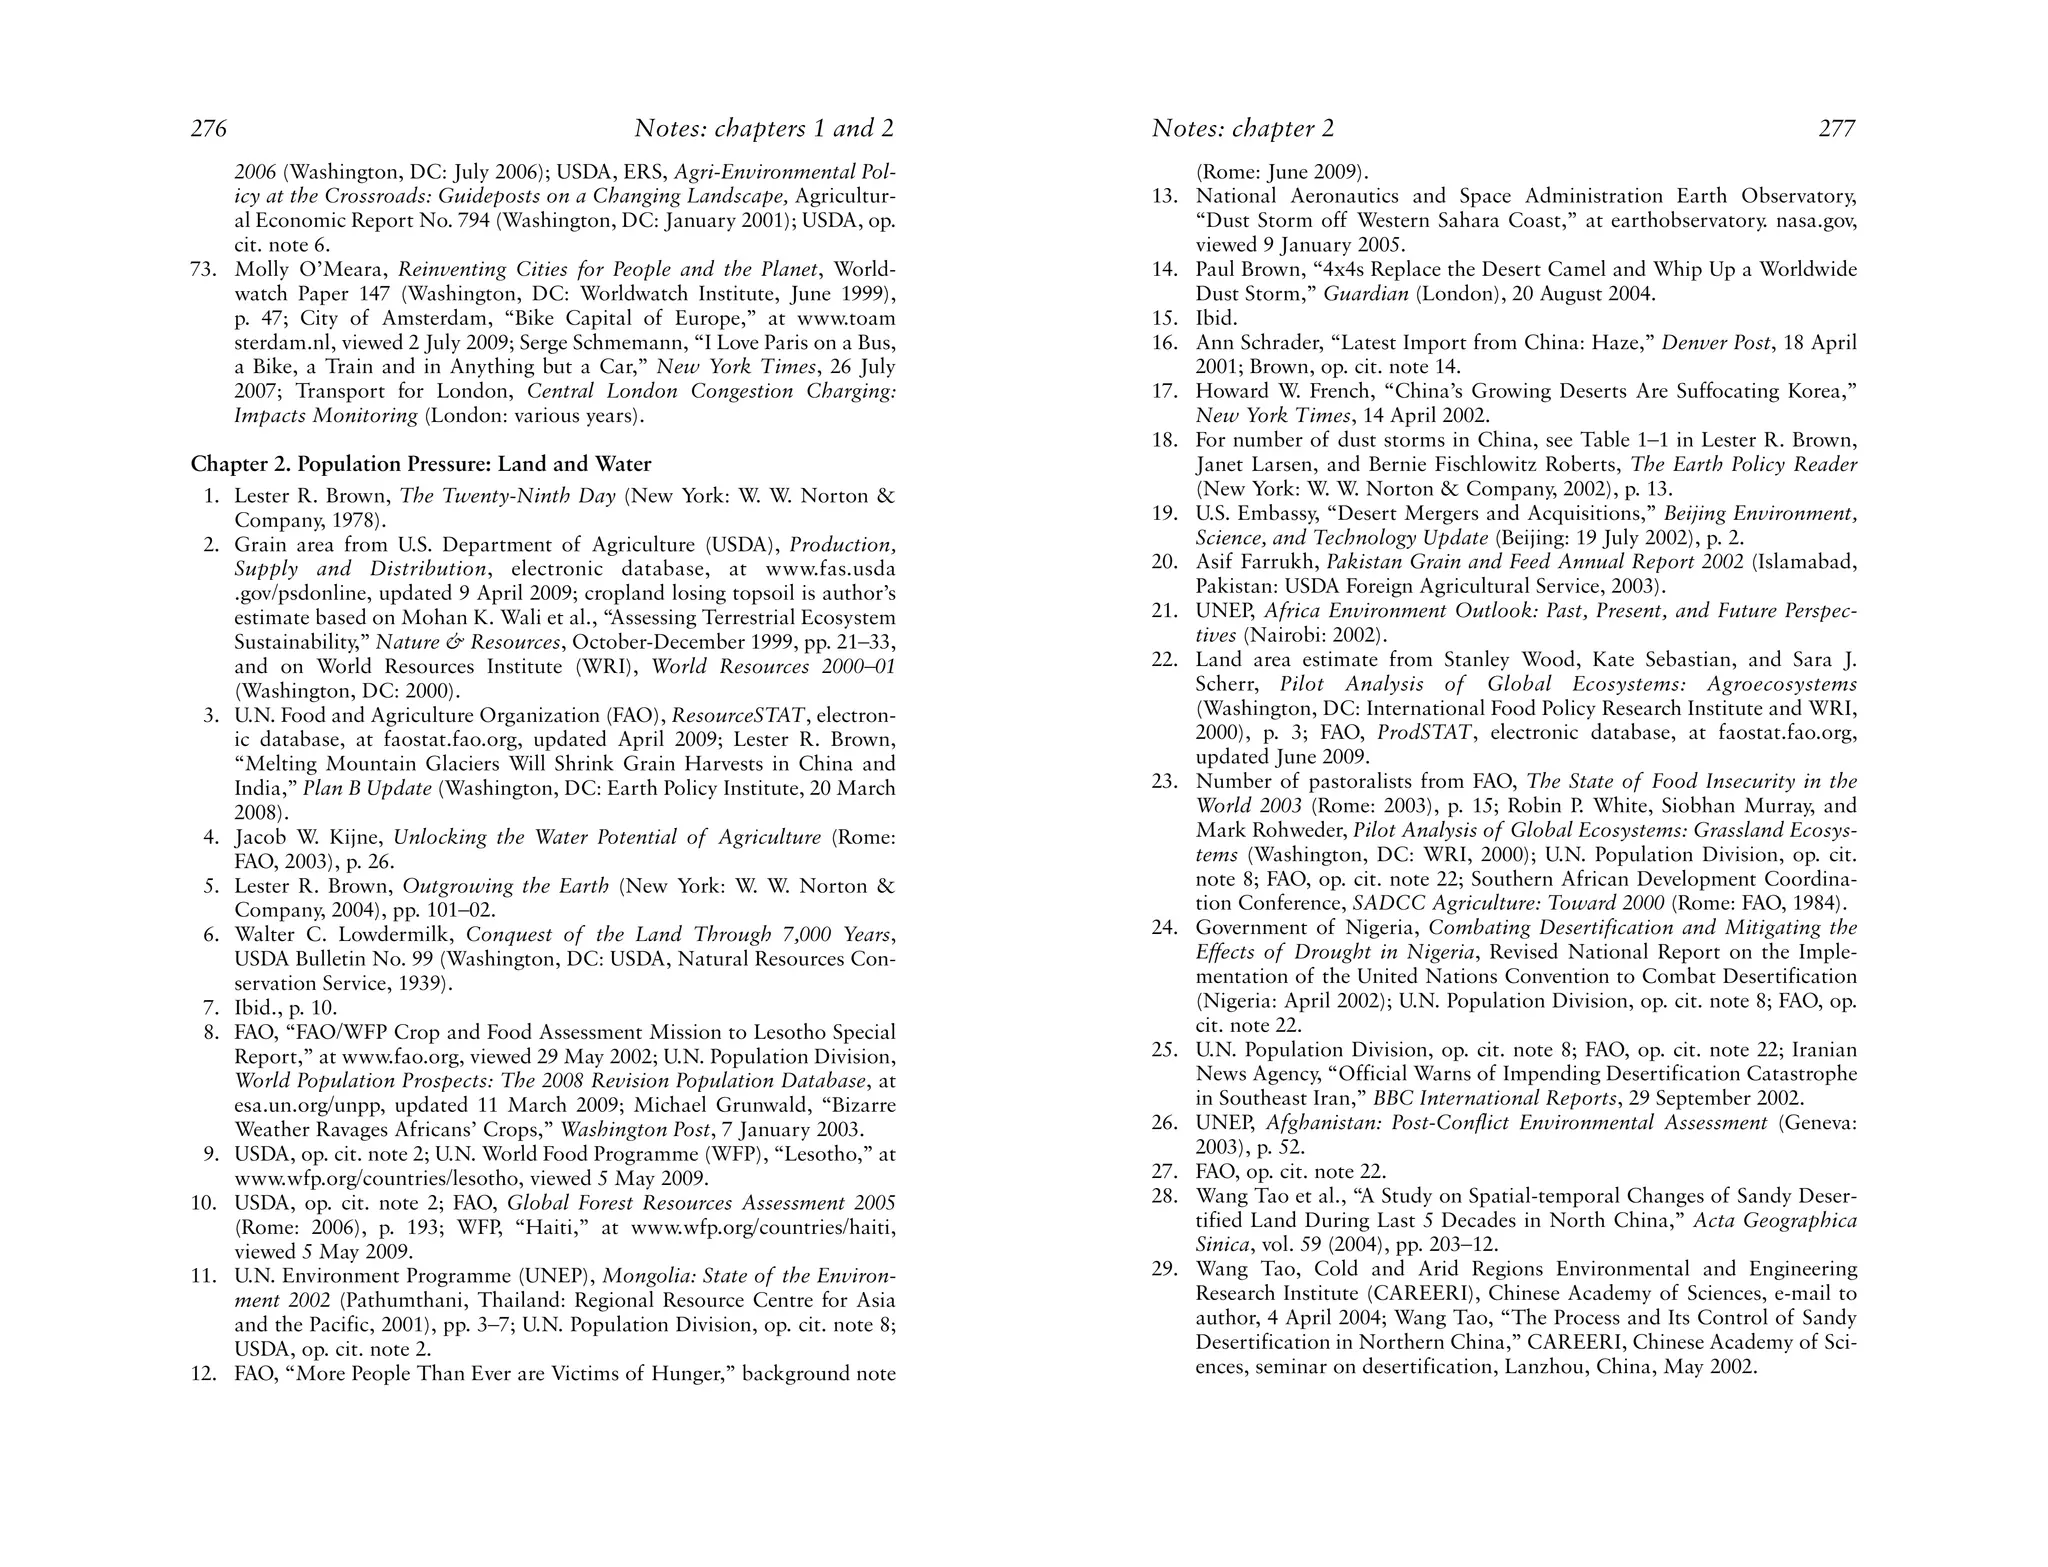
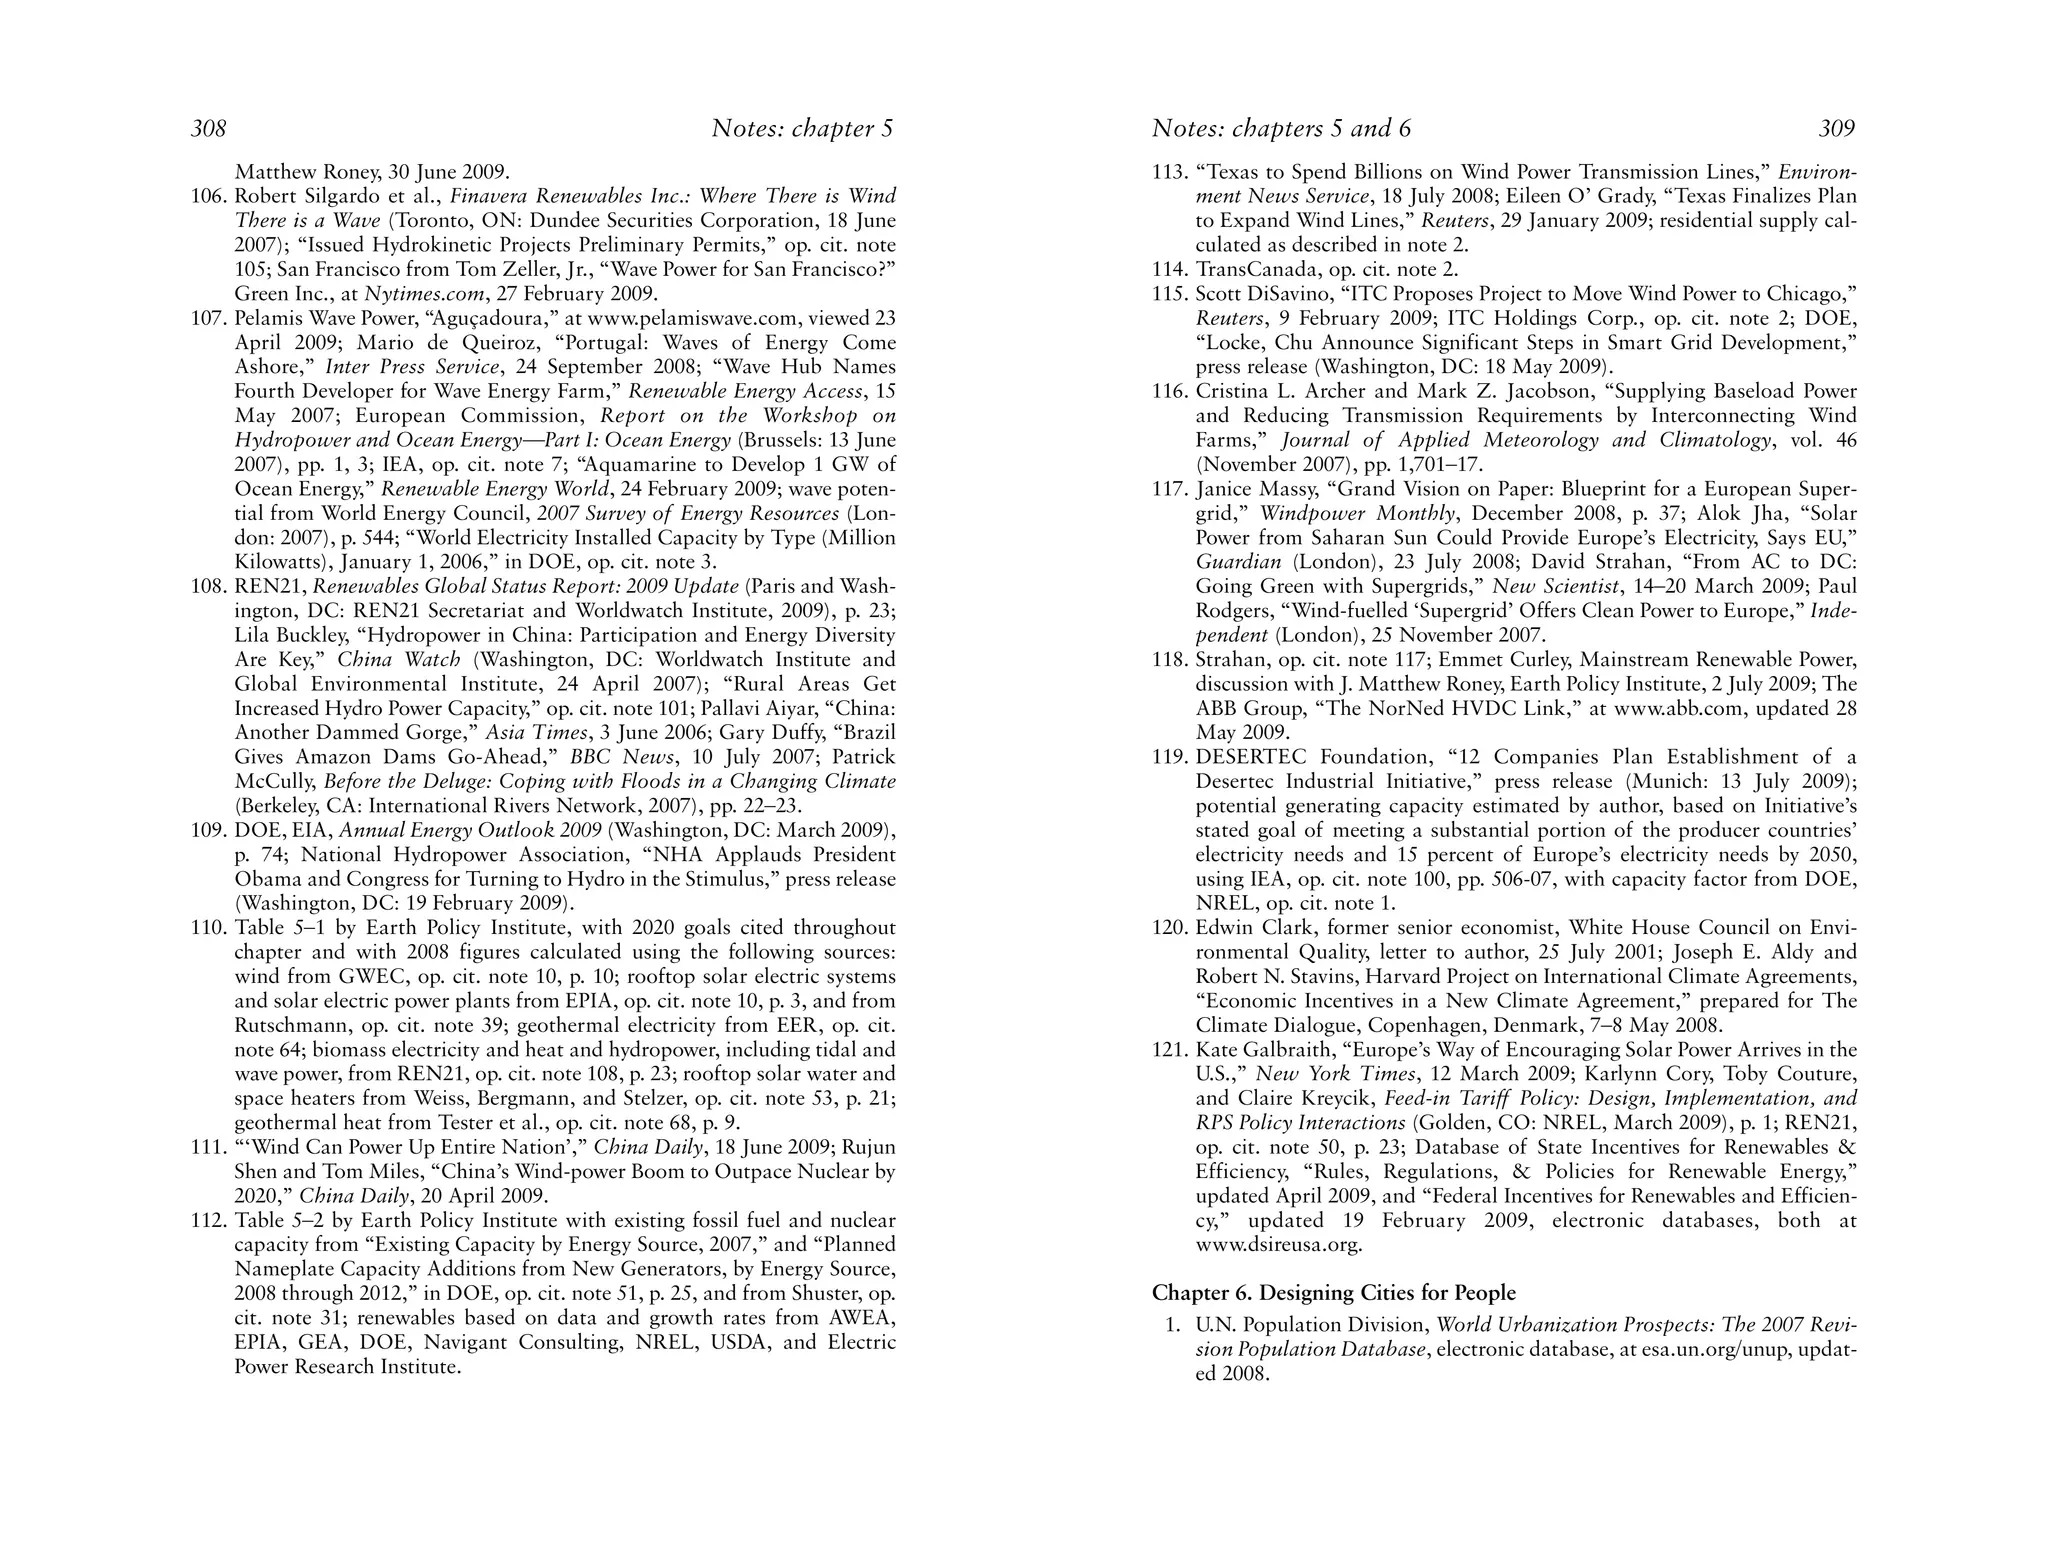
![44 PLAN B 4.0 Population Pressure: Land and Water 45
of wheat in recent years. It now imports close to 40 percent of lion people have died and over 4 million have been displaced in
its total grain supply, a dependence that reflects a population the long-standing conflict between the Muslim north and the
that is outgrowing the grain harvest that can be produced with Christian south. The more recent conflict in the Darfur region
the Nile’s water. Algeria, with 34 million people, imports more in western Sudan that began in 2003 illustrates the mounting
than 70 percent of its grain.58 tensions between two Muslim groups—camel herders and sub-
Overall, the water required to produce the grain and other sistence farmers. Government troops are backing the Arab
farm products imported into the Middle East and North Africa herder militias, who are engaging in the wholesale slaughter of
last year exceeded the annual flow of the Nile River at Aswan. black Sudanese farmers in an effort to drive them off their land,
In effect, the region’s water deficit can be thought of as another sending them into refugee camps in neighboring Chad. An esti-
Nile flowing into the region in the form of imported food.59 mated 300,000 people have been killed in the conflict or died of
It is often said that future wars in the Middle East will more hunger and disease in the refugee camps.62
likely be fought over water than oil, but in reality the competi- Overgrazing and declining rainfall are combining to destroy
tion for water is taking place in world grain markets. Beyond the grasslands in this region. But well before the rainfall decline,
this, several countries in the region are now attempting to the seeds of the conflict were being sown as Sudan’s population
acquire land in other countries and, what is more important, climbed from 9 million in 1950 to 40 million in 2007, a fourfold
the water that comes with it. rise. Meanwhile, the cattle population increased from 7 million
Knowing where water deficits are developing today tells us to 41 million, an increase of nearly sixfold. The number of
where grain deficits will be concentrated tomorrow. Thus far, sheep and goats increased from 14 million to 94 million, a near
the countries importing much of their grain have been smaller sevenfold increase. No grassland can survive such rapid contin-
ones. Now we are looking at the growing water deficits in both uous growth in livestock populations.63
China and India, each with more than a billion people. At what In Nigeria, where 151 million people are crammed into an
point does water scarcity translate into food scarcity?60 area not much larger than Texas, overgrazing and overplowing
are converting grassland and cropland into desert, putting
Land and Water Conflicts farmers and herders in a war for survival. As Somini Sengupta
As land and water become scarce, competition for these vital reported in the New York Times in June 2004, “in recent years,
resources intensifies within societies, particularly between the as the desert has spread, trees have been felled and the popula-
wealthy and those who are poor and dispossessed. The shrink- tions of both herders and farmers have soared, the competition
age of life-supporting resources per person that comes with for land has only intensified.”64
population growth is threatening to drop the living standards of Unfortunately, the division between herders and farmers is
millions of people below the survival level, leading to potential- also often the division between Muslims and Christians. The
ly unmanageable social tensions. competition for land, amplified by religious differences and
Access to land is a prime source of social tension. Expand- combined with a large number of frustrated young men with
ing world population has cut the grainland per person in half guns, has created what the New York Times described as a
since 1950 to a mere quarter-acre, equal to half of a building lot “combustible mix” that has “fueled a recent orgy of violence
in a U.S. suburb. The shrinkage in cropland per person not only across this fertile central Nigerian state [Plateau]. Churches and
threatens livelihoods; in largely subsistence societies, it threat- mosques were razed. Neighbor turned against neighbor.
ens survival itself. Tensions within communities begin to build Reprisal attacks spread until finally…the government imposed
as landholdings shrink below that needed for survival.61 emergency rule.”65
The Sahelian zone of Africa, with its fast-growing popula- Similar divisions exist between herders and farmers in north-
tions, is an area of spreading conflict. In troubled Sudan, 2 mil- ern Mali, the New York Times noted, where “swords and sticks](https://image.slidesharecdn.com/planb4-0-100602035908-phpapp02/75/Plan-b-4-0-Mobilizing-to-Save-Civilization-30-2048.jpg)
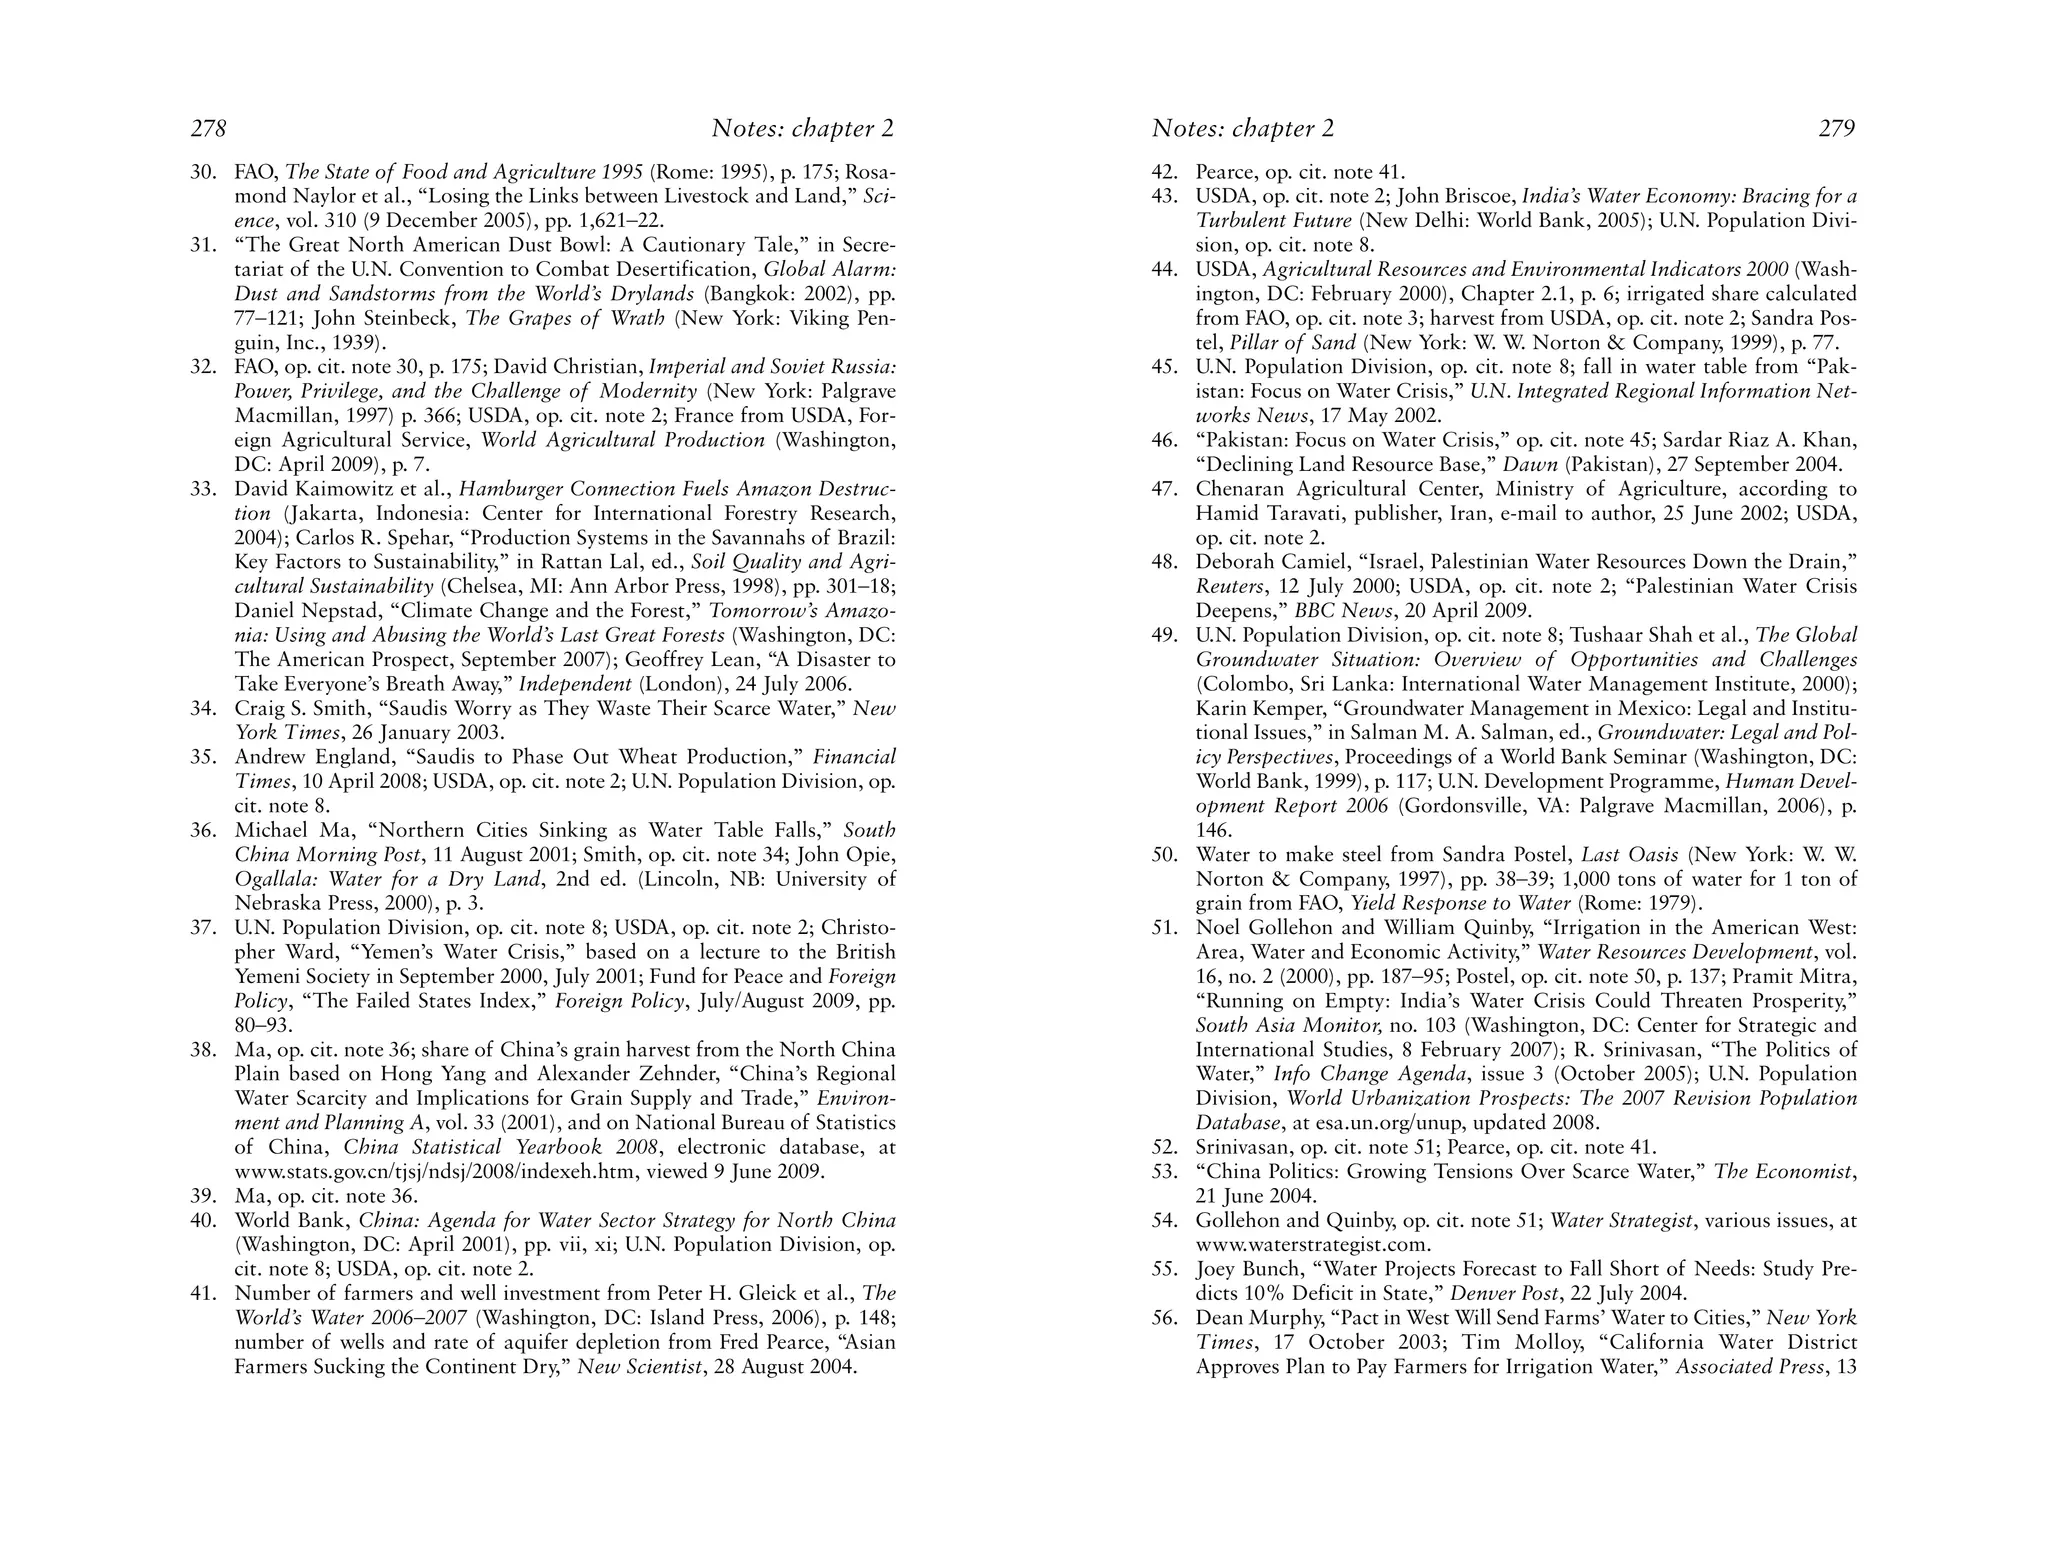
![46 PLAN B 4.0 Population Pressure: Land and Water 47
have been chucked for Kalashnikovs, as desertification and pop- organized attack by Hutus, leading to an estimated 800,000
ulation growth have stiffened the competition between the deaths of Tutsis and moderate Hutus in 100 days. In some vil-
largely black African farmers and the ethnic Tuareg and Fulani lages, whole families were slaughtered lest there be survivors to
herders. Tempers are raw on both sides. The dispute, after all, is claim the family plot of land.70
over livelihood and even more, about a way of life.”66 Africa is not alone. In India, tension between Hindus and
Rwanda is a classic case study in how mounting population Muslims is never far below the surface. As each successive gen-
pressure can translate into political tension, conflict, and social eration further subdivides already small plots, pressure on the
tragedy. James Gasana, who was Rwanda’s Minister of Agricul- land is intense. The pressure on water resources is even greater.
ture and Environment in 1990–92, offers some insights. As the With India’s population projected to grow from 1.2 billion in
chair of a national agricultural commission in 1990, he had 2008 to 1.6 billion in 2050, a collision between rising human
warned that without “profound transformations in its agricul- numbers and shrinking water supplies seems inevitable. The
ture, [Rwanda] will not be capable of feeding adequately its risk is that India could face social conflicts that would dwarf
population under the present growth rate.” Although the coun- those in Rwanda. As James Gasana notes, the relationship
try’s demographers projected major future gains in population, between population and natural systems is a national security
Gasana said in 1990 that he did not see how Rwanda would issue, one that can spawn conflicts along geographic, tribal, eth-
reach 10 million inhabitants without social disorder “unless nic, or religious lines.71
important progress in agriculture, as well as other sectors of the Disagreements over the allocation of water among countries
economy, were achieved.”67 that share river systems is a common source of international
Gasana’s warning of possible social disorder was prophetic. political conflict, especially where populations are outgrowing
He further described how siblings inherited land from their par- the flow of the river. Nowhere is this potential conflict more
ents and how, with an average of seven children per family, plots stark than among Egypt, Sudan, and Ethiopia in the Nile River
that were already small were fragmented further. Many farmers valley. Agriculture in Egypt, where it rarely rains, is wholly
tried to find new land, moving onto steeply sloping mountains. dependent on water from the Nile. Egypt now gets the lion’s
By 1989, almost half of Rwanda’s cultivated land was on slopes share of the Nile’s water, but its current population of 82 mil-
of 10 to 35 degrees, land that is universally considered uncul- lion is projected to reach 130 million by 2050, thus greatly
tivable.68 expanding the demand for grain and water. Sudan, whose 41
In 1950, Rwanda’s population was 2.4 million. By 1993, it million people also depend heavily on food produced with Nile
had tripled to 7.5 million, making it the most densely populat- water, is expected to have 76 million by 2050. And the number
ed country in Africa. As population grew, so did the demand for of people in Ethiopia, the country that controls 85 percent of
firewood. By 1991, the demand was more than double the sus- the river’s headwaters, is projected to expand from 81 million to
tainable yield of local forests. As trees disappeared, straw and 174 million. Beyond this, recent acquisitions of vast tracts of
other crop residues were used for cooking fuel. With less organ- land in Sudan by other countries for farming will further boost
ic matter in the soil, land fertility declined.69 demands on the Nile.72
As the health of the land deteriorated, so did that of the peo- Since there is little water left in the Nile when it reaches the
ple dependent on it. Eventually there was simply not enough Mediterranean, if either Sudan or Ethiopia takes more water,
food to go around. A quiet desperation developed. Like a Egypt will get less, making it increasingly difficult to feed an
drought-afflicted countryside, it could be ignited with a single additional 48 million people. Although there is an existing
match. That ignition came with the crash of a plane on April 6, water rights agreement among the three countries, Ethiopia
1994, shot down as it approached the capital Kigali, killing Pres- receives only a minuscule share of water. Given its aspirations
ident Juvenal Habyarimana, a Hutu. The crash unleashed an for a better life, and with the headwaters of the Nile being one](https://image.slidesharecdn.com/planb4-0-100602035908-phpapp02/75/Plan-b-4-0-Mobilizing-to-Save-Civilization-31-2048.jpg)
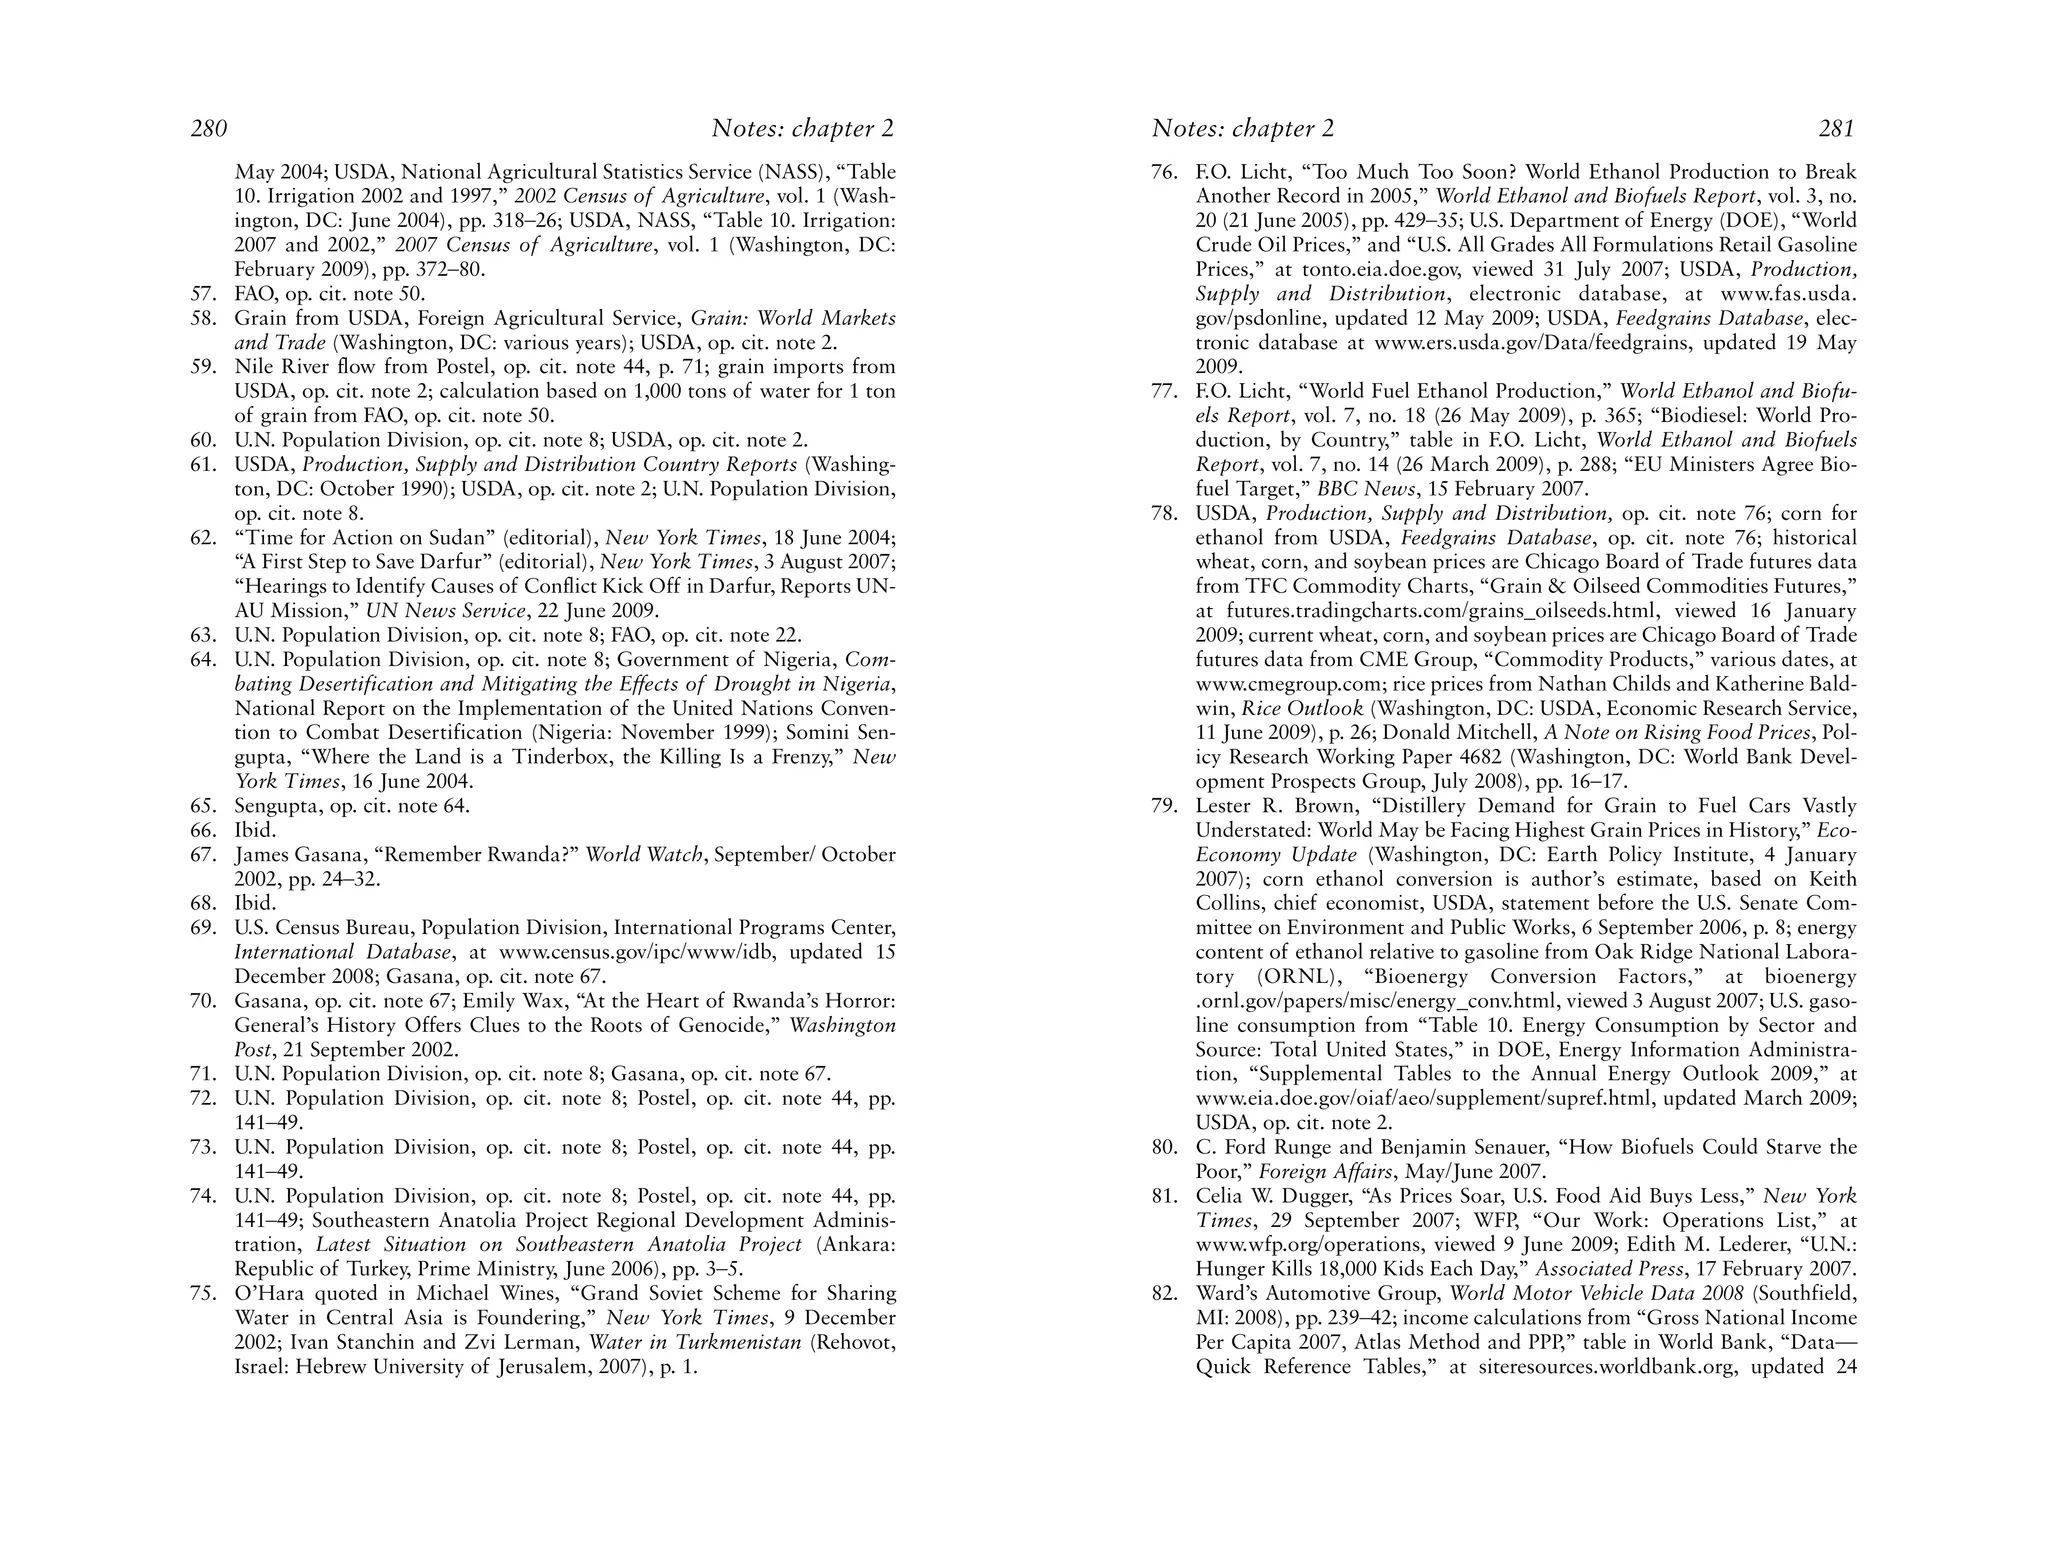
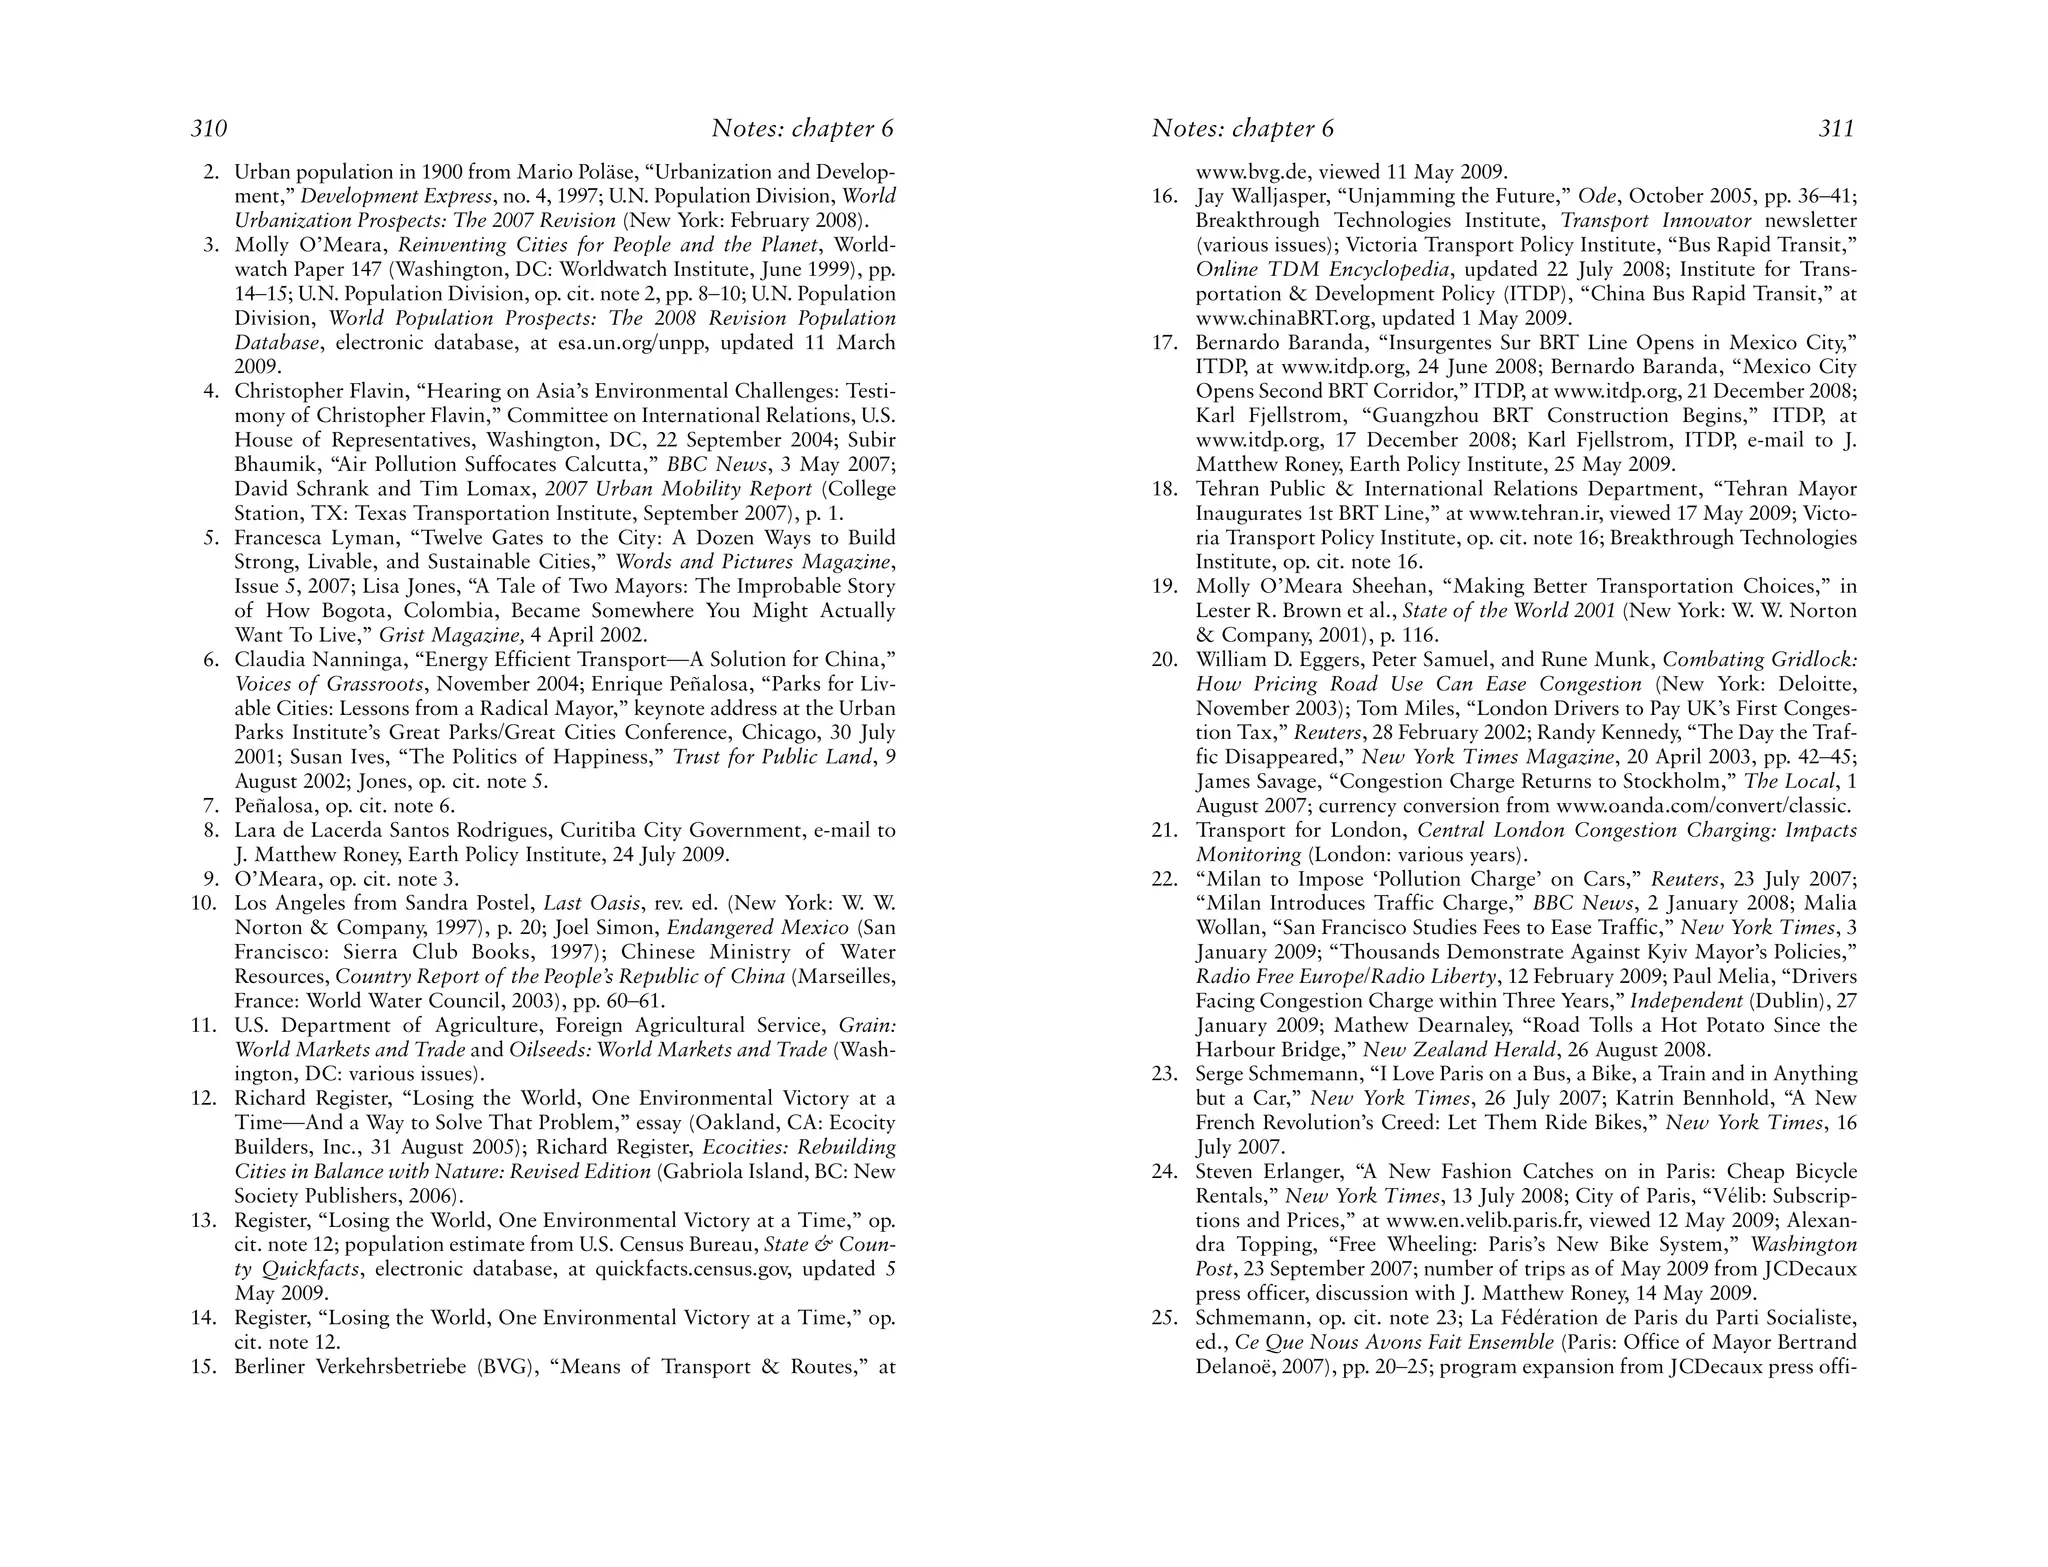
![52 PLAN B 4.0 Population Pressure: Land and Water 53
were political, economic, or environmental refugees. Failed states Today, bodies washing ashore in Italy, Spain, and Turkey are
like Somalia produce all three. We do know that Somalia is an a daily occurrence, the result of desperate acts by desperate peo-
ecological disaster, with overpopulation, overgrazing, and the ple. And each day Mexicans risk their lives in the Arizona desert
resulting desertification destroying its pastoral economy.88 trying to reach jobs in the United States. On average, some
Perhaps the largest flow of Somali migrants is into Yemen, 100,000 or more Mexicans leave rural areas every year, aban-
another failing state. In 2008 an estimated 50,000 migrants and doning plots of land too small or too eroded to make a living.
asylum seekers reached Yemen, 70 percent more than in 2007. They either head for Mexican cities or try to cross illegally into
And during the first three months of 2009 the migrant flow was the United States. Many of those who try to cross the Arizona
up 30 percent over the same period in 2008. These numbers sim- desert perish in its punishing heat. Since 2001, some 200 bodies
ply add to the already unsustainable pressures on Yemen’s land have been found along the Arizona border each year.93
and water resources, hastening its decline.89 With the vast majority of the 2.4 billion people to be added
On April 30, 2006, a man fishing off the coast of Barbados to the world by 2050 coming in countries where water tables are
discovered a 20-foot boat adrift with the bodies of 11 young already falling, water refugees are likely to become common-
men on board, bodies that were “virtually mummified” by the place. They will be most common in arid and semiarid regions
sun and salty ocean spray. As the end drew near, one passenger where populations are outgrowing the water supply and sinking
left a note tucked between two bodies: “I would like to send my into hydrological poverty. Villages in northwestern India are
family in Basada [Senegal] a sum of money. Please excuse me being abandoned as aquifers are depleted and people can no
and goodbye.” The author of the note was apparently one of a longer find water. Millions of villagers in northern and western
group of 52 who had left Senegal on Christmas Eve aboard a China and in parts of Mexico may have to move because of a
boat destined for the Canary Islands, a jumping off point for lack of water.94
Europe. They must have drifted for some 2,000 miles, ending Advancing deserts are squeezing expanding populations into
their trip in the Caribbean. This boat was not unique. During an ever smaller geographic area. Whereas the U.S. Dust Bowl
the first weekend of September 2006, police intercepted boats displaced 3 million people, the advancing desert in China’s Dust
from Mauritania with a record total of nearly 1,200 people on Bowl provinces could displace tens of millions.95
board.90 Africa, too, is facing this problem. The Sahara Desert is
For those living in Central American countries, including pushing the populations of Morocco, Tunisia, and Algeria
Honduras, Guatemala, Nicaragua, and El Salvador, Mexico is northward toward the Mediterranean. In a desperate effort to
often the gateway to the United States. In 2008, Mexican immi- deal with drought and desertification, Morocco is geographi-
gration authorities reported some 39,000 detentions and 89,000 cally restructuring its agriculture, replacing grain with less
deportations.91 thirsty orchards and vineyards.96
In the city of Tapachula on the Guatemala-Mexico border, In Iran, villages abandoned because of spreading deserts or
young men in search of jobs wait along the tracks for a slow- a lack of water already number in the thousands. In the vicini-
moving freight train passing through the city en route to the ty of Damavand, a small town within an hour’s drive of Tehran,
north. Some make it onto the train. Others do not. The Jesús el 88 villages have been abandoned. And as the desert takes over in
Buen Pastor refuge is home to 25 amputees who lost their grip Nigeria, farmers and herders are forced to move, squeezed into
and fell under a train while trying to board. For these young a shrinking area of productive land. Desertification refugees
men, says Olga Sánchez Martínez, the director of the refuge, typically end up in cities, many in squatter settlements. Others
this is the “end of their American dream.” A local priest, Flor migrate abroad.97
María Rigoni, calls the migrants attempting to board the trains In Latin America, deserts are expanding and forcing people
“the kamikazes of poverty.”92 to move in both Brazil and Mexico. In Brazil, some 66 million](https://image.slidesharecdn.com/planb4-0-100602035908-phpapp02/75/Plan-b-4-0-Mobilizing-to-Save-Civilization-34-2048.jpg)
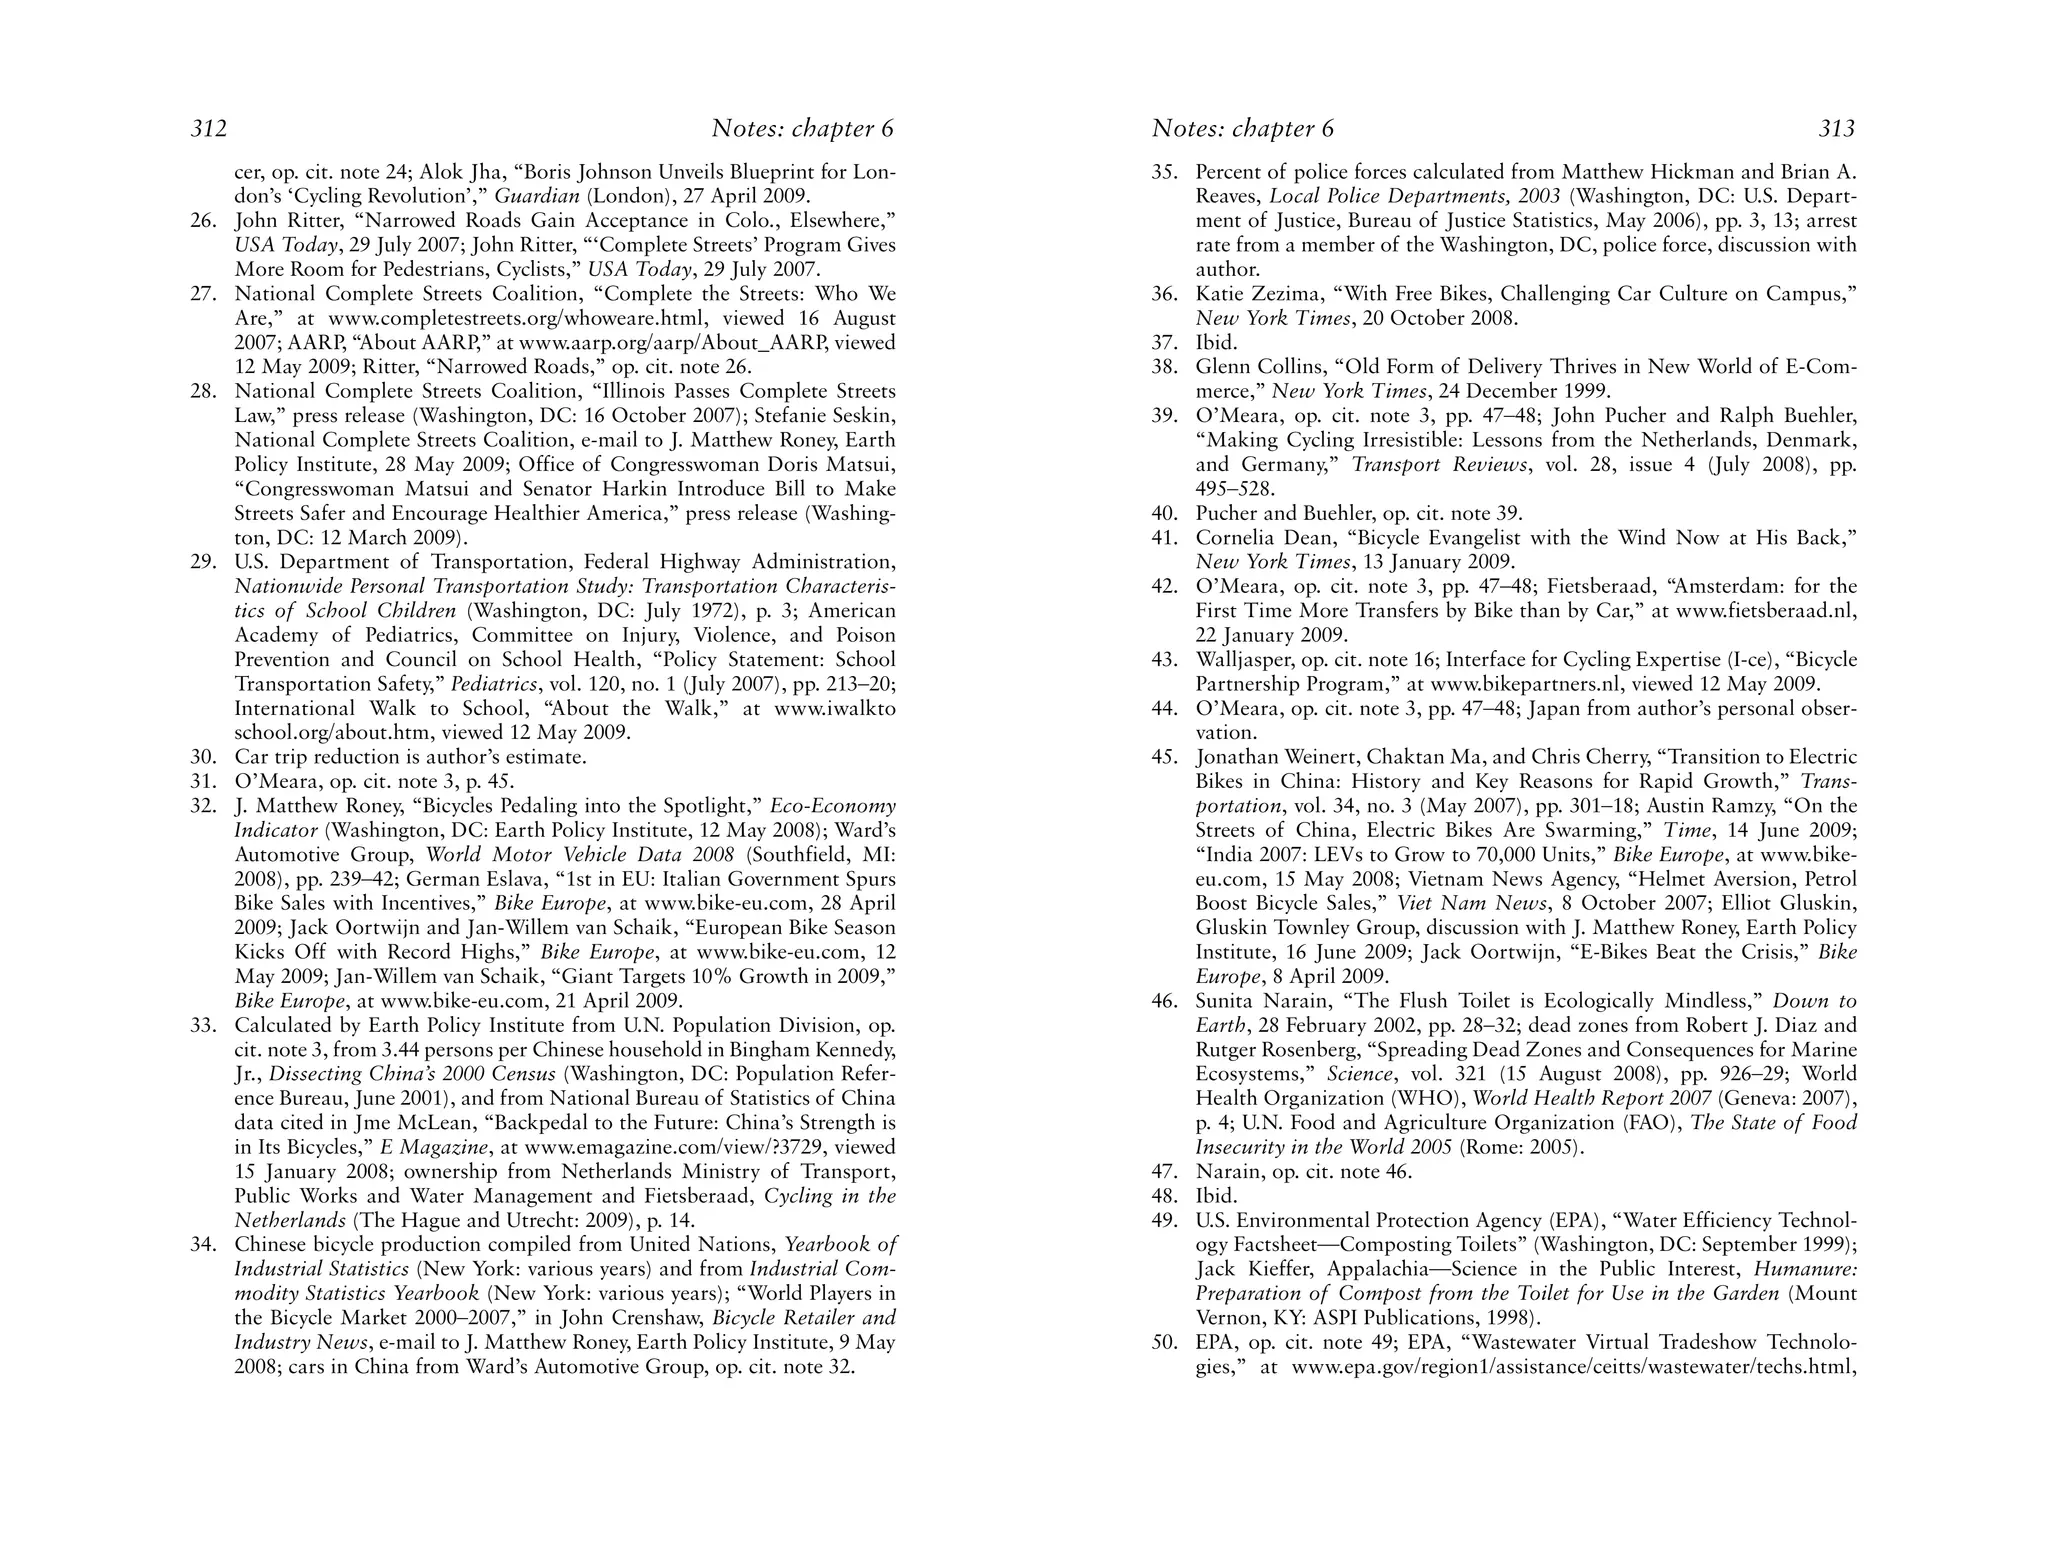
![62 PLAN B 4.0 Climate Change and the Energy Transition 63
The ACIA report noted that the retreat of the sea ice has Arctic Circle, its ice sheet—up to 1.6 kilometers (1 mile) thick in
devastating consequences for polar bears, whose very survival places—is beginning to show the effects.33
may be at stake. A subsequent report indicated that polar bears, Several recent studies report accelerated melting of the
desperate for food, are turning to cannibalism. Two thirds of Greenland ice sheet. In September 2006, a University of Col-
the polar bear population could be gone by 2050.29 orado team study published in Nature indicated that between
There is new evidence that Arctic sea ice is melting faster April 2004 and April 2006 Greenland lost ice 2.5 times faster
than previously thought. Scientists from the National Snow and than during the preceding two years. In October 2006, a team of
Ice Data Center and NCAR examining data on Arctic Ocean NASA scientists reported that the flow of glaciers into the sea
summer ice since 1953 concluded that the ice is melting much was accelerating. Eric Rignot, a glaciologist at NASA’s Jet
faster than climate models had predicted. They found that from Propulsion Laboratory, said that “none of this has been predict-
1979 to 2006 the summer sea ice shrinkage accelerated to 9.1 ed by numerical models, and therefore all projections of the con-
percent a decade. In the summer of 2007, a record melt year, tribution of Greenland to sea level [rise] are way below reality.”34
Arctic sea ice shrank to an area some 20 percent smaller than In late summer 2007 scientists at a symposium in Ilulissat,
the previous record set in 2005. Recent evidence that the multi- Greenland, said that the Greenland icecap is melting so fast that
year sea ice is not recovering in winter and therefore thinning it is triggering minor earthquakes as pieces of ice weighing mil-
overall only adds to concern about the ice cap’s future.30 lions of tons break off and slide into the sea. ACIA chairman
Walt Meier, a researcher at the U.S. National Snow and Ice Corell reported that “we have seen a massive acceleration of the
Data Center, views the winter shrinkage with alarm. He speed with which these glaciers are moving into the sea.” The
believes there is “a good chance” that the Arctic tipping point Ilulissat (Jakobshavn Isbrae) glacier, a large outlet glacier on
has been reached. Some scientists now think that the Arctic Greenland’s southwest coast, is moving at 2 meters per hour on
Ocean could be ice-free in summer as early as 2015, but in early a front 8 kilometers (5 miles) wide and 900 meters deep.35
2009 Warwick Vincent, director of the Center for Northern Data gathered by NASA satellites indicated that Greenland’s
Studies at Laval University in Quebec, reported that this could floating ice shelves shrank by 24 square miles in 2007. In the
happen by 2013. Arctic scientist Julienne Stroeve observed that summer of 2008 this loss jumped to 71 square miles, nearly
the shrinking Arctic sea ice may have reached “a tipping point tripling. Part of this loss was observed directly by an Ohio State
that could trigger a cascade of climate change reaching into University research team, which saw a massive 11-square-mile
Earth’s temperate regions.”31 chunk of ice break off from the Petermann Glacier in northern
Scientists have long been concerned that a self-reinforcing Greenland. An upstream crack in the glacier suggested an even
trend may be starting to kick in as the sea ice shrinks. When larger chunk would be breaking off soon.36
incoming sunlight strikes the ice in the Arctic Ocean, up to 70 What scientists once thought was a simple linear process—
percent of it is reflected back into space. Only 30 percent is that at the surface an ice sheet melts a fixed amount each year,
absorbed. As the Arctic sea ice melts, however, and the incom- depending on the temperature—is now seen to be much more
ing sunlight hits the much darker open water, only 6 percent is complex. As the surface ice begins to melt, some of the water
reflected back into space and 94 percent is converted into heat. filters down through cracks in the glacier, lubricating the sur-
This albedo effect helps explain the accelerating shrinkage of face between the glacier and the rock beneath it. This acceler-
the Arctic sea ice and the rapidly rising regional temperature.32 ates the glacial flow and the calving of icebergs into the
If all the ice in the Arctic Ocean melts, it will not affect sea surrounding ocean. The relatively warm water flowing through
level because the ice is already in the water. But it will lead to a the moulins (deep holes) and cracks in the ice sheet also carries
much warmer Arctic region as more of the incoming sunlight is surface heat deep inside it far faster than it would otherwise
converted to heat. And since Greenland lies largely within the penetrate by simple conduction.37](https://image.slidesharecdn.com/planb4-0-100602035908-phpapp02/75/Plan-b-4-0-Mobilizing-to-Save-Civilization-40-2048.jpg)
![72 PLAN B 4.0 Climate Change and the Energy Transition 73
trillion barrels, of which 1 trillion have been extracted so far. By technologies is increasingly difficult.77
themselves, however, these numbers miss a central point. As The big news in 2008 was the announcement by Russia, the
security analyst Michael Klare notes, the first trillion barrels world’s leading oil producer in recent years, that its oil output
was easy oil: “oil that’s found on shore or near to shore; oil close had peaked in the late 2007 and would henceforth be declining.
to the surface and concentrated in large reservoirs; oil produced Data through mid-2009 confirm the decline, supporting those
in friendly, safe, and welcoming places.” The other half, Klare who think world oil production has already peaked.78
notes, is tough oil: “oil that’s buried far offshore or deep under- Aside from conventional petroleum, which can easily be
ground; oil scattered in small, hard-to-find reservoirs; oil that pumped to the surface, vast amounts of oil are stored in tar
must be obtained from unfriendly, politically dangerous, or haz- sands and in oil shale. The Athabasca tar sand deposits in
ardous places.”74 Alberta, Canada, total an estimated 1.8 trillion barrels, but only
Another clue to the oil production prospect is the actions of about 300 billion barrels of this may be recoverable. Venezuela
the major oil companies themselves. To begin with, the collec- also has a large deposit of extra heavy oil, estimated at 1.2 tril-
tive production of the eight leading independents has peaked lion barrels. Perhaps a third of it could be recovered.79
and is declining. This decline notwithstanding, there have not Oil shale concentrated in Colorado, Wyoming, and Utah in
been any dramatic increases in exploration and development, the United States holds large quantities of kerogen, an organic
suggesting that the companies agree with the petroleum geolo- material that can be converted into oil and gas. In the late 1970s
gists who say that 95 percent of all the oil in the earth has the United States launched a major effort to develop the oil
already been discovered. “The whole world has now been seis- shale on the western slope of the Rocky Mountains in Col-
mically searched and picked over,” says independent geologist orado. When oil prices dropped in 1982, the oil shale industry
Colin Campbell. “Geological knowledge has improved enor- collapsed. Exxon quickly pulled out of its $5-billion Colorado
mously in the past 30 years and it is almost inconceivable now project, and the remaining companies soon followed suit.80
that major fields remain to be found.”75 The one large-scale project that is moving ahead is the tar
Matt Simmons, a prominent oil investment banker, says in sands project in Canada. Launched in the early 1980s, it was
reference to new oil fields: “We’ve run out of good projects. producing 1.3 million barrels of oil a day in 2008, an amount
This is not a money issue...if these oil companies had fantastic equivalent to nearly 7 percent of current U.S. oil consumption.
projects, they’d be out there [developing new fields].” Both Wal- This tar sand oil is not cheap, becoming economical only when
ter Youngquist, author of GeoDestinies, and the late A.M. Sam- oil is priced at $70 per barrel. Some think it may take $90 oil to
sam Bakhtiari of the Iranian National Oil Company projected spur new investments.81
that oil production would peak in 2007.76 There is growing doubt as to whether oil in tar sands and
Yet another way of gauging the oil prospect is simply to look shale should be tapped at all because of the many damaging
at the age of the major oil fields. Of the 20 largest oil fields ever effects, including climate disruption. Since getting oil out of tar
found, 18 were discovered between 1917 (Bolivar in Venezuela) sands requires “cooking” the sands to separate the oil, the car-
and 1968 (Shaybah in Saudi Arabia). The two most recent large bon emissions from producing a barrel of tar sands oil are at
ones, Cantarell in Mexico and East Baghdad Field in Iraq, were least three times those from pumping a barrel of conventional
discovered during the 1970s, but none have been found since oil. As oil analyst Richard Heinberg notes, “Currently, two tons
then. Neither Kazakhstan’s discovery of the Kashagan oil field of sand must be mined in order to yield one barrel of oil.”
in the Caspian Sea in 2000 nor Brazil’s discovery of the Tupi oil Beyond this, the quantity of water needed to extract oil from
field in 2006—both good-sized finds—make the all-time top 20. shale or tar sands can be prohibitive, particularly in the western
With so many of the largest oil fields aging and in decline, off- United States, where virtually all water is spoken for. Consider-
setting this with new discoveries or more-advanced extraction ing carbon emissions, water requirements, local water pollu-](https://image.slidesharecdn.com/planb4-0-100602035908-phpapp02/75/Plan-b-4-0-Mobilizing-to-Save-Civilization-45-2048.jpg)
![146 PLAN B 4.0 Designing Cities for People 147
away that must be lifted over 3,000 feet to augment inadequate For Register, the design of the city and its buildings become
water supplies. Beijing is planning to draw water from the a part of the local landscape, capitalizing on the local ecology.
Yangtze River basin some 800 miles away.10 For example, buildings can be designed to be heated and cooled
Food comes from even greater distances, as illustrated by partly by nature. As oil prices rise, urban fruit and vegetable
Tokyo. While the city still gets its rice from the highly produc- production will expand into vacant lots and onto rooftops.
tive farmers in Japan, with their land carefully protected by gov- Cities can largely live on recycled water that is cleaned and used
ernment policy, its wheat comes largely from the Great Plains of again and again. The “flush and forget” water system will
North America and from Australia. Its corn supply comes large- become too costly for many water-short cities after oil produc-
ly from the U.S. Midwest. Soybeans come from the U.S. Midwest tion peaks.14
and the Brazilian cerrado.11
The oil used to move resources into and out of cities often Redesigning Urban Transport
comes from distant oil fields. Rising oil prices will affect cities, Urban transport systems based on a combination of rail lines,
but they will affect even more the suburbs that surround them. bus lines, bicycle pathways, and pedestrian walkways offer the
The growing scarcity of water and the high energy cost of trans- best of all possible worlds in providing mobility, low-cost trans-
porting it over long distances may begin to constrain the growth portation, and a healthy urban environment.
of some cities. A rail system provides the foundation for a city’s transporta-
Against this backdrop, Richard Register, author of Ecocities: tion. Rails are geographically fixed, providing a permanent
Rebuilding Cities in Balance with Nature, says it is time to fun- means of transport that people can count on. Once in place, the
damentally rethink the design of cities. He agrees with Peñalosa nodes on such a system become the obvious places to concen-
that cities should be designed for people, not for cars. He goes trate office buildings, high-rise apartment buildings, and shops.
even further, talking about pedestrian cities—communities Whether the best fit is underground rail, light-rail surface
designed so that people do not need cars because they can walk systems, or both depends in part on city size and geography.
or take public transportation wherever they need to go. Register Berlin, for example, has both. Megacities regularly turn to
says that a city should be seen as a functioning system not in underground rail systems to provide mobility. For cities of inter-
terms of its parts but in terms of its whole. He also makes a mediate size, light rail is often an attractive option.15
convincing case that cities should be integrated into local As noted earlier, some of the most innovative public trans-
ecosystems rather than imposed on them.12 portation systems, those that shift huge numbers of people
He describes with pride an after-the-fact integration into the from cars into buses, have been developed in Curitiba and
local ecosystem of San Luis Obispo, a California town of Bogotá. The success of Bogotá’s BRT system, TransMilenio,
43,000 residents north of Los Angeles: “[It] has a beautiful which uses special express lanes to move people quickly through
creek restoration project with several streets and through-build- the city, is being replicated not only in six other Colombian
ing passageways lined with shops that connect to the town’s cities but in scores elsewhere too, including Mexico City, São
main commercial street, and people love it. Before closing a Paulo, Hanoi, Seoul, Istanbul, and Quito. In China, Beijing is
street, turning a small parking lot into a park, restoring the one of eight cities with BRT systems in operation.16
creek and making the main street easily accessible to the In Mexico City, the latest extension of the Insurgentes
‘nature’ corridor, that is, the creek, the downtown had a 40 per- Avenue BRT corridor from 13 miles to 19 miles and the addition
cent vacancy rate in the storefronts, and now it has zero. Of of 26 new articulated buses enables this line to carry 260,000
course it’s popular. You sit at your restaurant by the passengers daily. By 2012, the city plans to have 10 BRT lines in
creek...where fresh breezes rustle the trees in a world undis- operation. And in southern China, by the end of 2009
turbed by car noise and blasting exhaust.”13 Guangzhou will put into operation its BRT, which is designed to](https://image.slidesharecdn.com/planb4-0-100602035908-phpapp02/75/Plan-b-4-0-Mobilizing-to-Save-Civilization-84-2048.jpg)
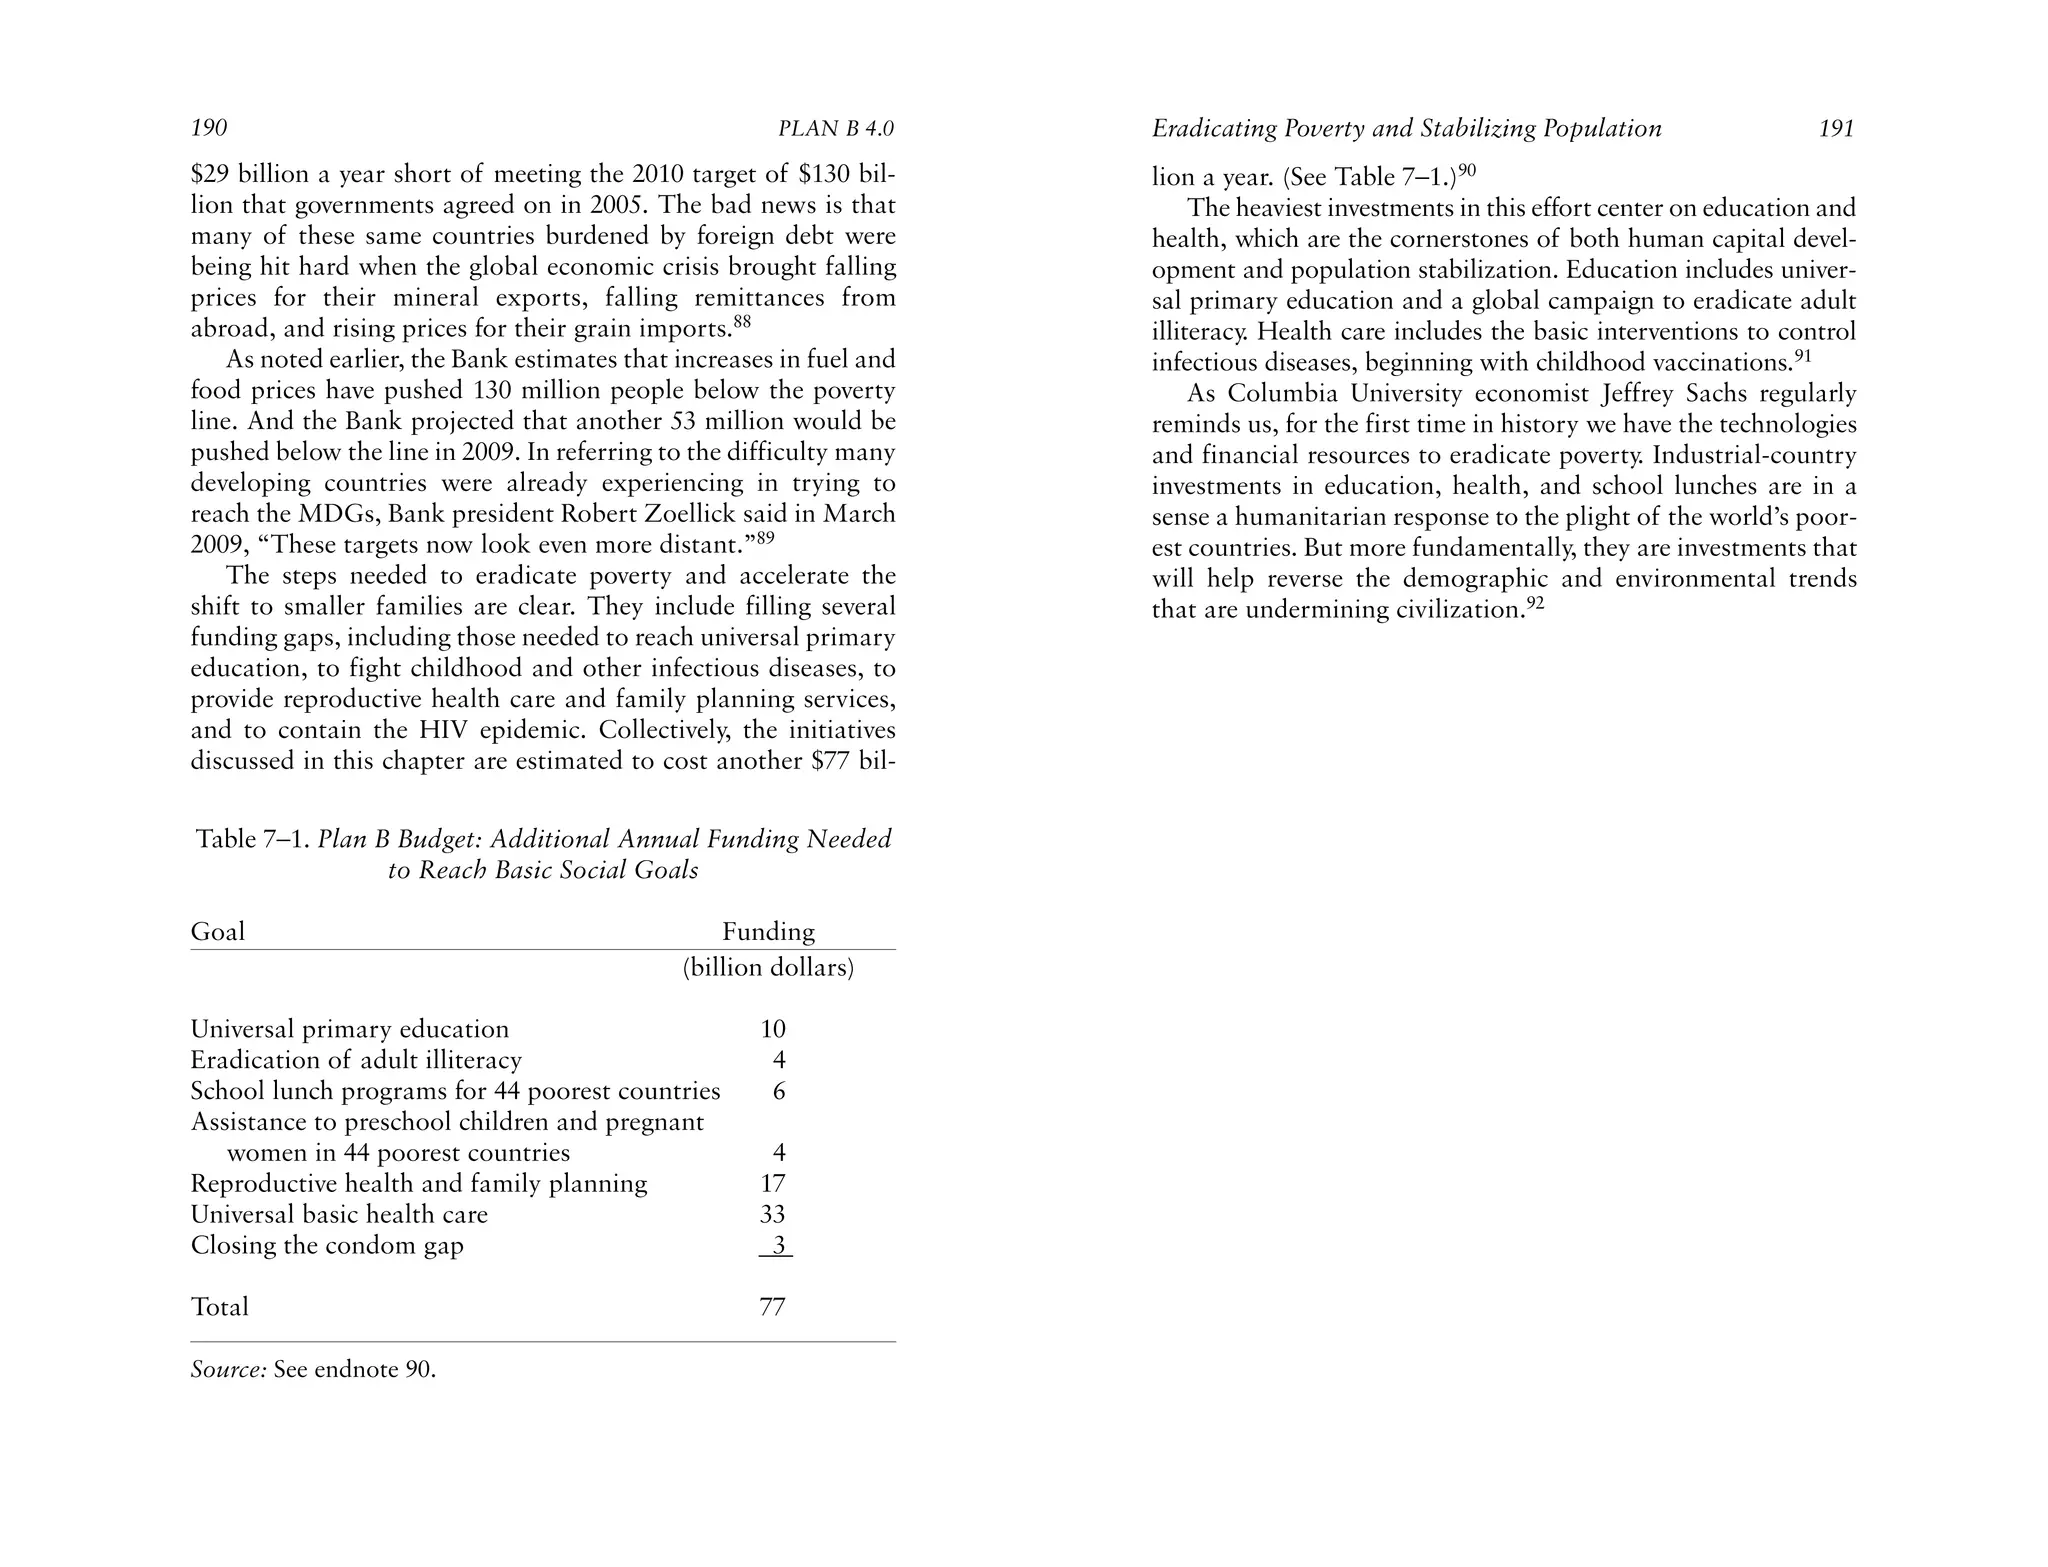
![186 PLAN B 4.0 Eradicating Poverty and Stabilizing Population 187
strong coffee prices and partly because the government is steadi- helping in the overall effort to reverse the process of state
ly gaining in legitimacy—has helped turn things around. failure.78
Ranked fourteenth in 2005, Colombia in 2009 was forty-first on The new Department of Global Security would be funded by
the Foreign Policy list. Neither Liberia nor Colombia are out of shifting fiscal resources from the Department of Defense. In
the woods yet, but both are moving in the right direction.75 effect, the DGS budget would be the new defense budget. It
Failing states are a relatively new phenomenon, and they would focus on the central sources of state failure by helping to
require a new response. The traditional project-based assistance stabilize population, restore environmental support systems,
program is no longer adequate. State failure is a systemic failure eradicate poverty, provide universal primary school education,
that requires a systemic response. and strengthen the rule of law through bolstering police forces,
The United Kingdom and Norway have recognized that fail- court systems, and, where needed, the military.
ing states need special attention and have each set up inter- The DGS would deal with the production of and interna-
agency funds to provide a response mechanism. Whether they tional trafficking in drugs. It would make such issues as debt
are adequately addressing systemic state failure is not yet clear, relief and market access an integral part of U.S. policy. It would
but they do at least recognize the need to devise a specific insti- also provide a forum to coordinate domestic and foreign policy,
tutional response.76 ensuring that domestic policies, such as cotton export subsidies
In contrast, U.S. efforts to deal with weak and failing states or subsidies to convert grain into fuel for cars, do not contribute
are fragmented. Several U.S. government departments are to the failure of other countries. The department would provide
involved, including State, Treasury, and Agriculture, to name a a focus for the United States to help lead a growing internation-
few. And within the State Department, several different offices al effort to reduce the number of failing states. This agency
are concerned with this issue. This lack of focus was recognized would also encourage private investment in failing states by pro-
by the Hart-Rudman U.S. Commission on National Security in viding loan guarantees to spur development.
the Twenty-first Century: “Responsibility today for crisis pre- As part of this effort the United States could rejuvenate the
vention and response is dispersed in multiple AID [U.S. Agency Peace Corps to assist with grassroots programs, including
for International Development] and State bureaus, and among teaching in schools and helping to organize family planning,
State’s Under Secretaries and the AID Administrator. In prac- tree planting, and micro-lending programs. This program
tice, therefore, no one is in charge.”77 would involve young people while developing their sense of civic
What is needed now is a new cabinet-level agency—a pride and social responsibility.
Department of Global Security (DGS)—that would fashion a At a more senior level, the United States has a fast-growing
coherent policy toward each weak and failing state. This rec- reservoir of retired people who are highly skilled in such fields
ommendation, initially set forth in a report of the Commission as management, accounting, law, education, and medicine and
on Weak States and U.S. National Security, recognizes that the who are eager to be of use. Their talents could be mobilized
threats to security are now coming less from military power and through a voluntary Senior Service Corps. The enormous reser-
more from the trends that undermine states, such as rapid pop- voir of management skills in this age group could be tapped to
ulation growth, poverty, deteriorating environmental support augment the skills so lacking in failing-state governments.
systems, and spreading water shortages. The new agency would There are already, of course, a number of volunteer organi-
incorporate AID (now part of the State Department) and all the zations that rely on the talents, energy, and enthusiasm of both
various foreign assistance programs that are currently in other U.S. young people and seniors, including the Peace Corps, Teach
government departments, thereby assuming responsibility for for America, and the Senior Corps. But conditions now require
U.S. development assistance across the board. The State Depart- a more ambitious, systematic effort to tap this talent pool.
ment would provide diplomatic support for this new agency, The world has quietly entered a new era, one where there is](https://image.slidesharecdn.com/planb4-0-100602035908-phpapp02/75/Plan-b-4-0-Mobilizing-to-Save-Civilization-104-2048.jpg)


Lester Brown's 'Plan B' emphasizes the urgent need for a comprehensive approach to address environmental crises, including climate change, food scarcity, and economic decline. The book outlines strategies for restructuring the global economy, eradicating poverty, and reversing environmental degradation. It has been praised by notable figures for its practical solutions and insightful analysis of current global challenges.