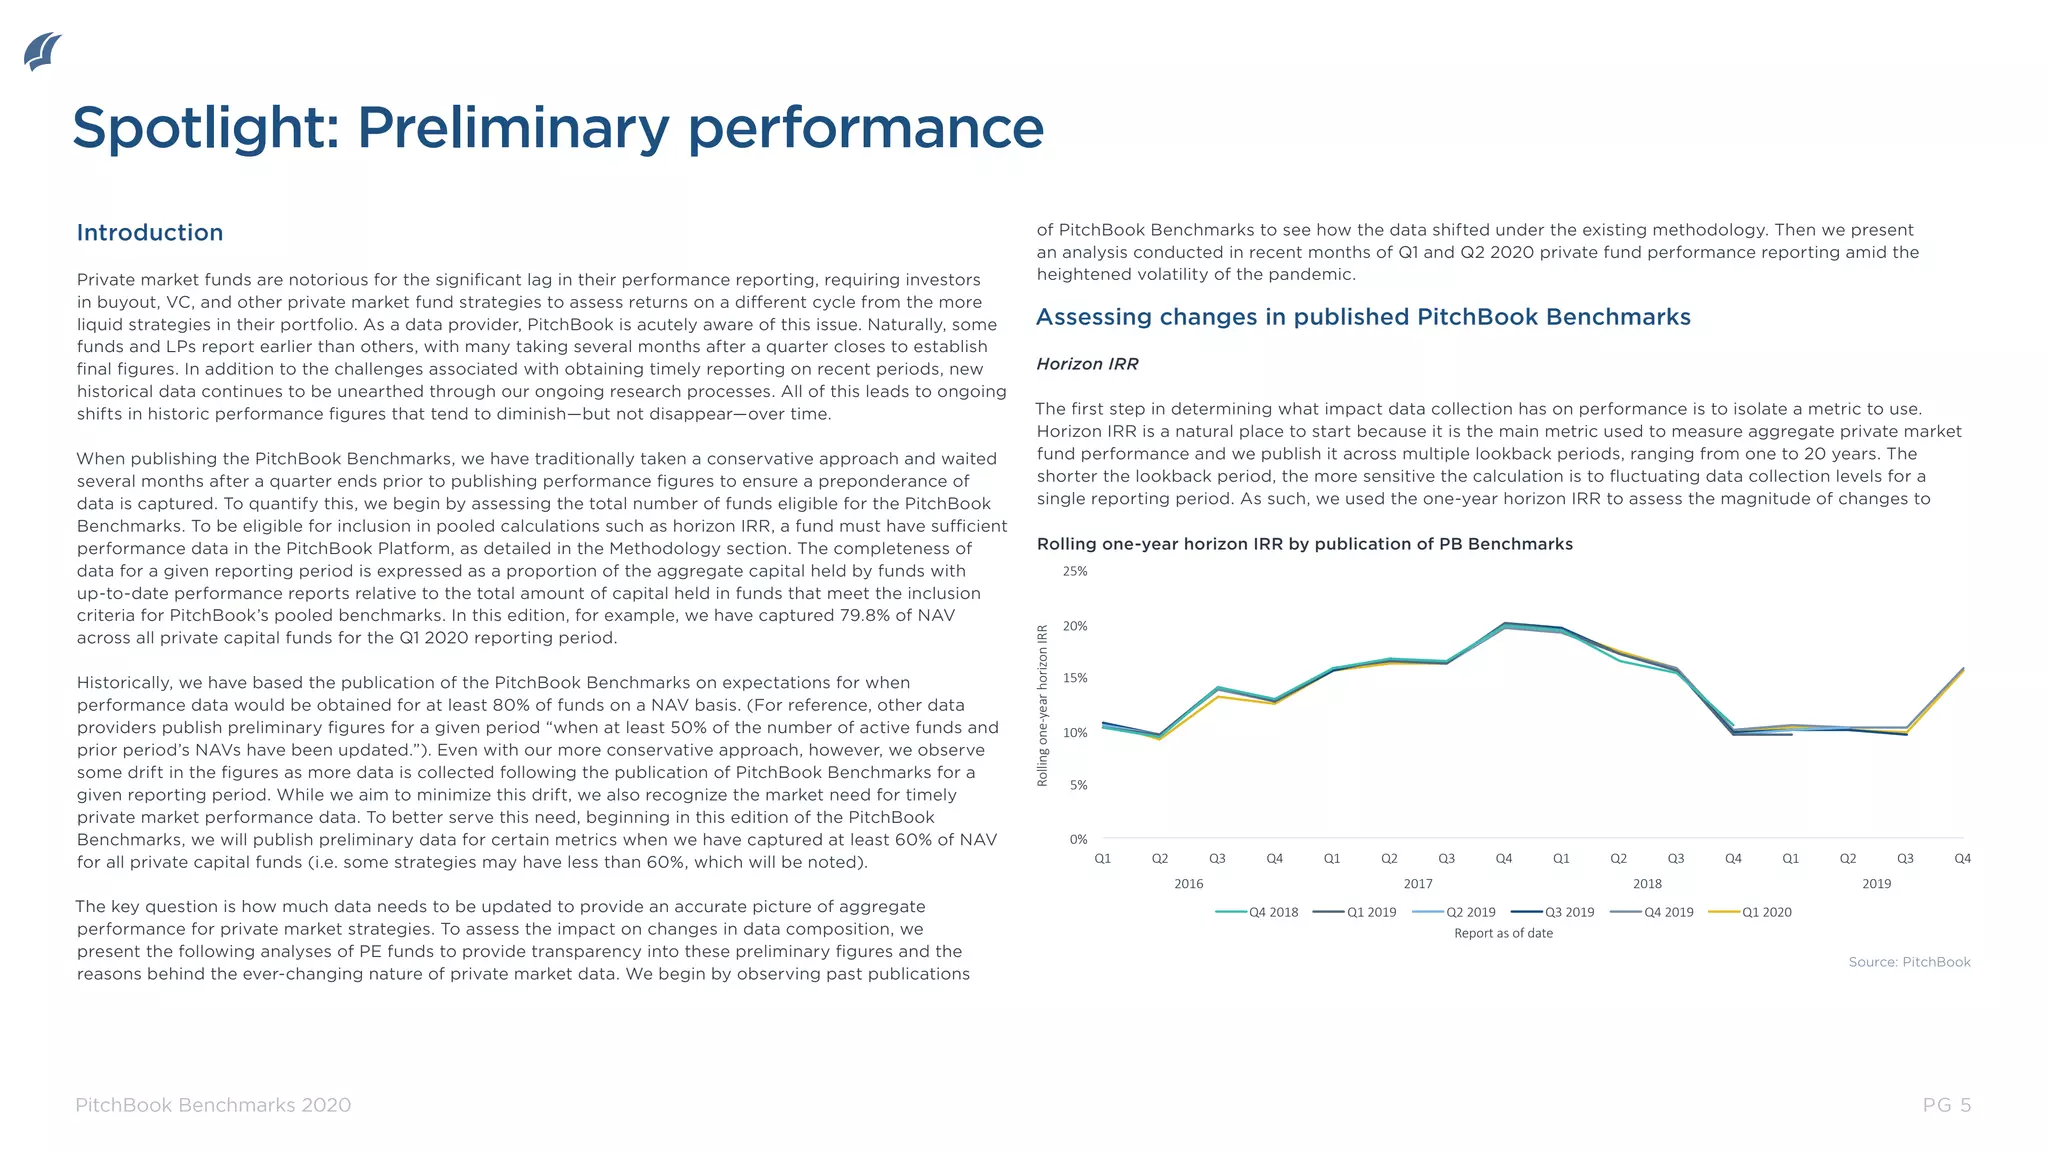
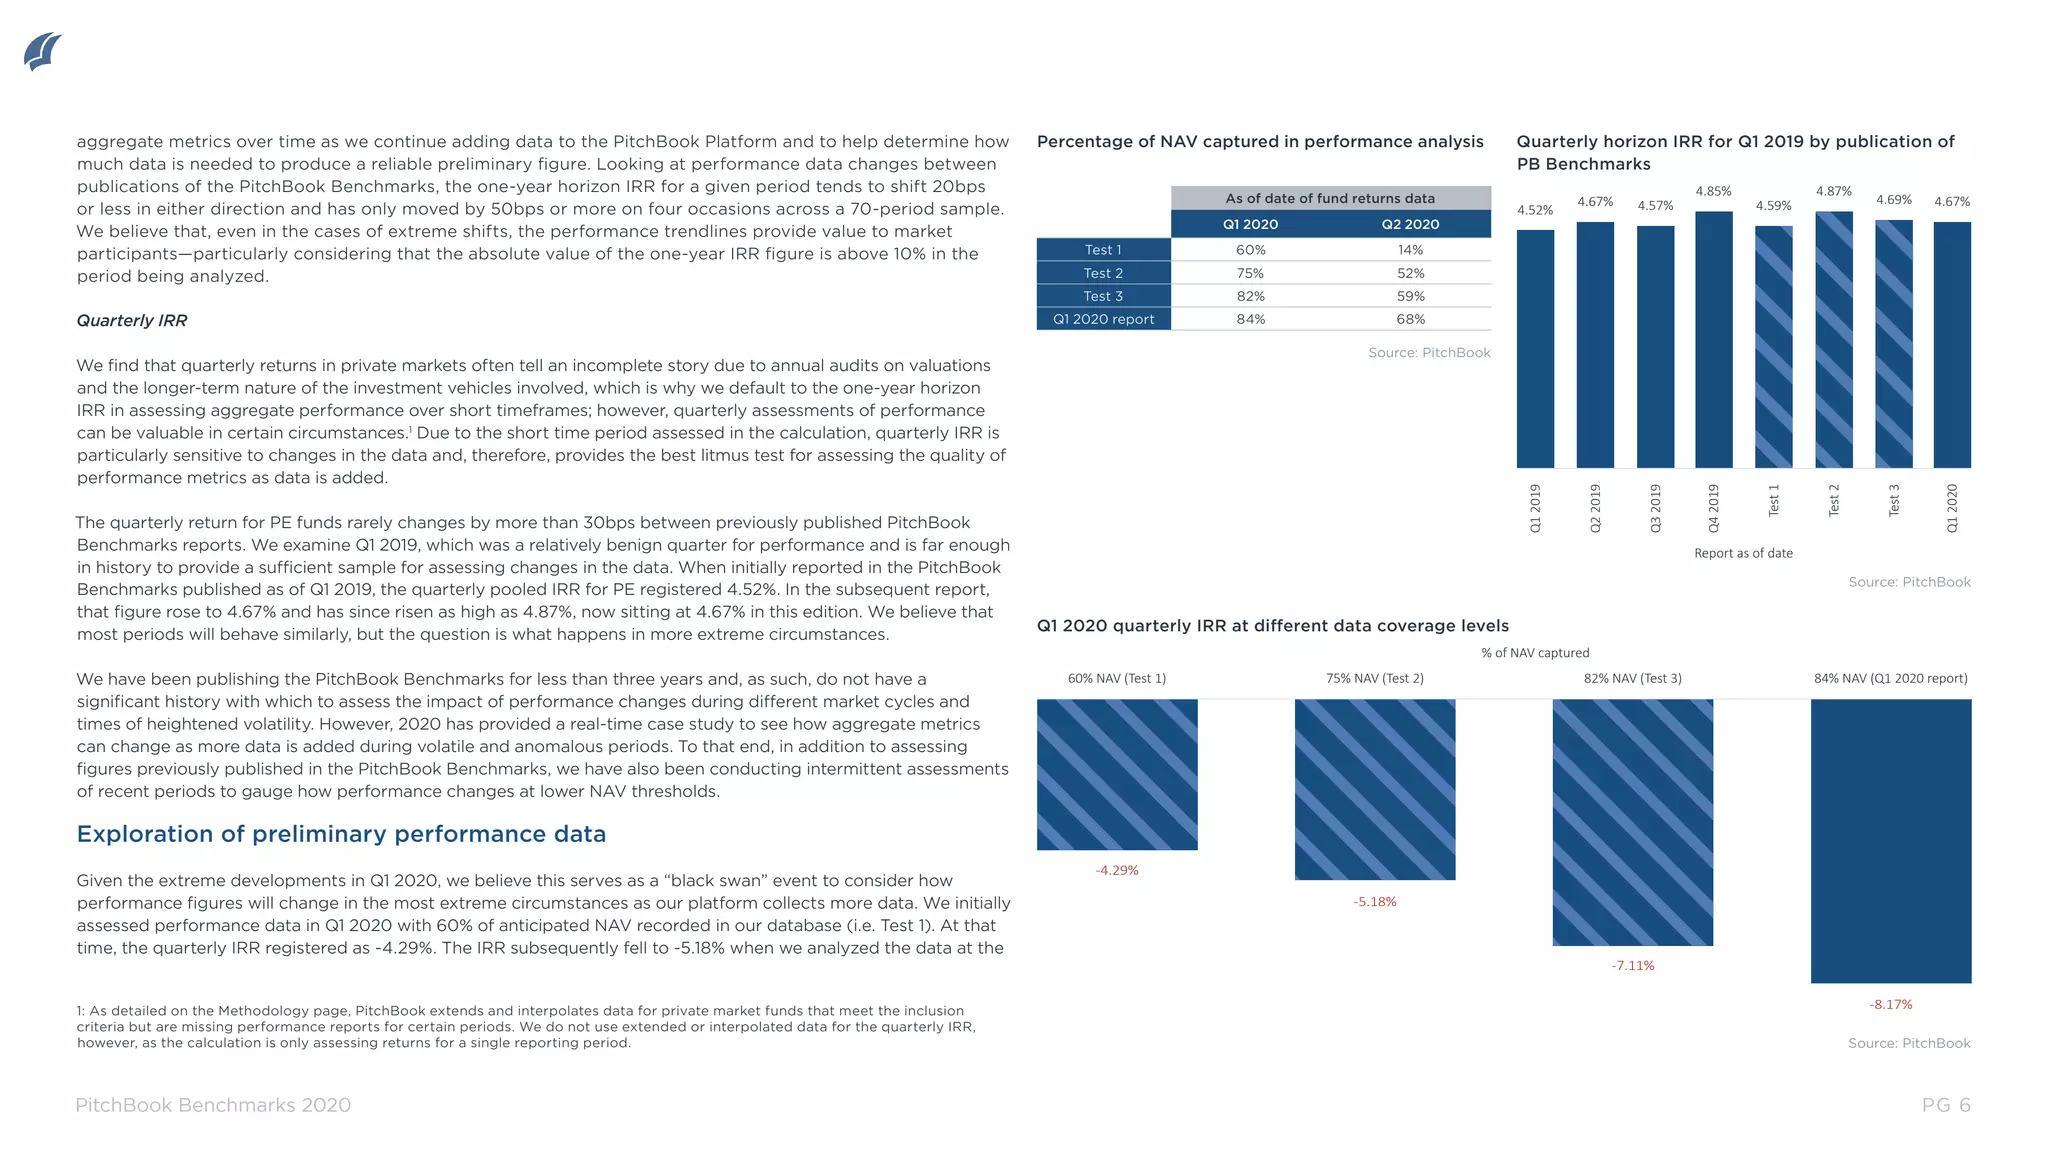
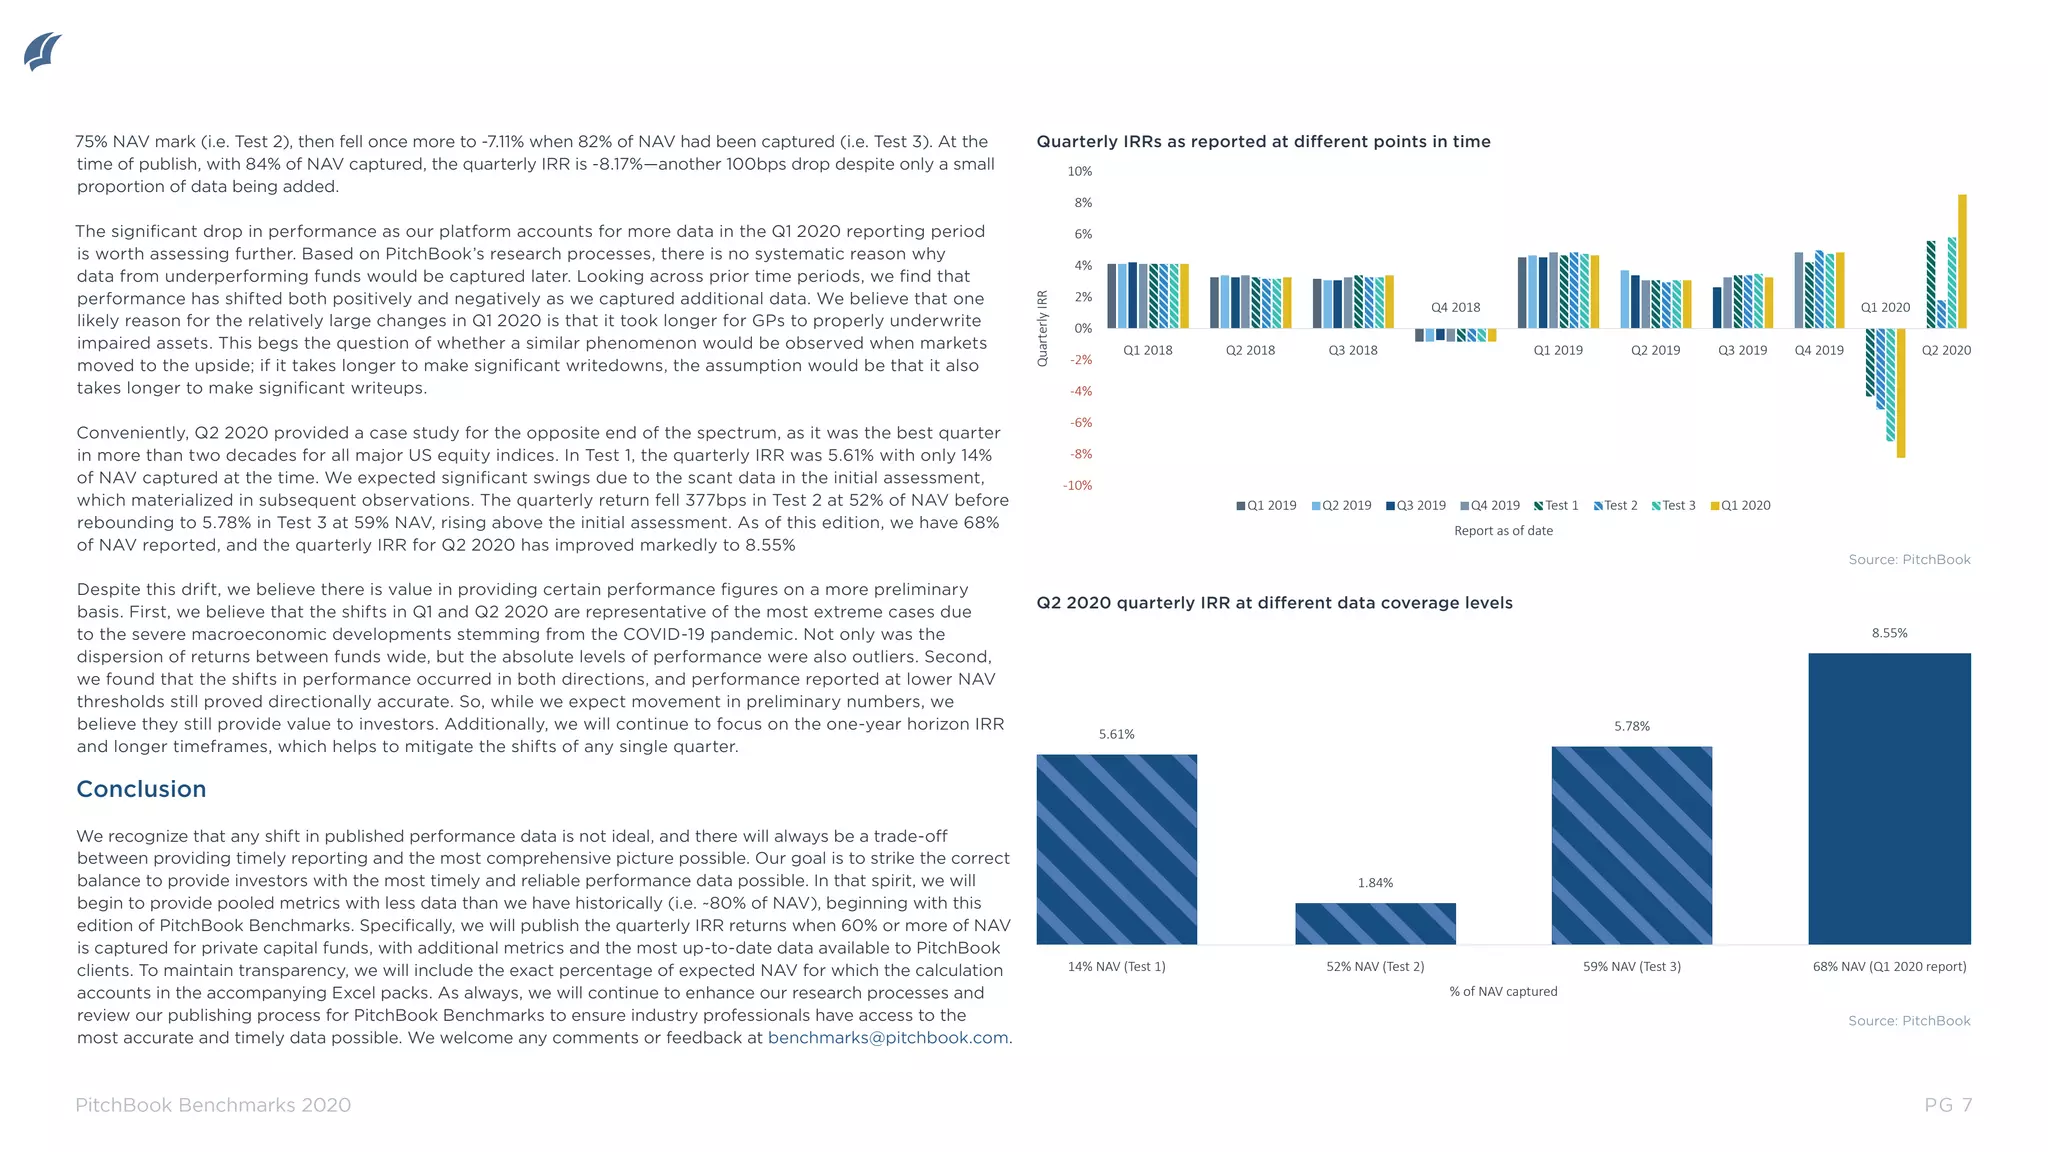
This document discusses preliminary performance data from PitchBook Benchmarks and how performance metrics may change as more fund data is reported over time. It analyzes how the one-year horizon IRR for private equity funds has shifted modestly between previous Benchmark publications. For example, the quarterly IRR for Q1 2019 increased from an initial 4.52% to 4.67% as more data was added. The document also explores preliminary performance data for Q1 2020 to gauge changes during a volatile period, serving as a case study for how metrics could fluctuate in extreme market conditions.

![SEATTLE | SAN FRANCISCO | NEW YORK | LONDON
4
PitchBook Benchmarks: Private Markets Data
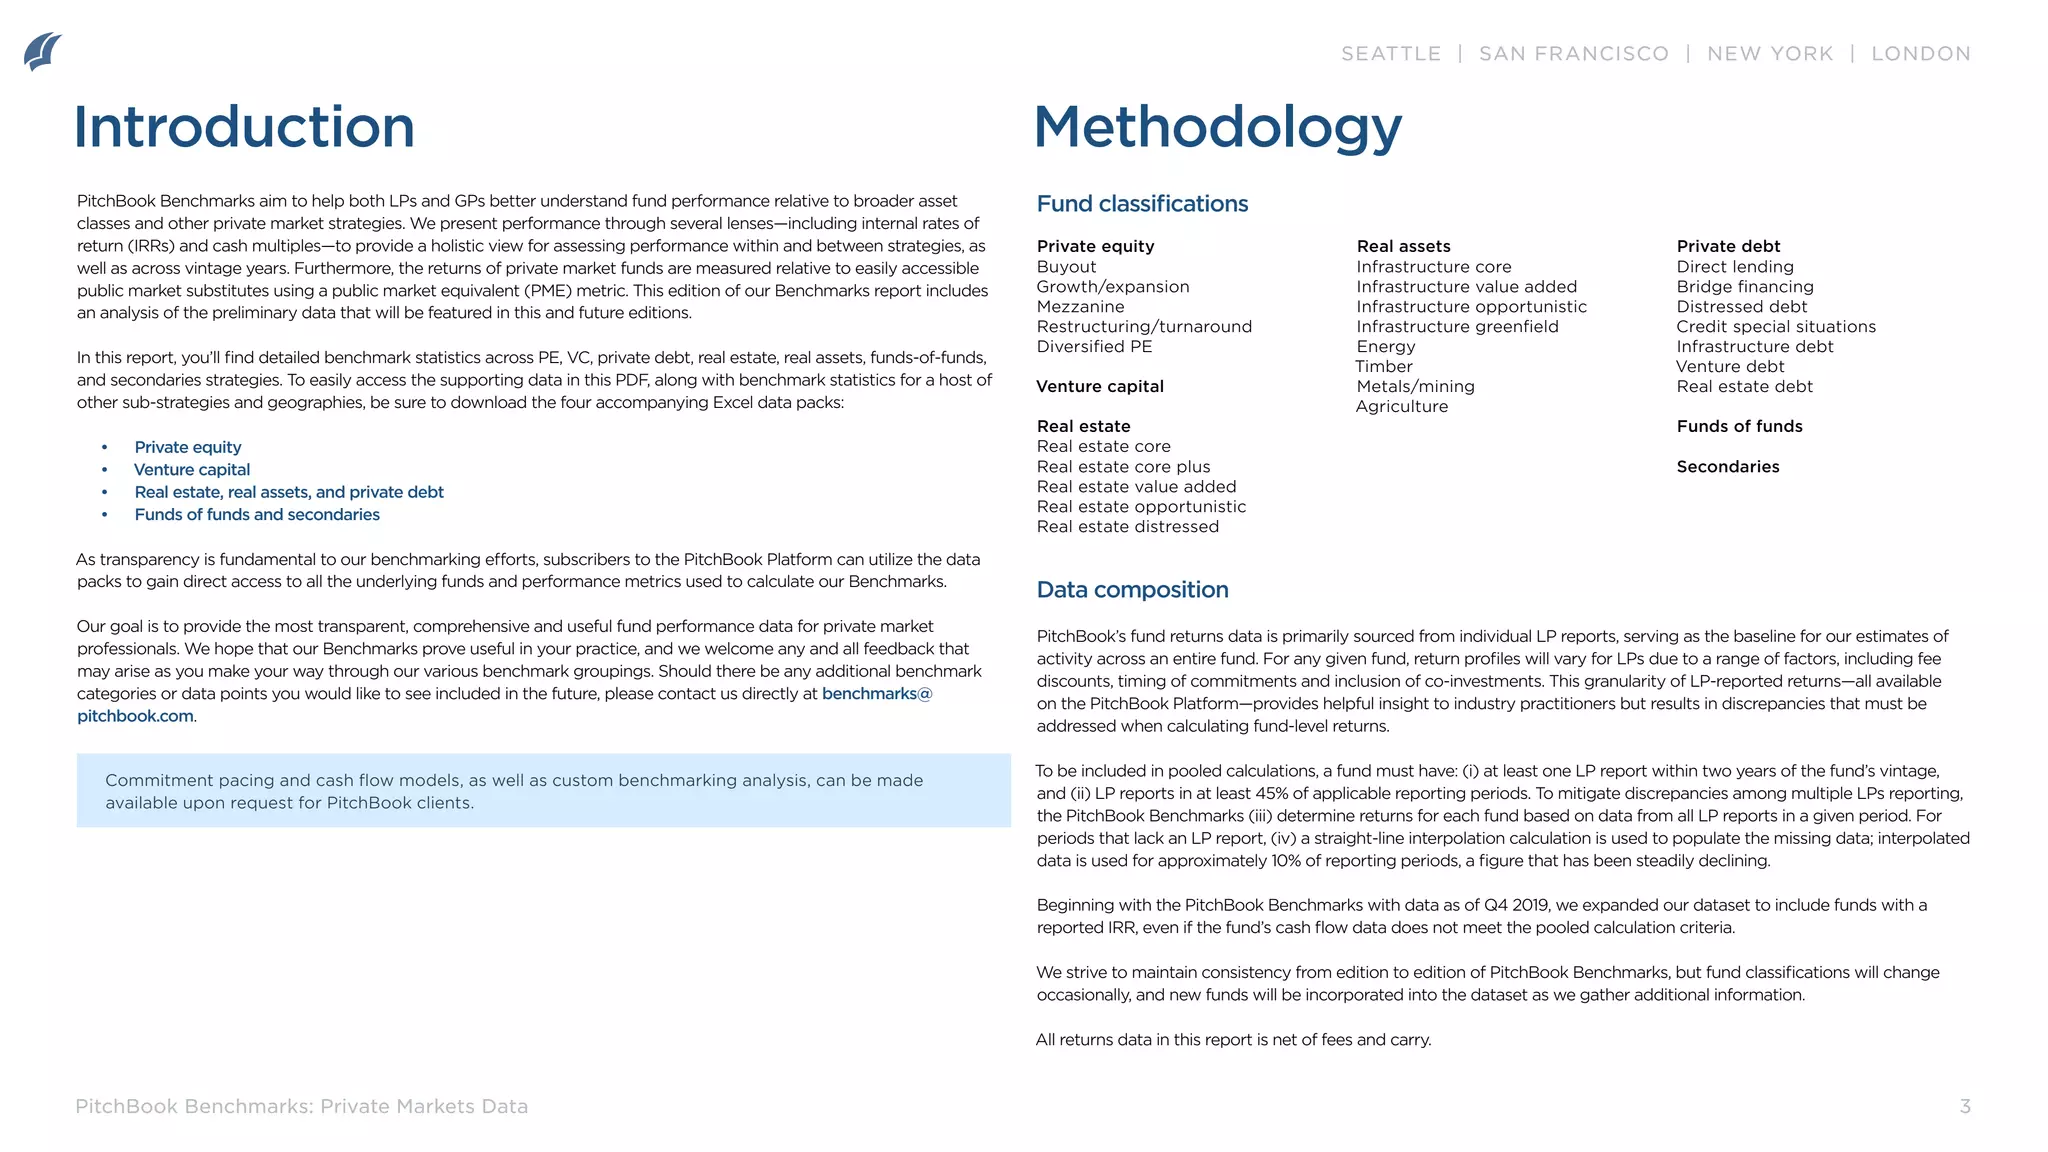
Methodology
Definitions and calculation methodologies
Fund count: Represents how many funds are included in a given sample. Note that some funds in our dataset have a
reported IRR but lack sufficient cash flow information to be included in pooled calculations.
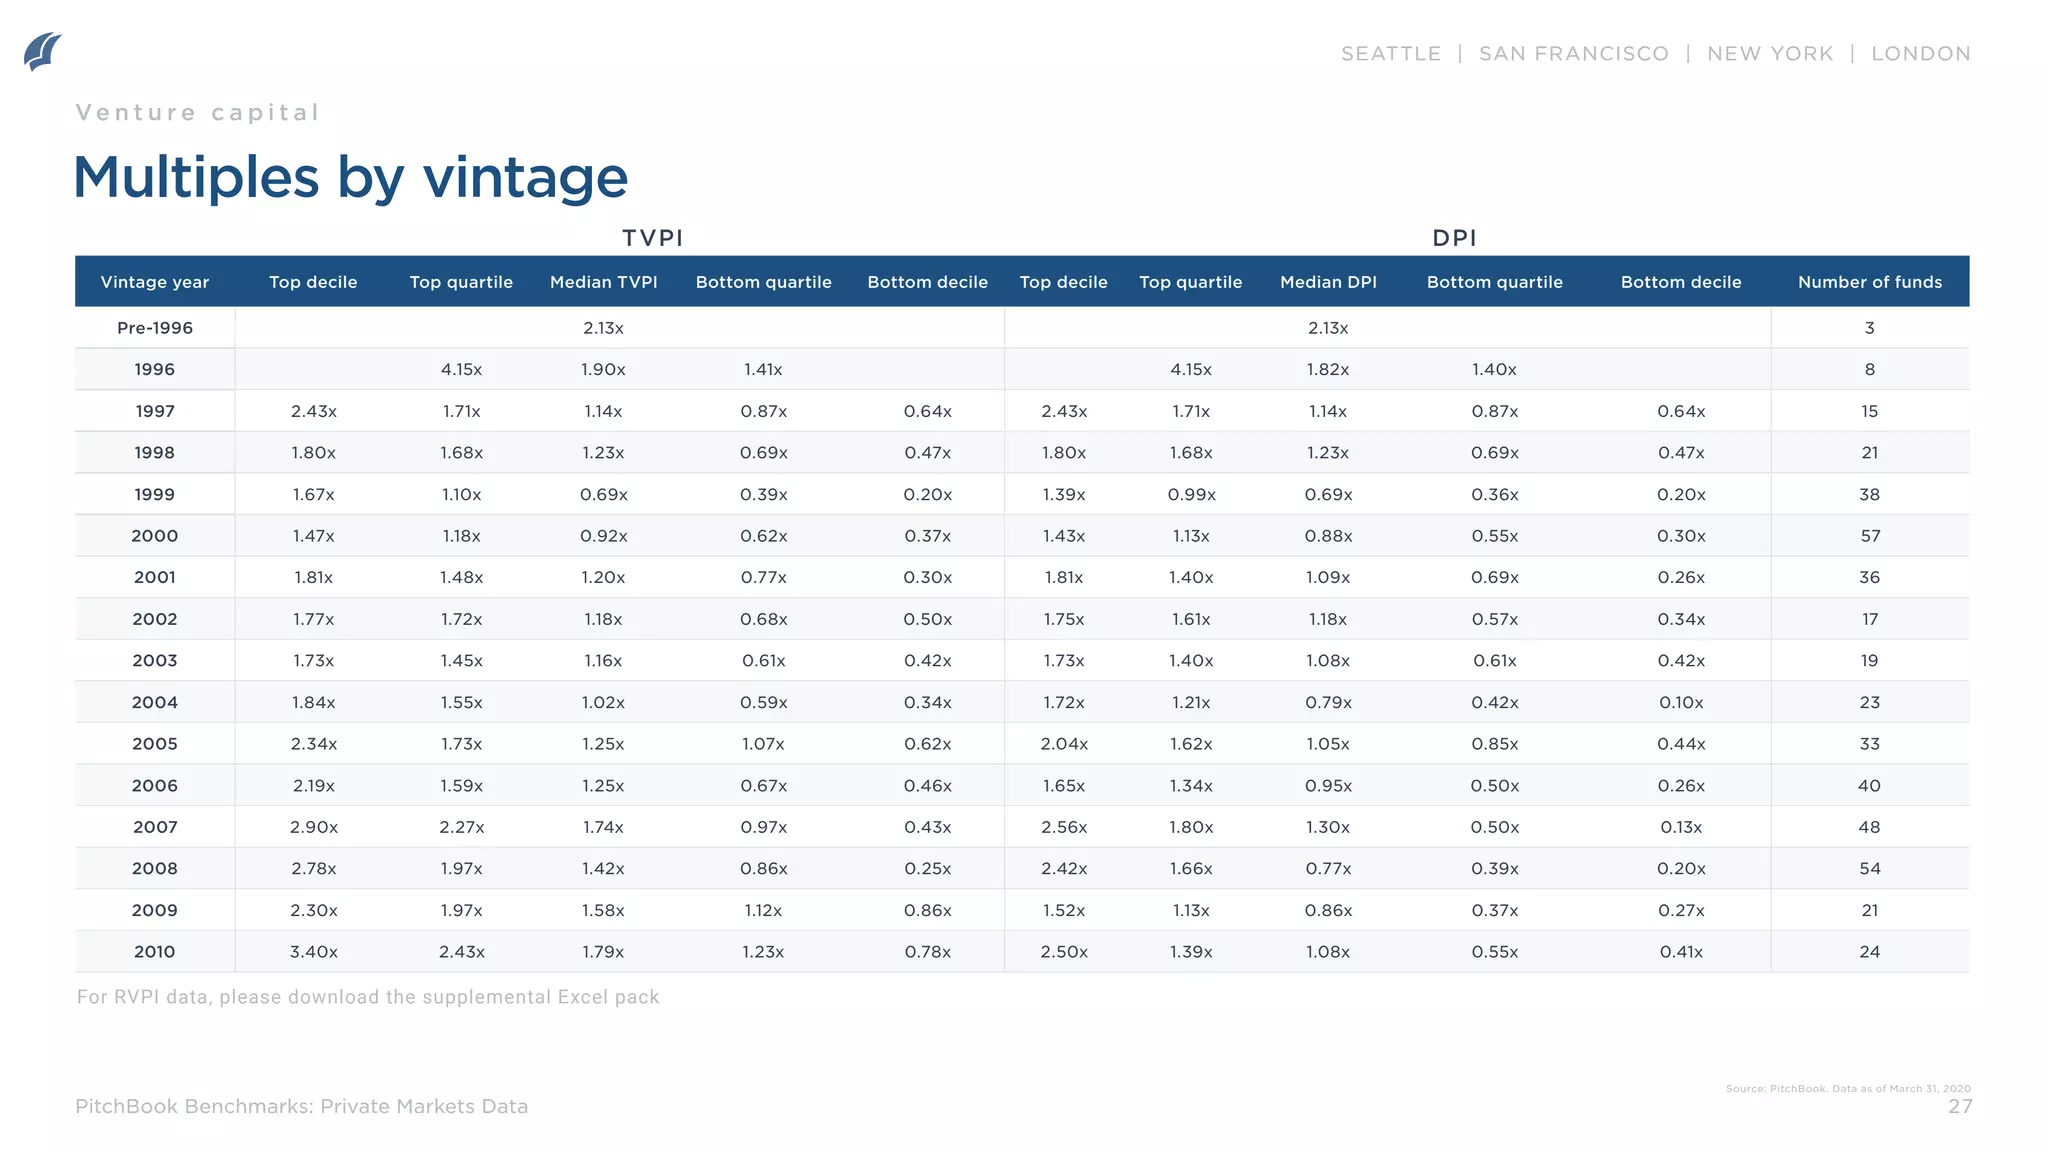
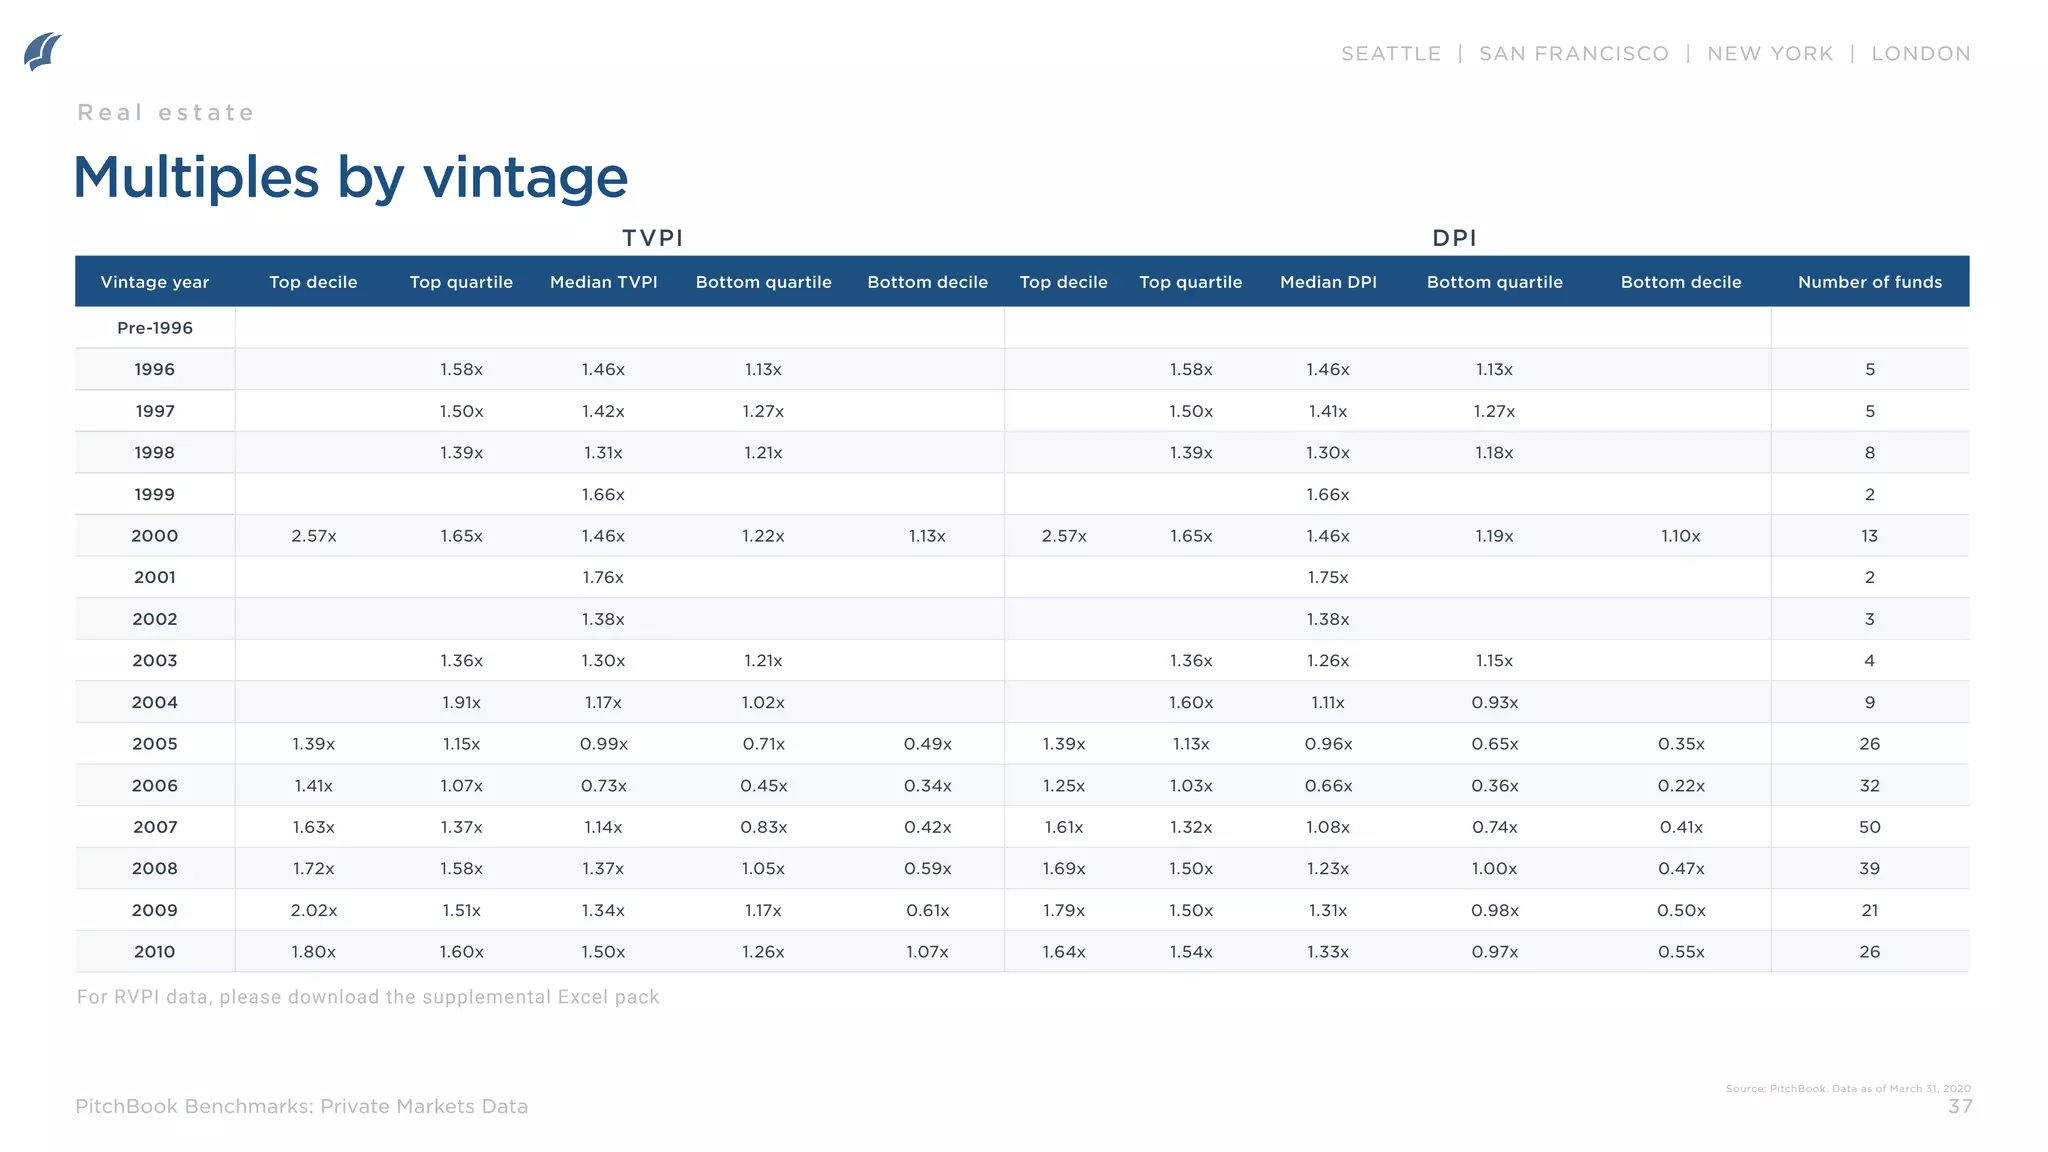
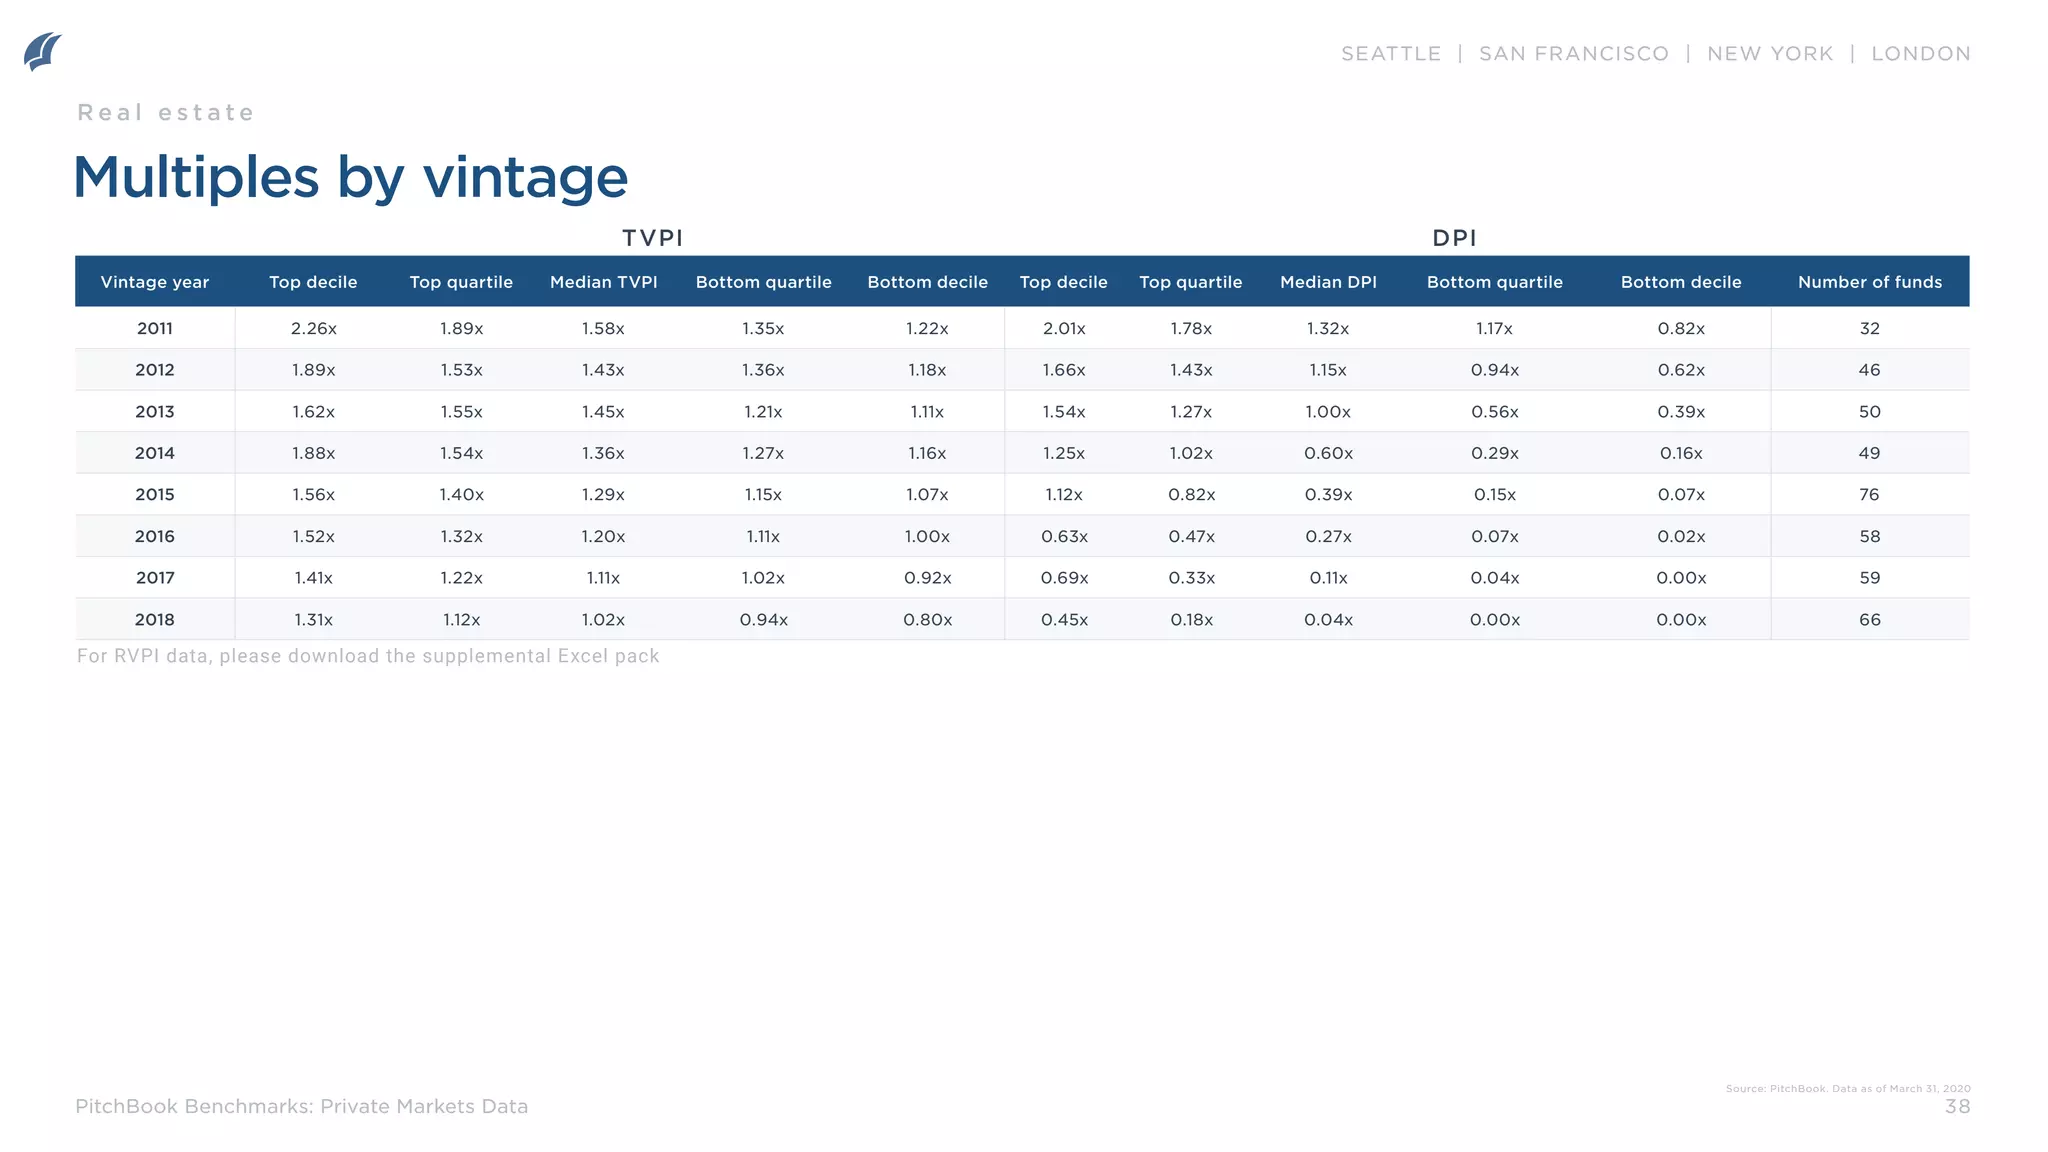
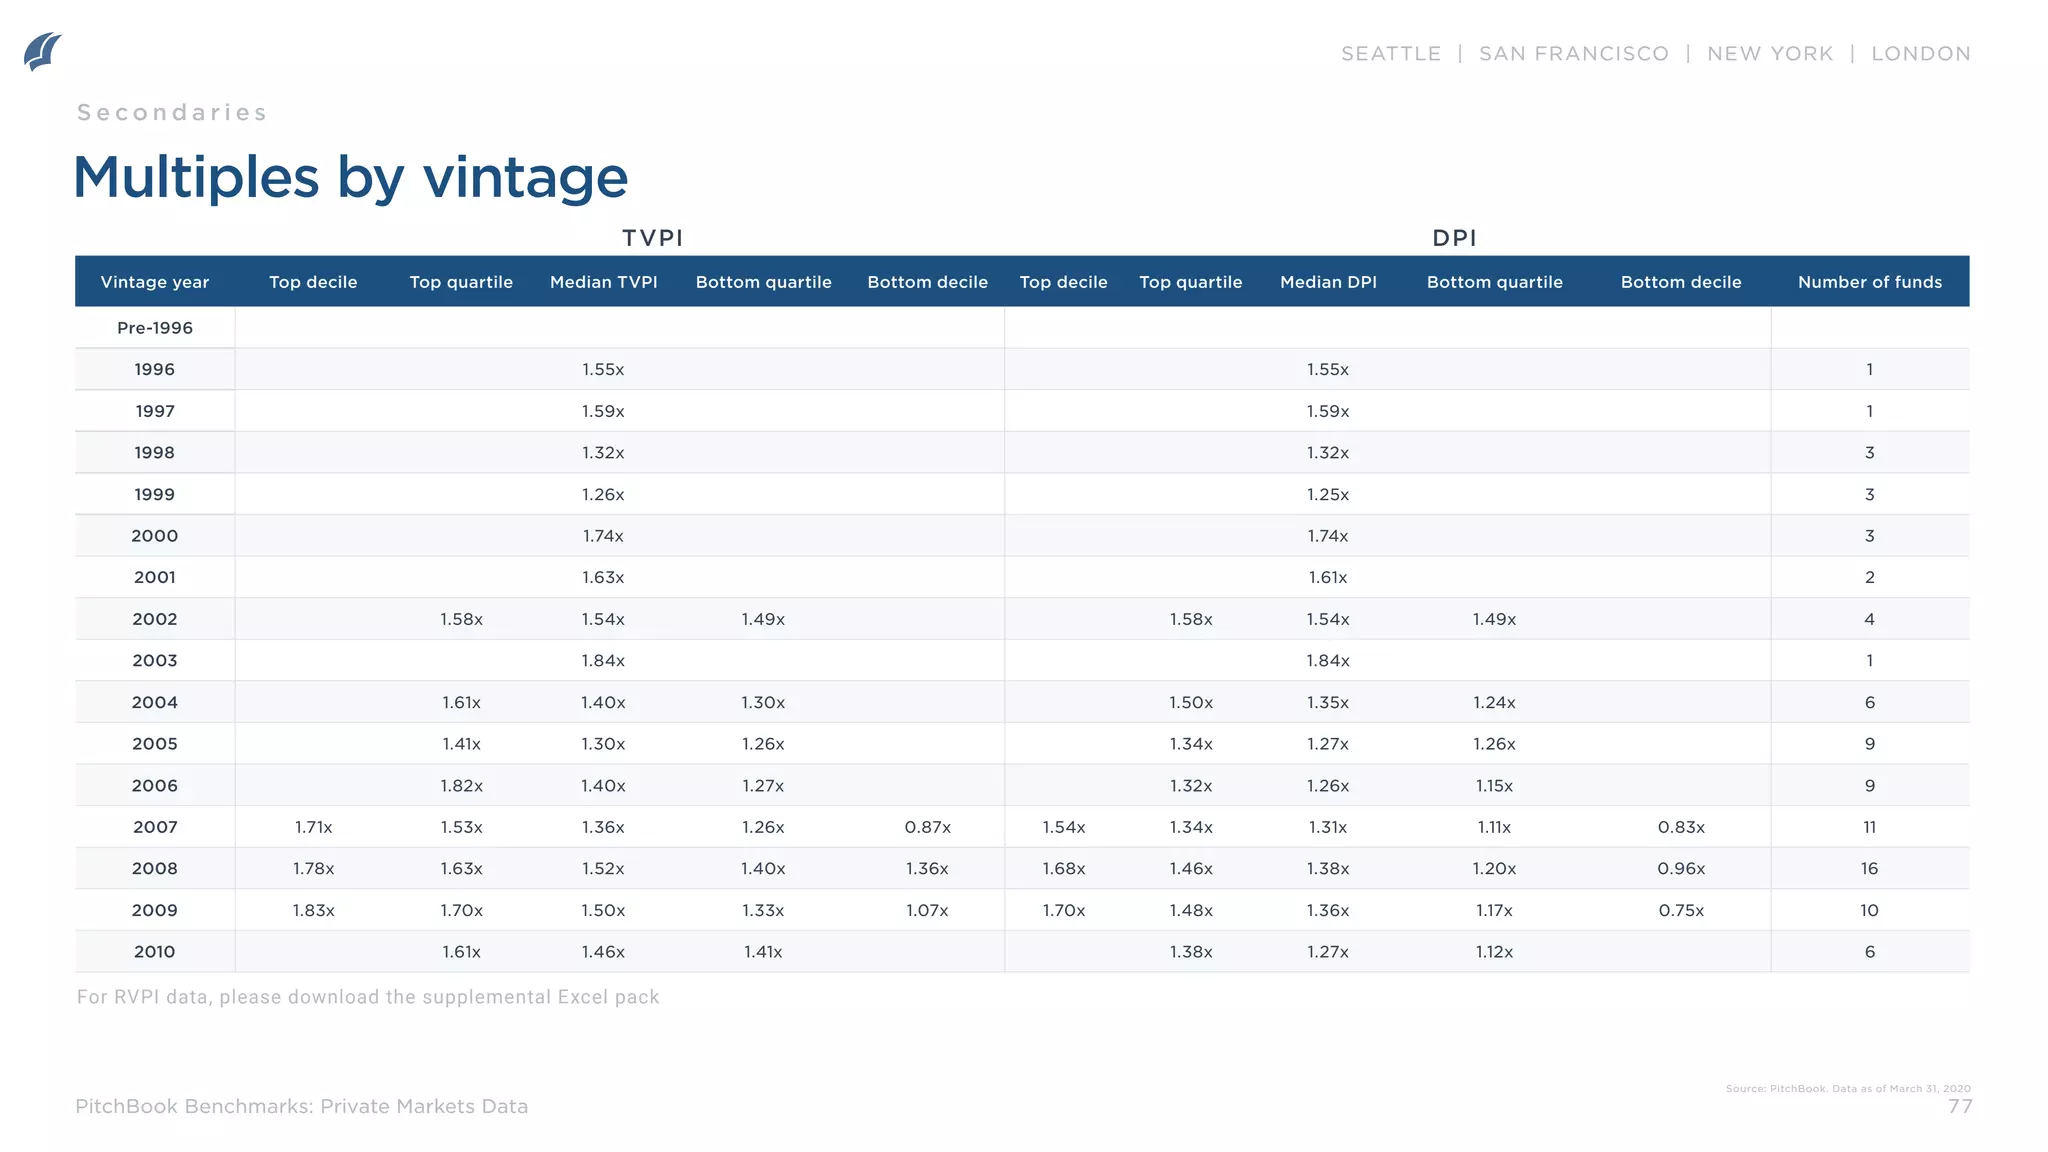
Median calculations: Shows the middle data point for a sample group.
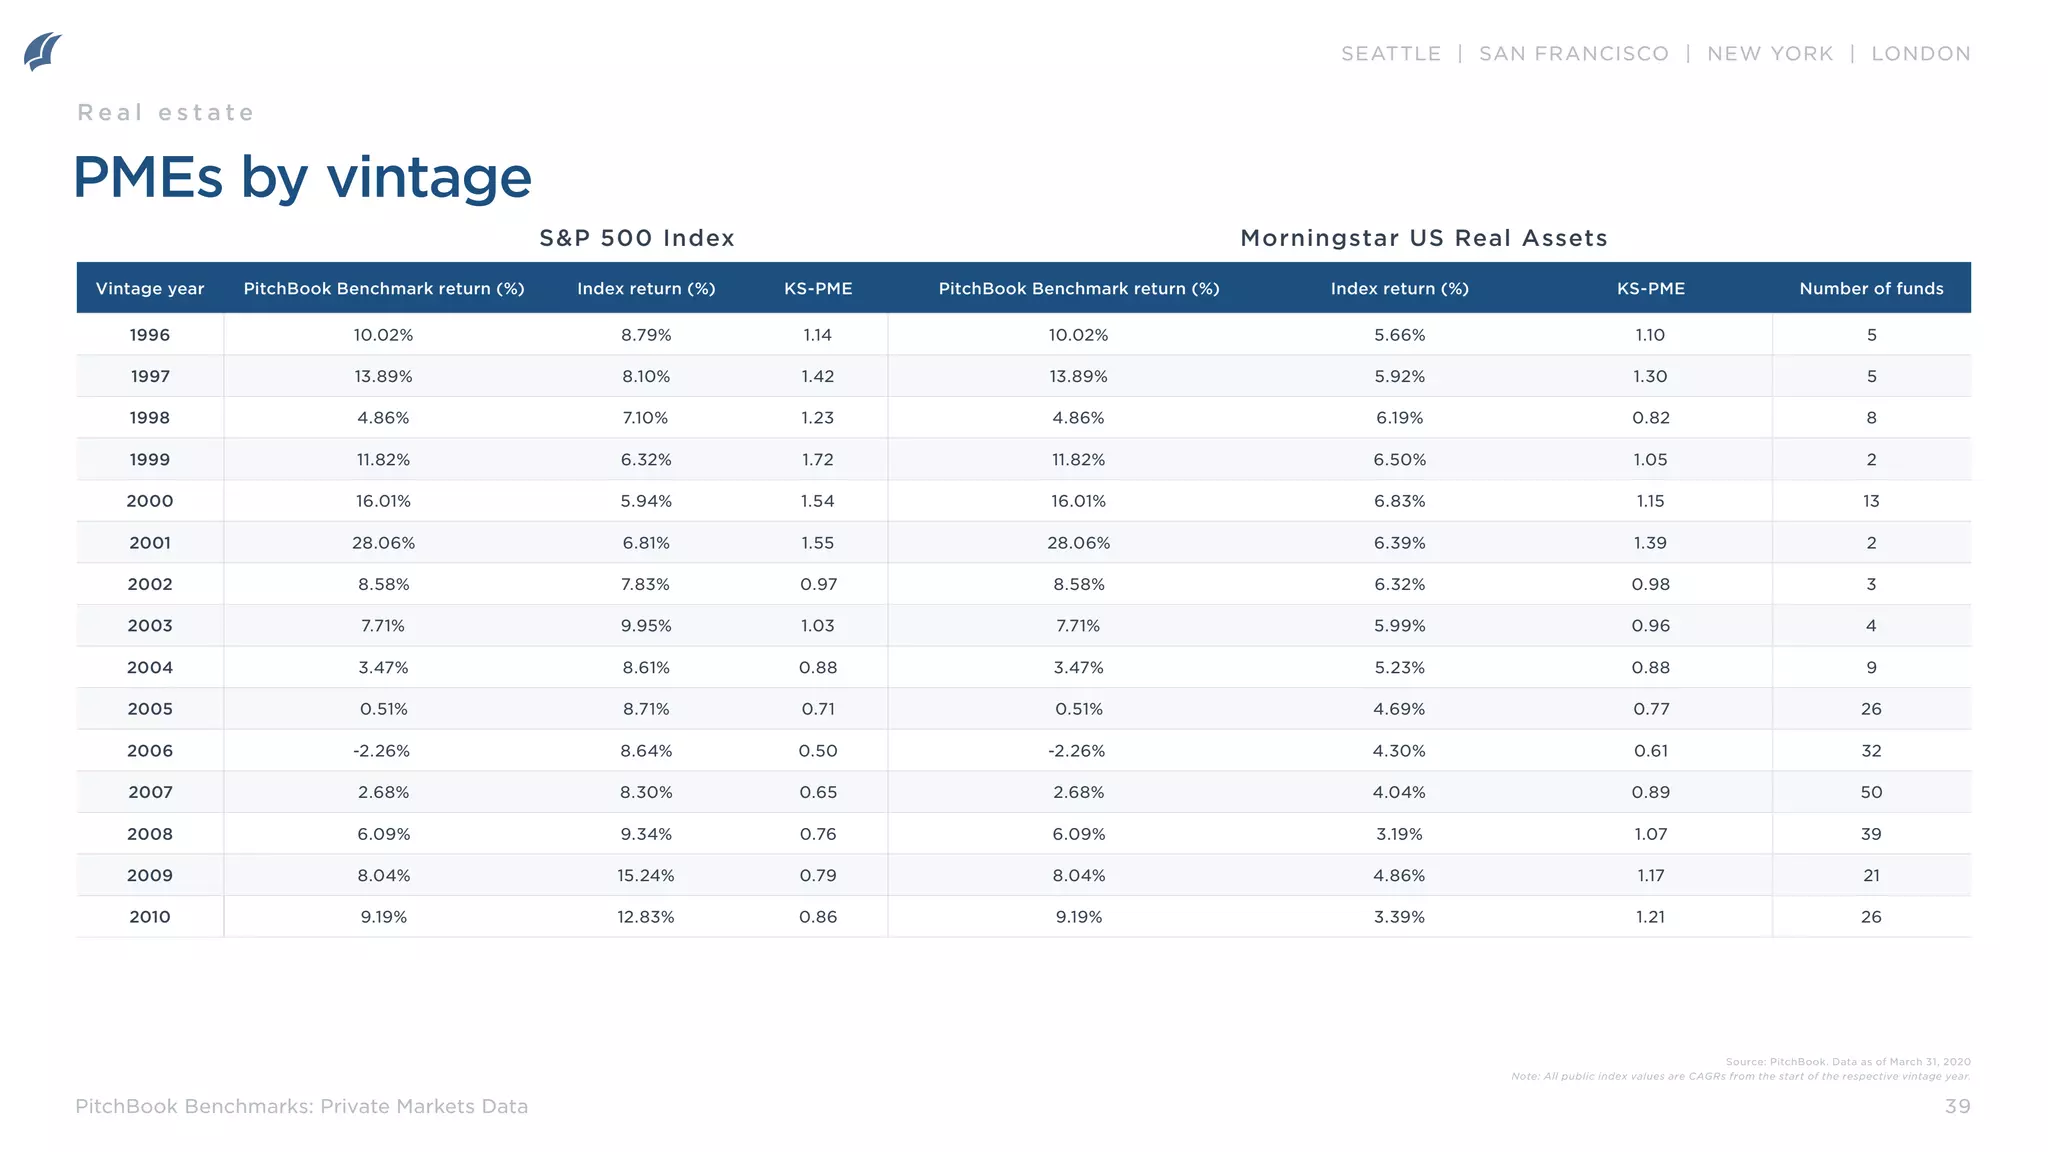
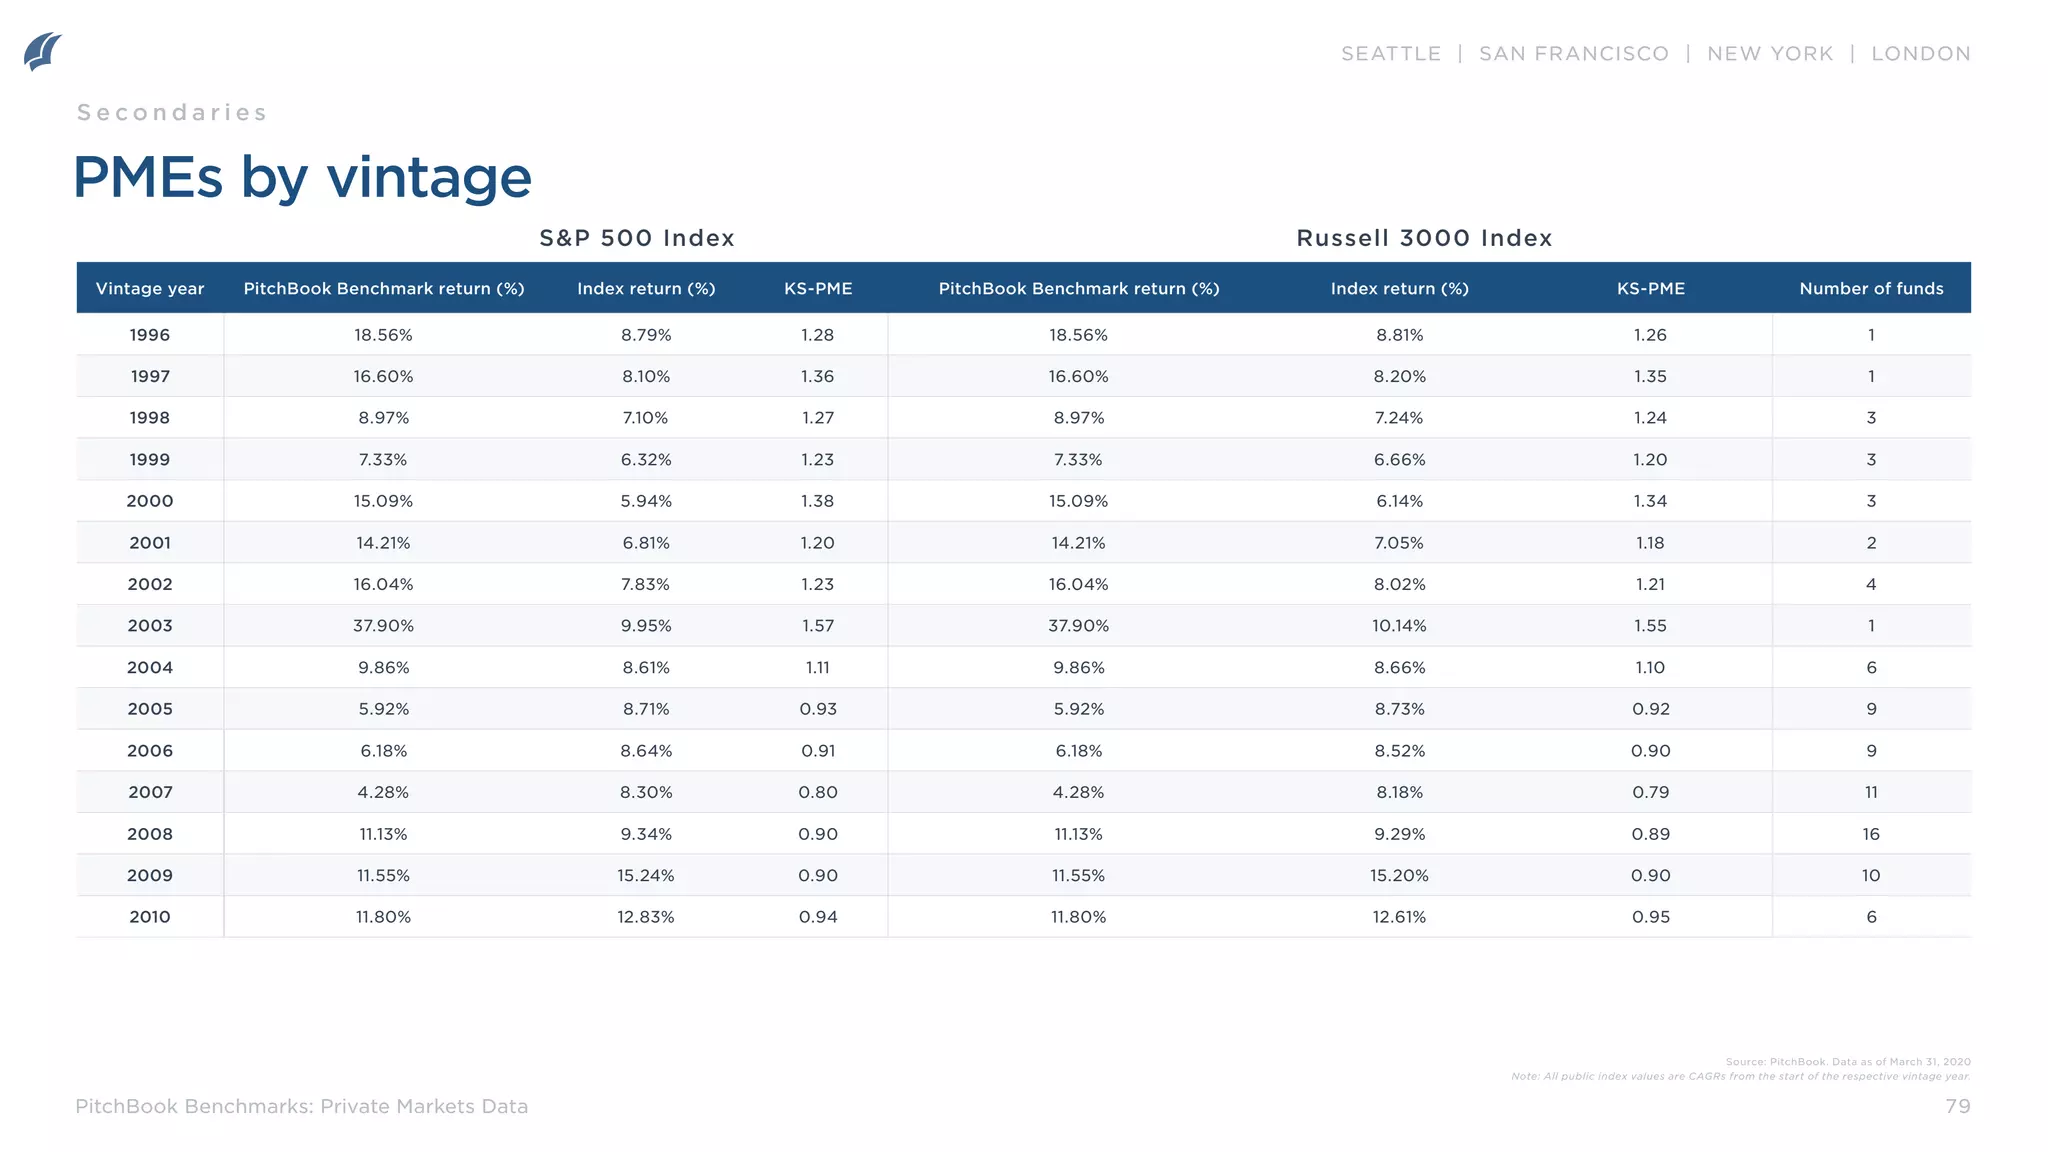
Public market index returns: Instances where the return of a public market index is cited, we have calculated the
annualized return for the given period. All public indices are total return and denominated in US dollars.
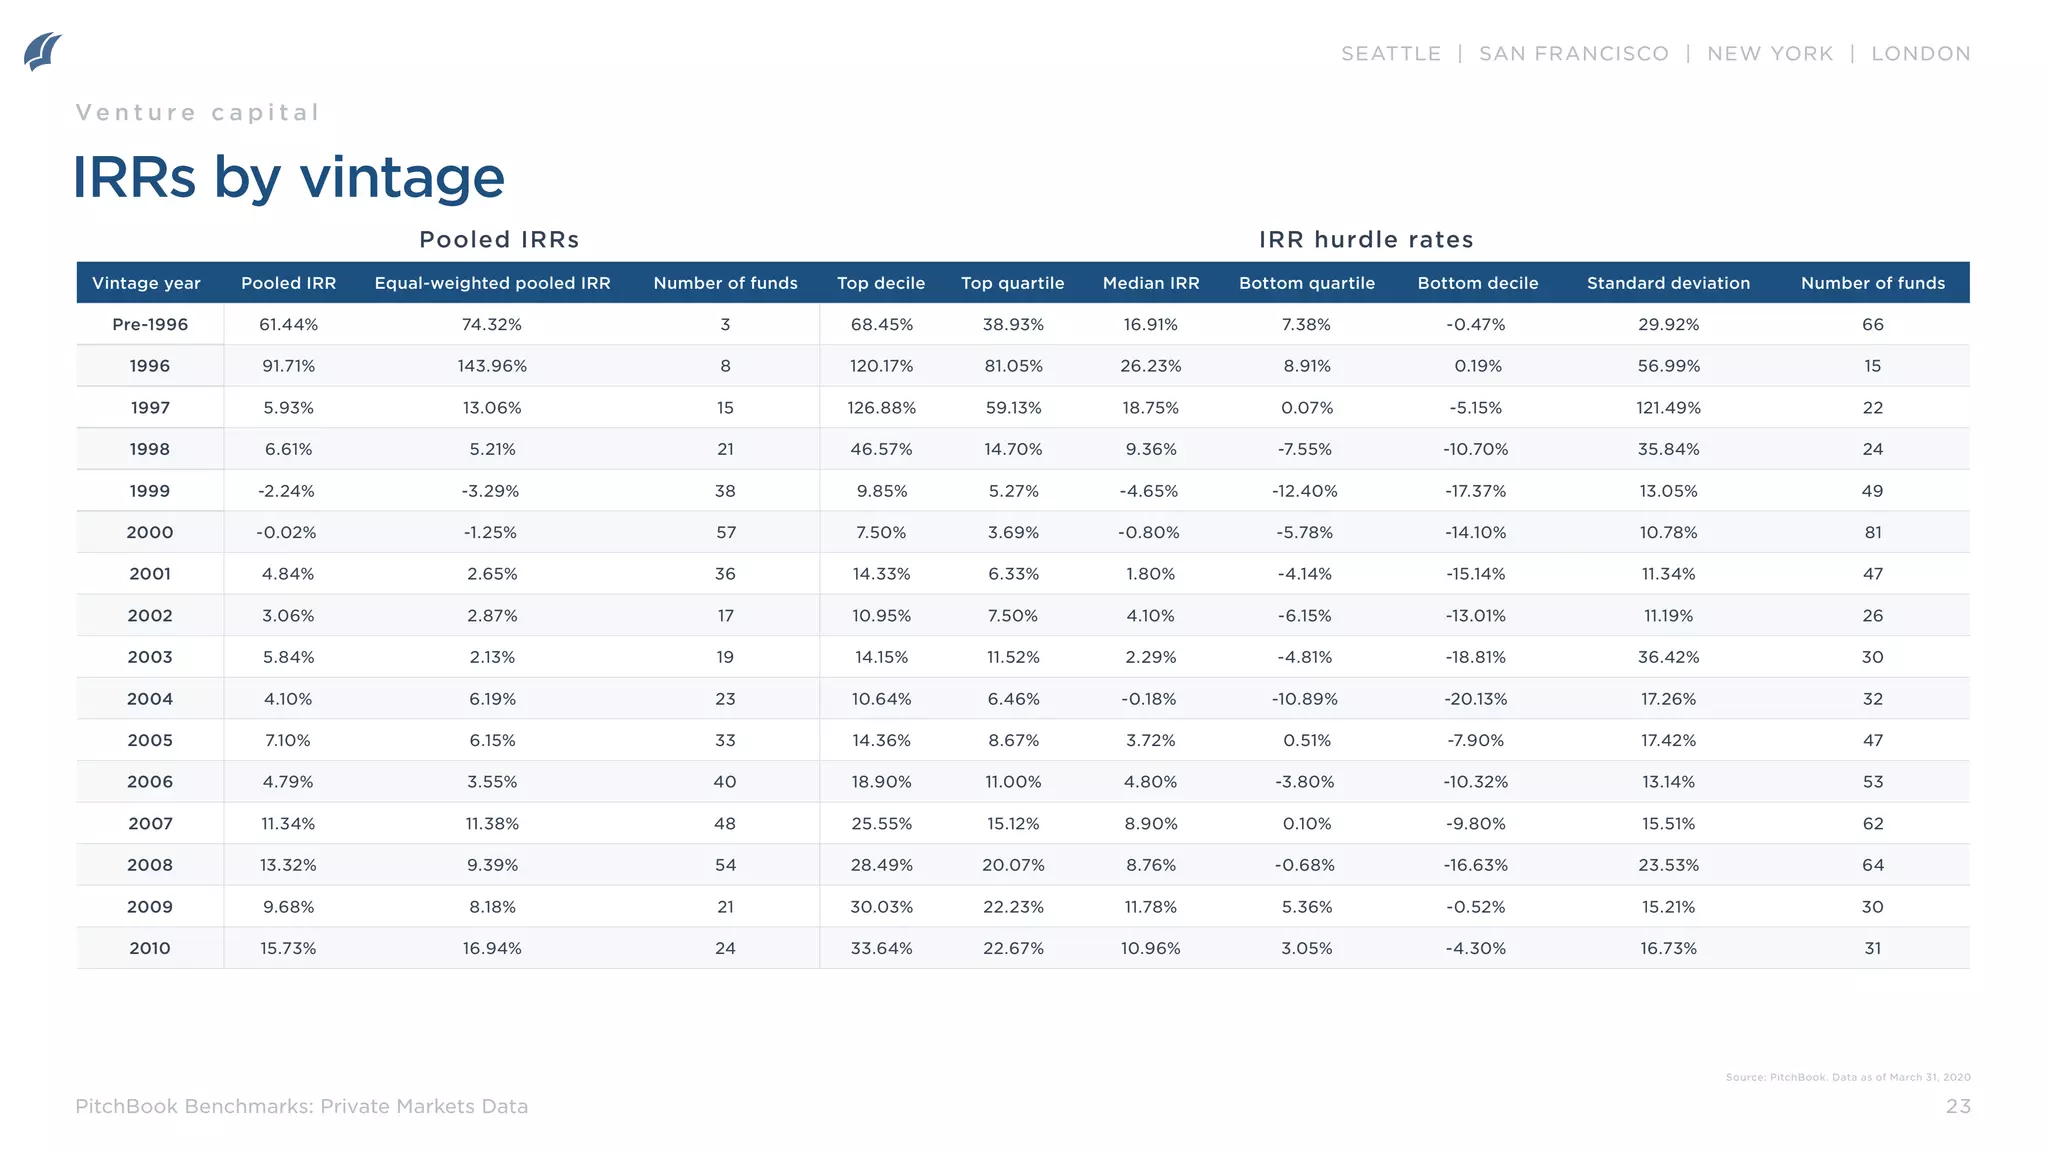
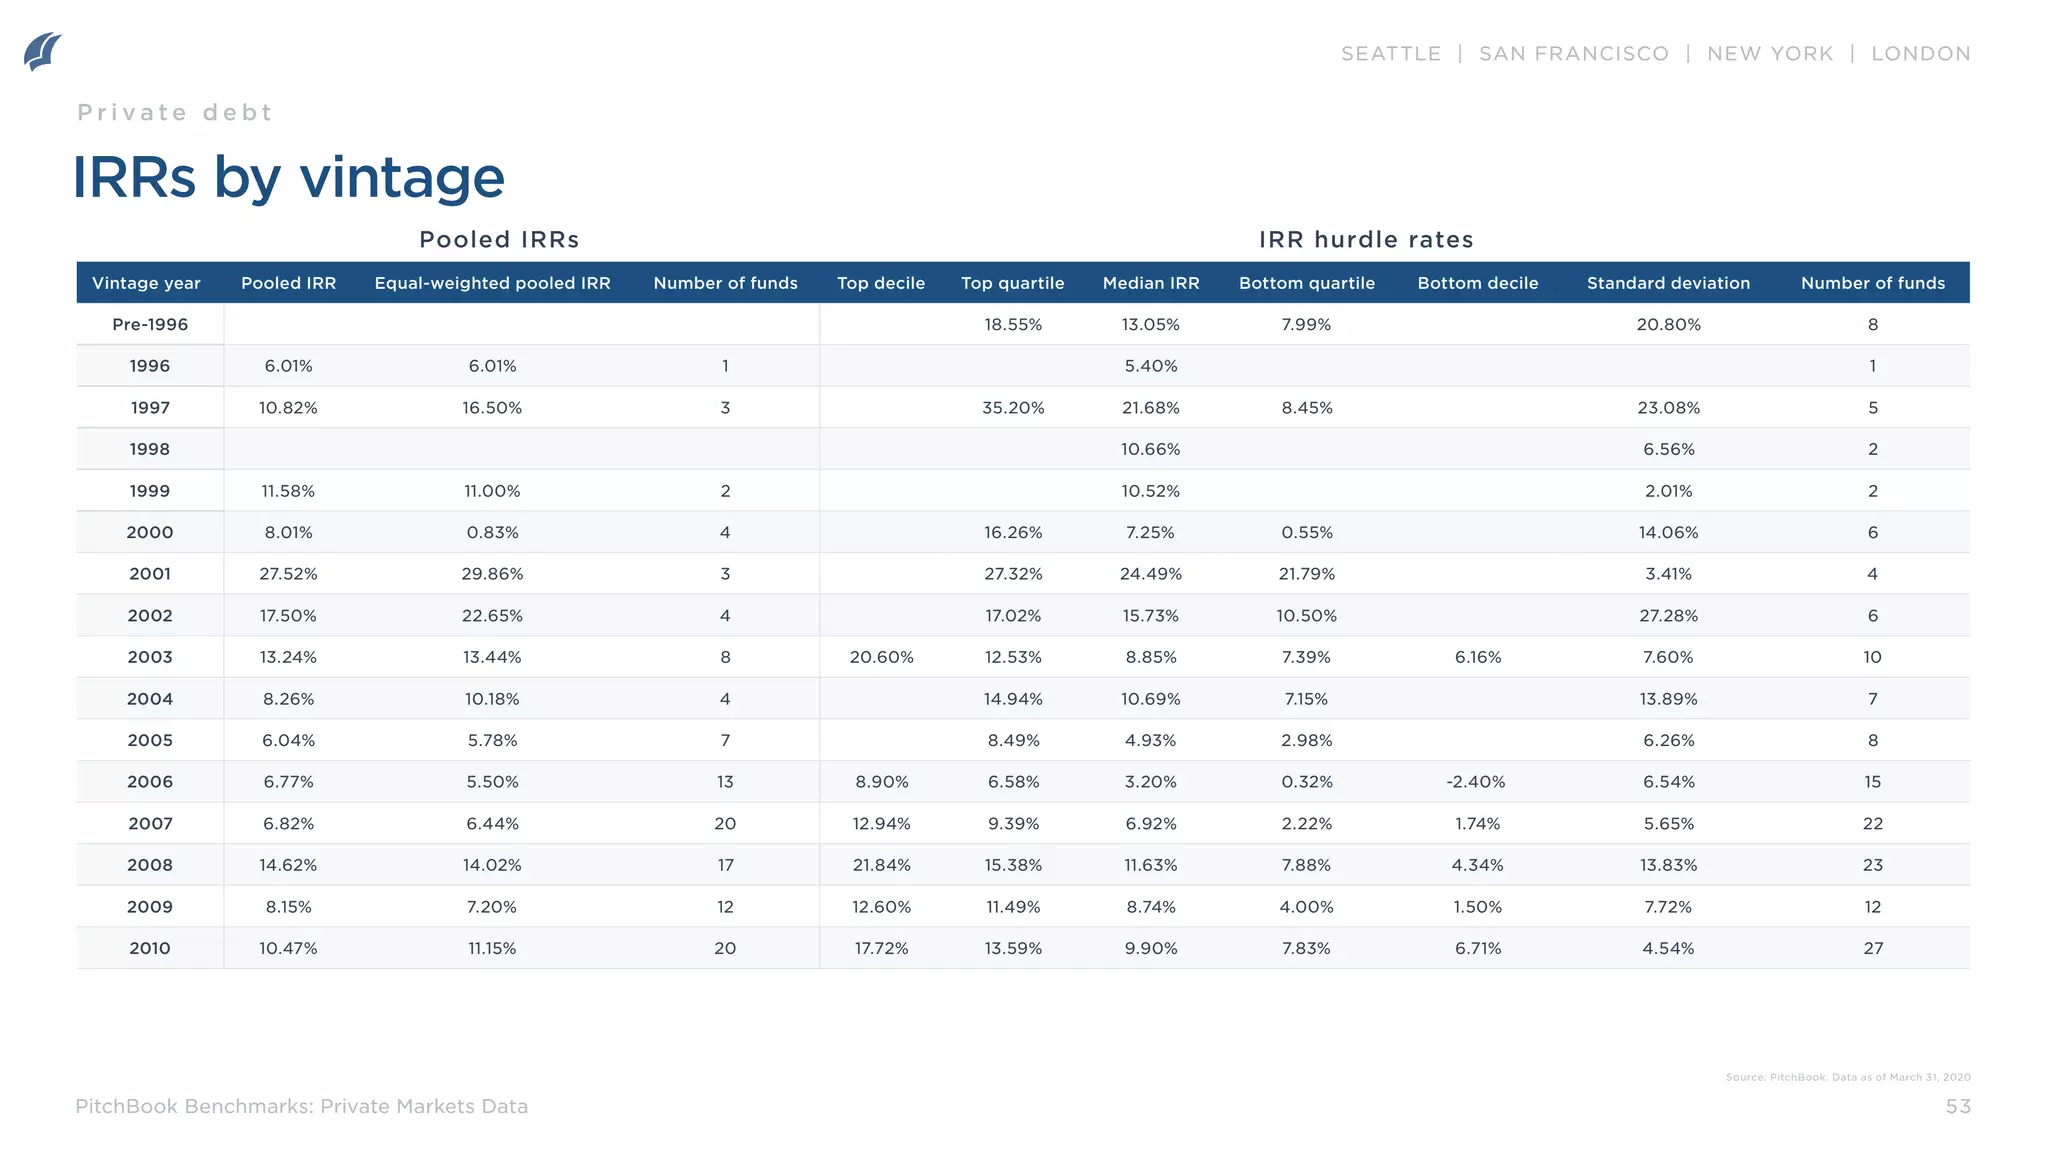
Standard deviation: Calculates the dispersion of reported IRRs for a given peer group using the sample-based standard
deviation methodology.
Vintage year: The vintage year is based on the year that a fund makes its first capital call. If the year of the initial call
is unknown, the year of the final close is used as the vintage year. However, if a firm publicly declares via press release
or a notice on their website a fund to be of a particular vintage different than either of the first conditions, the firm’s
classification takes precedence.
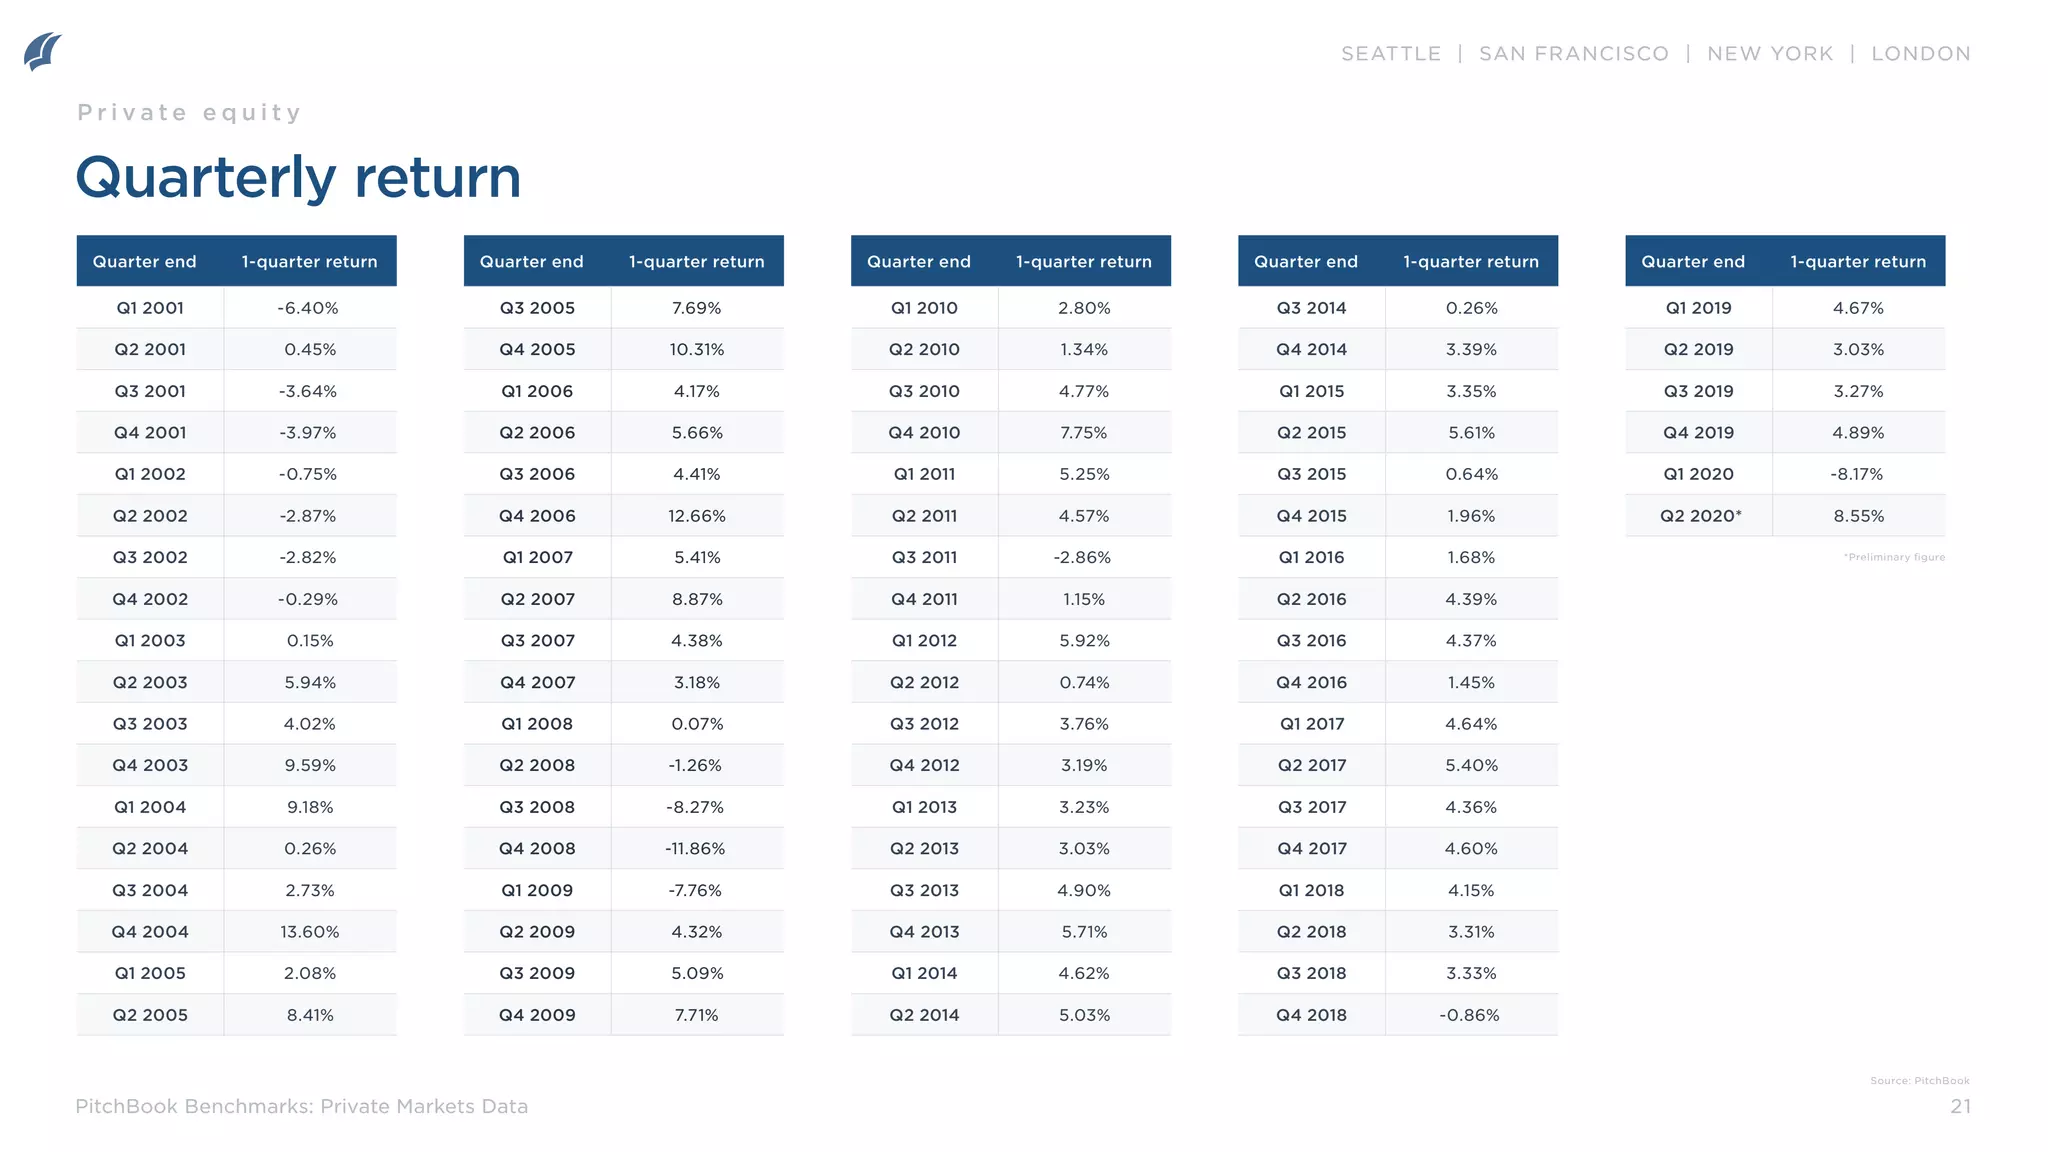
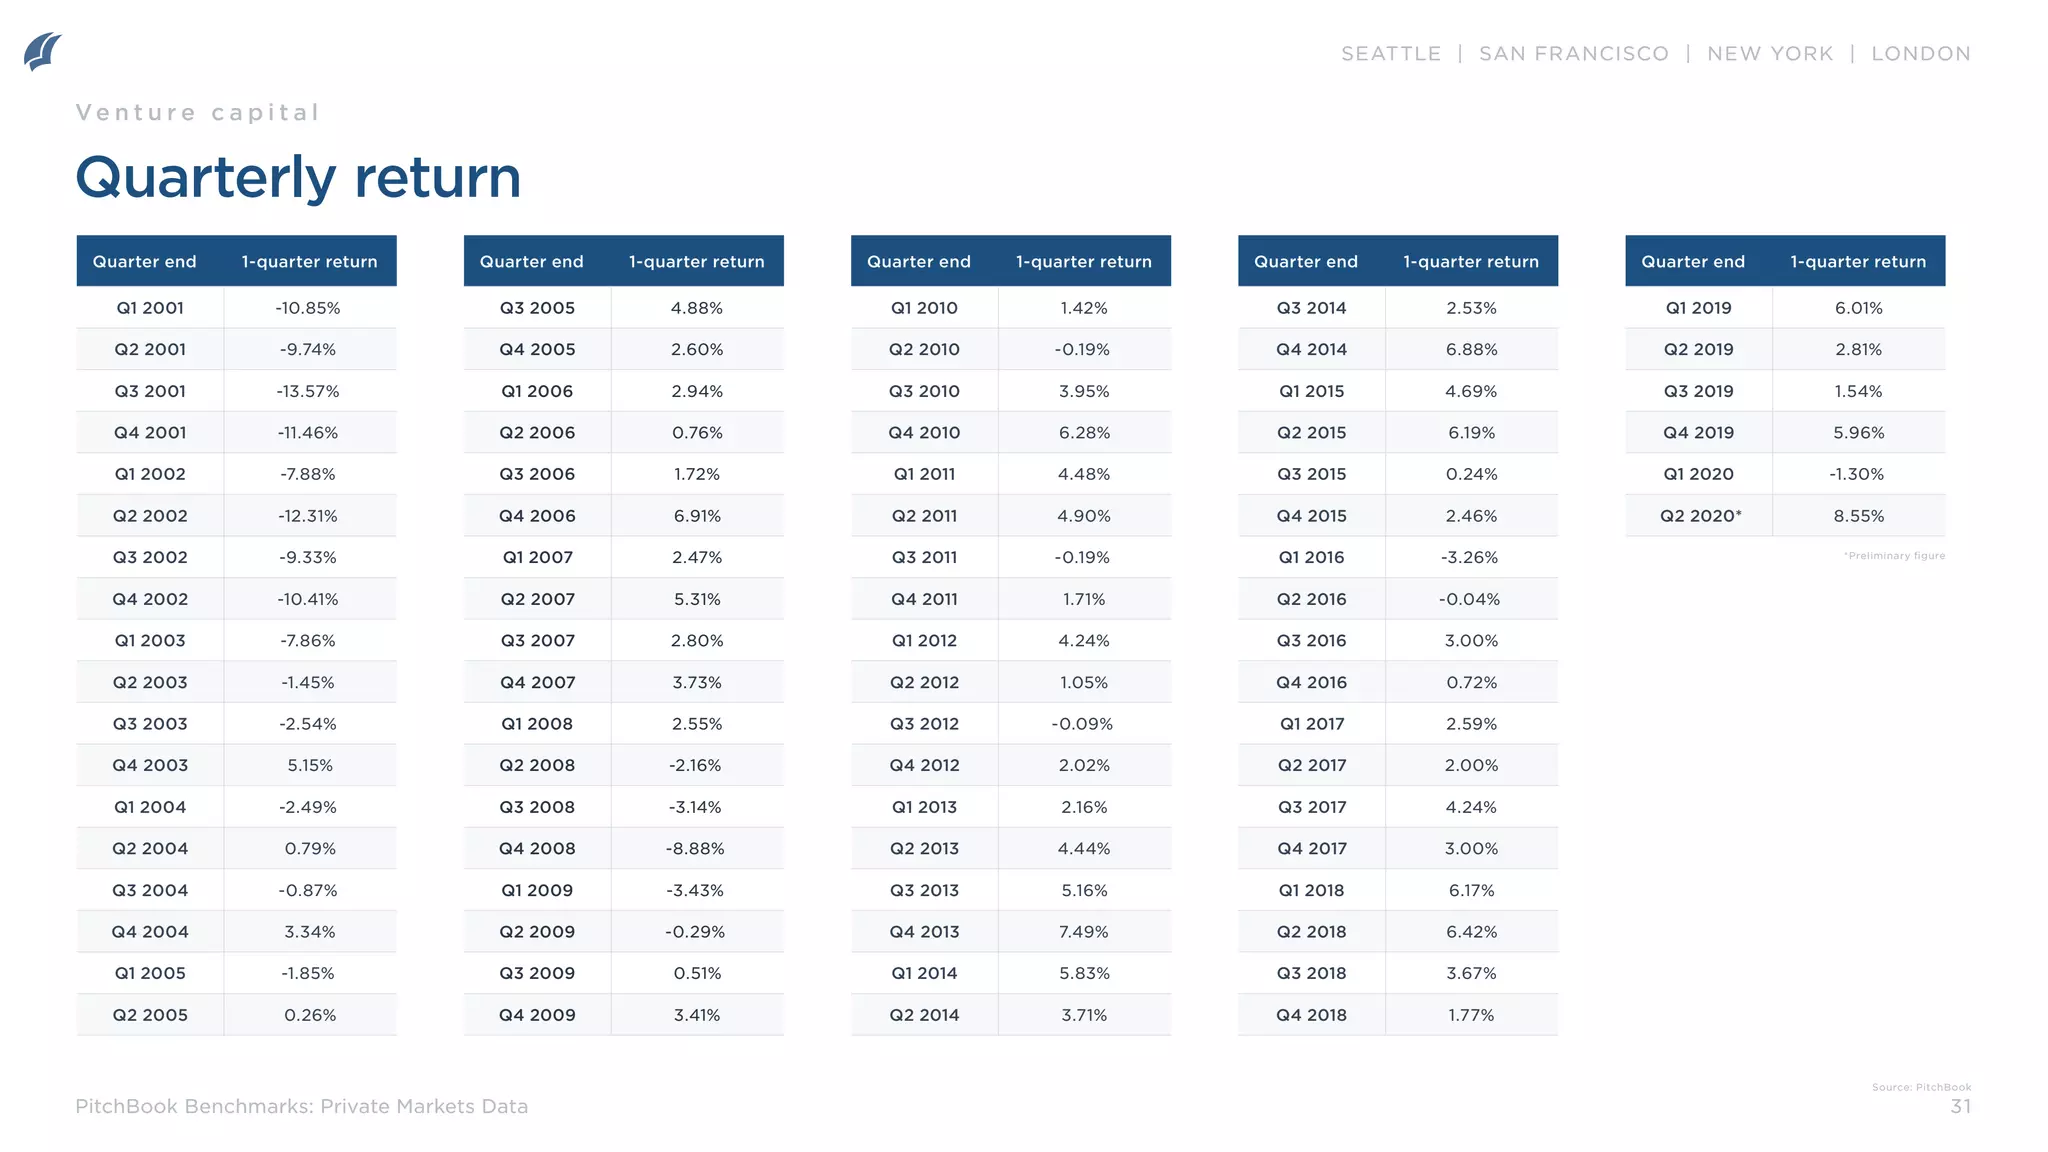
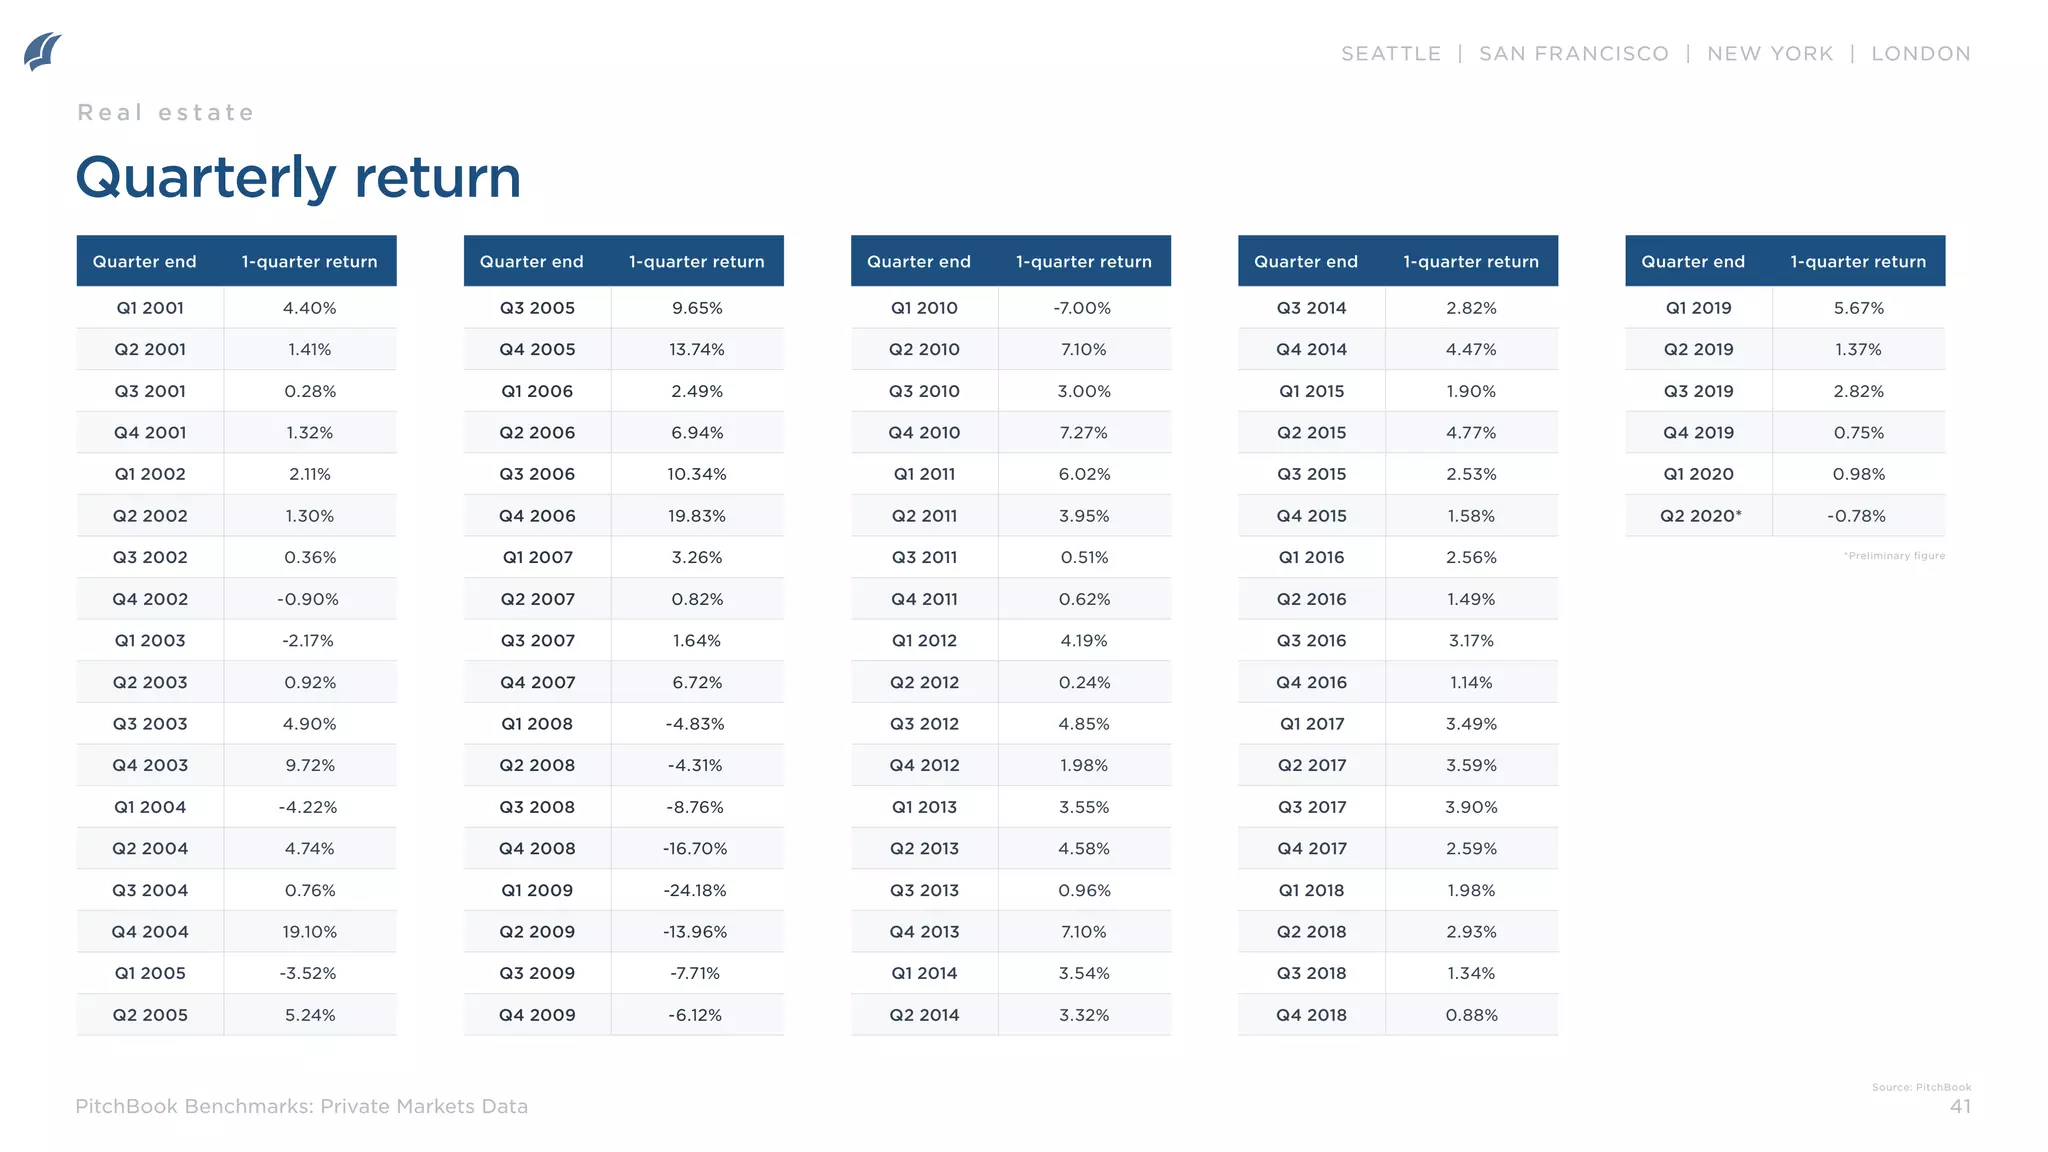
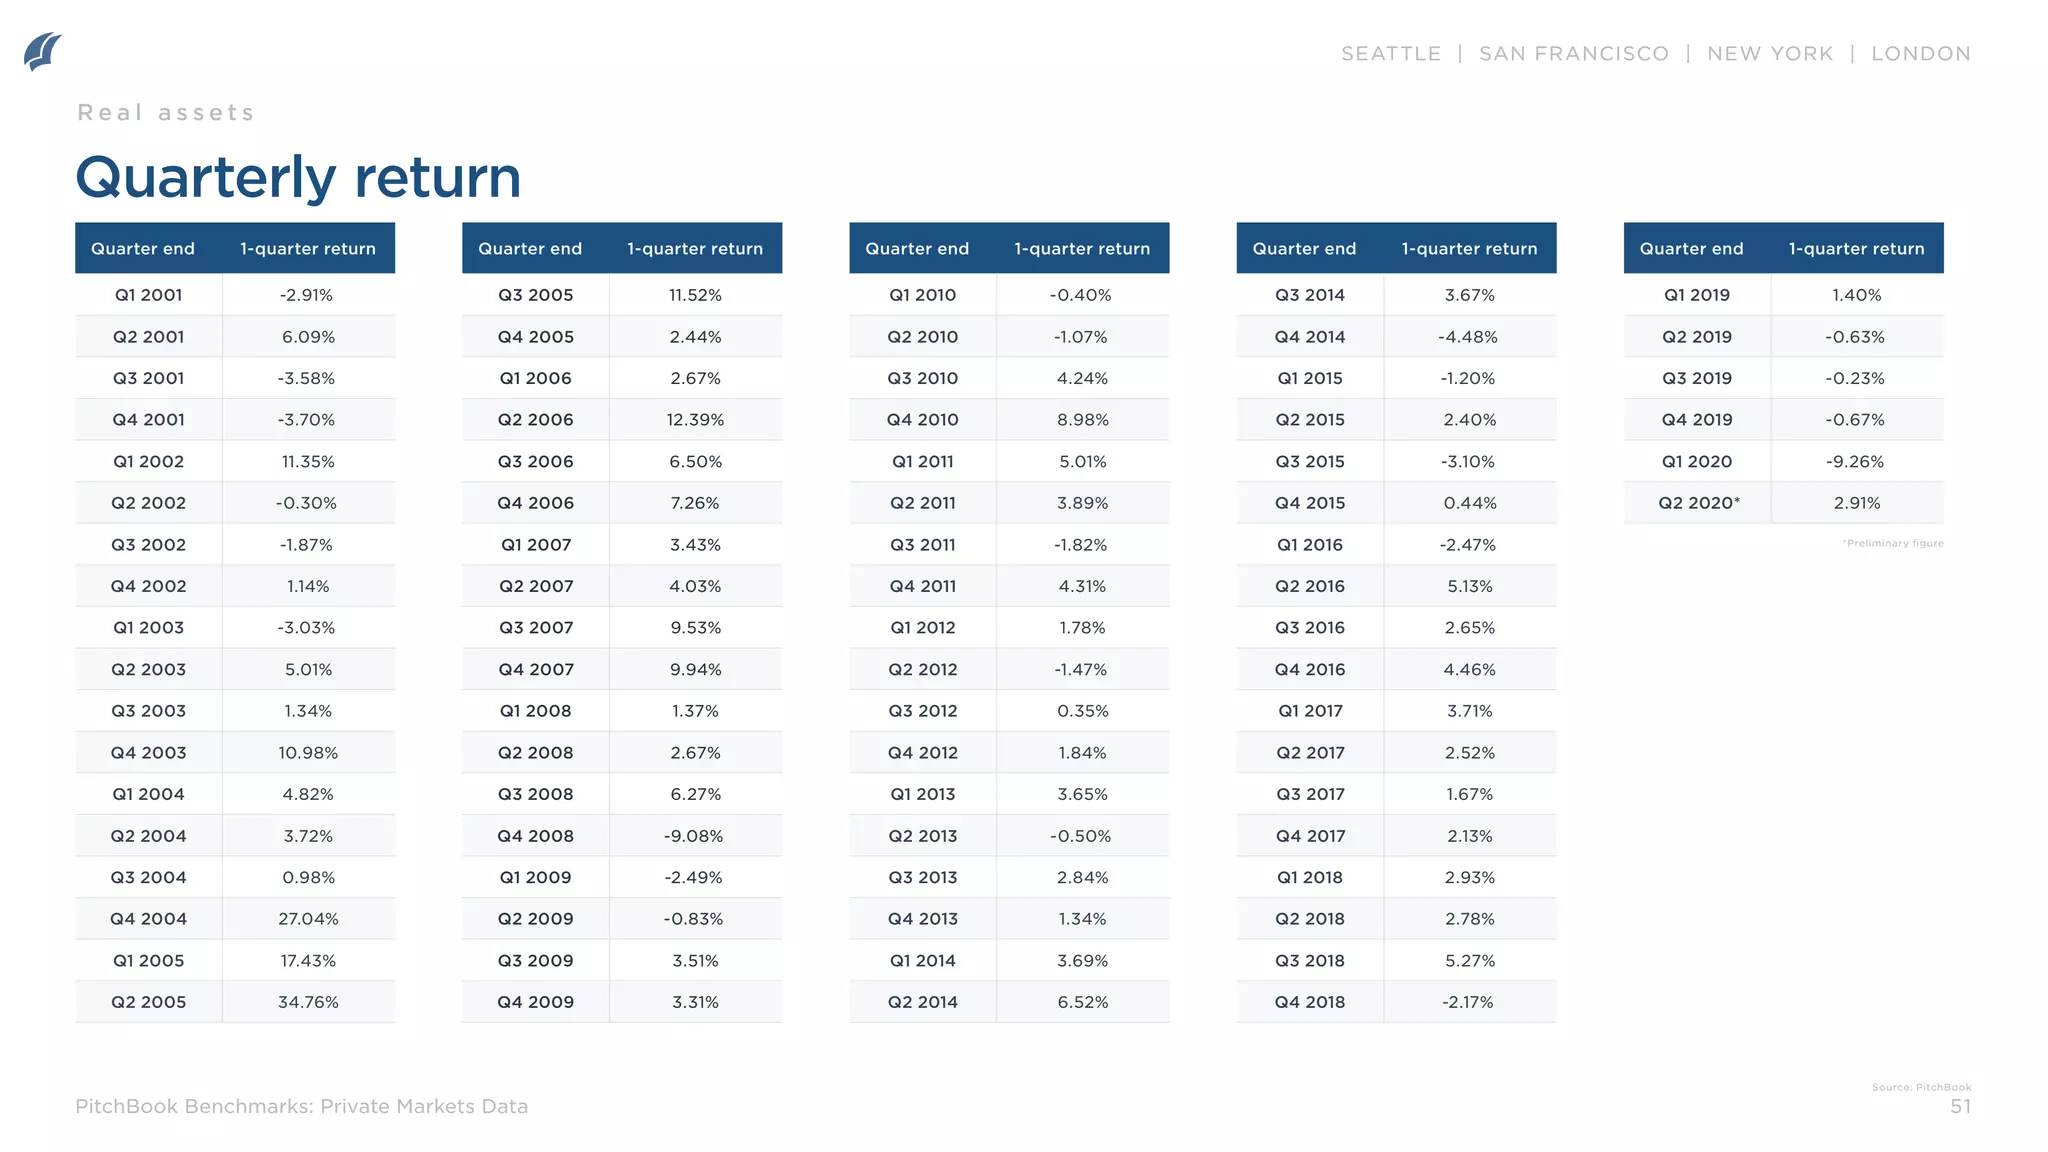
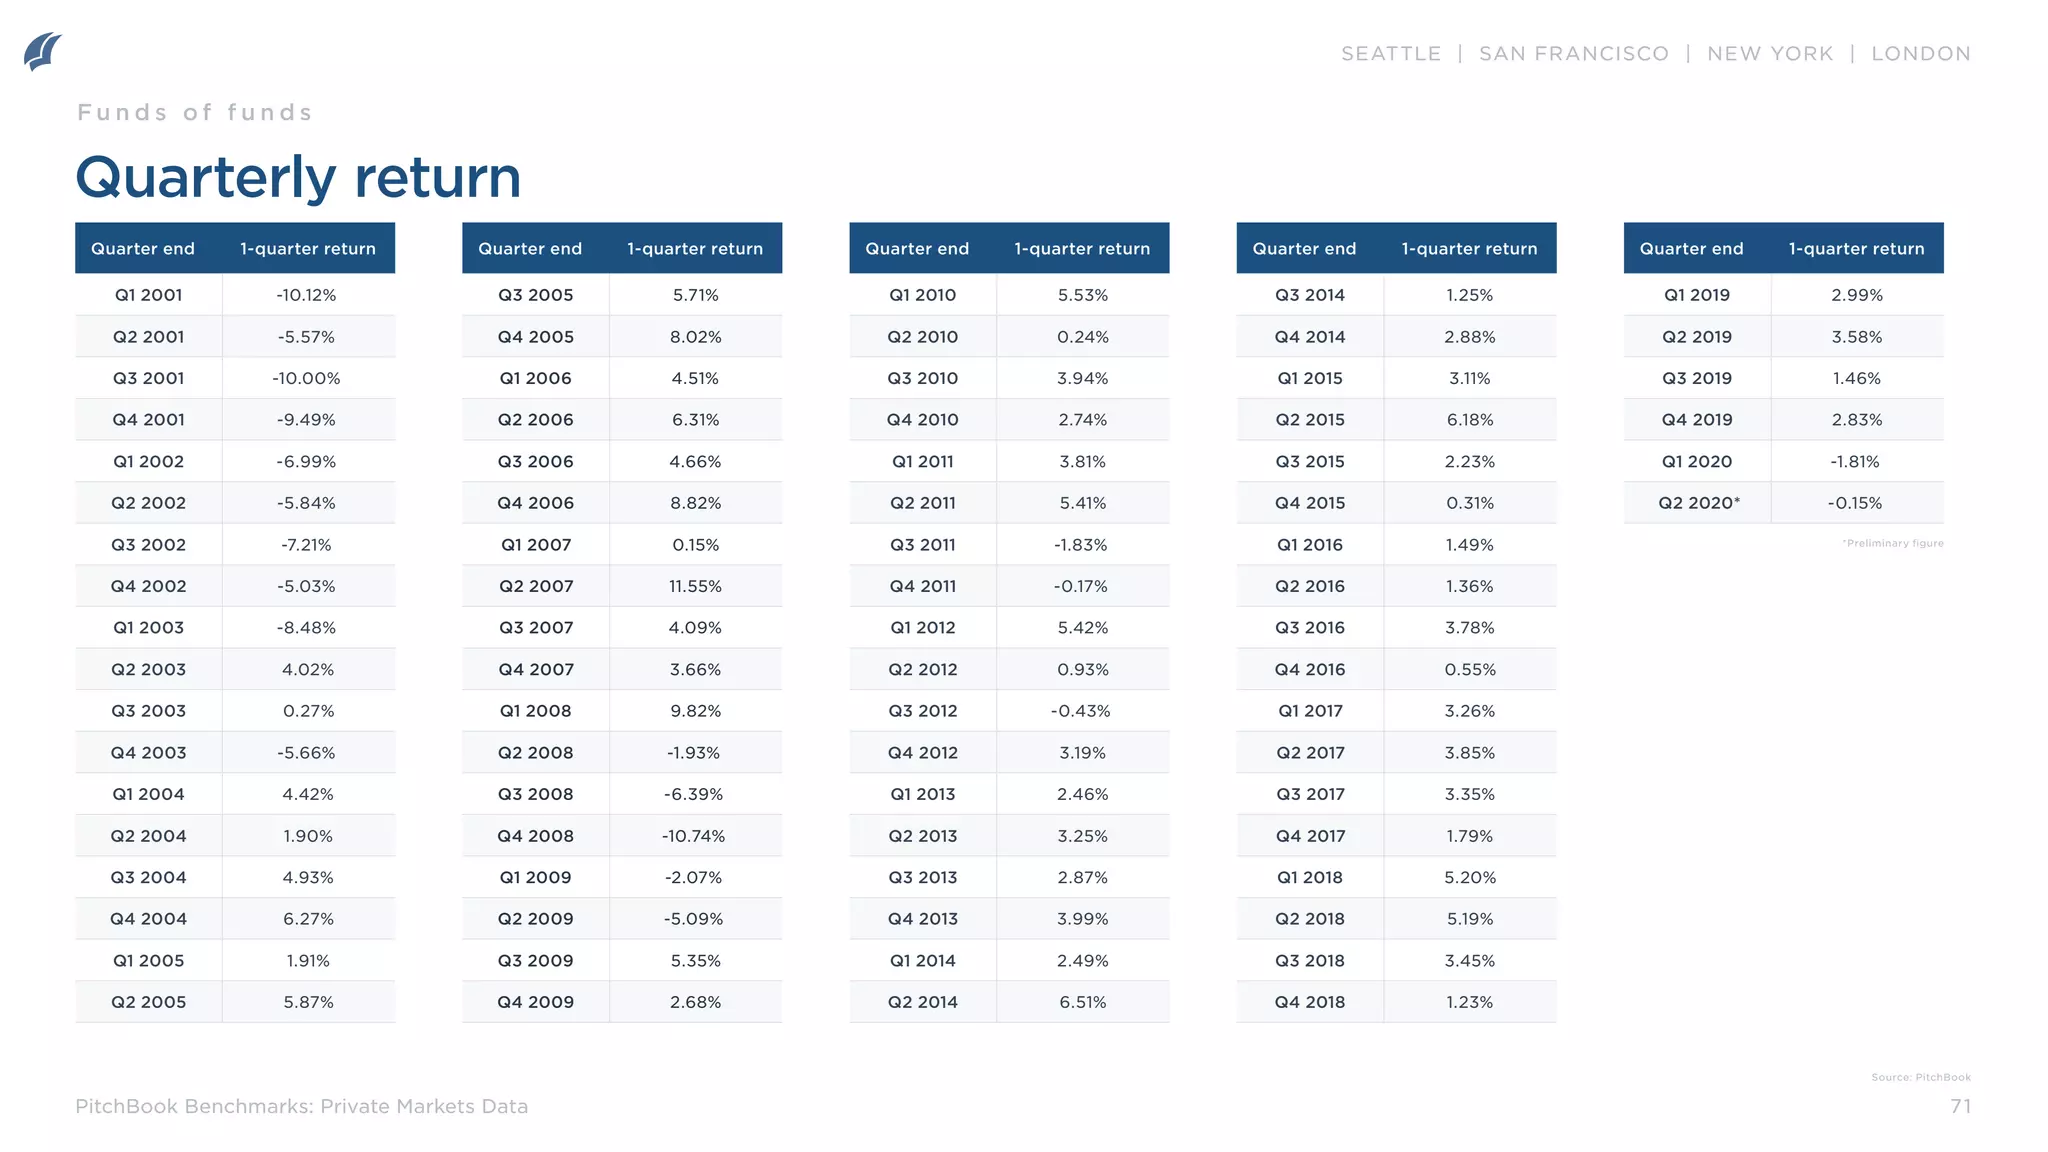
Quarterly return: The percentage change in aggregate NAV is calculated for each group of funds in a sample, considering
contributions and distributions during the quarter. This makes the calculation tantamount to a quarterly compounded
growth rate.
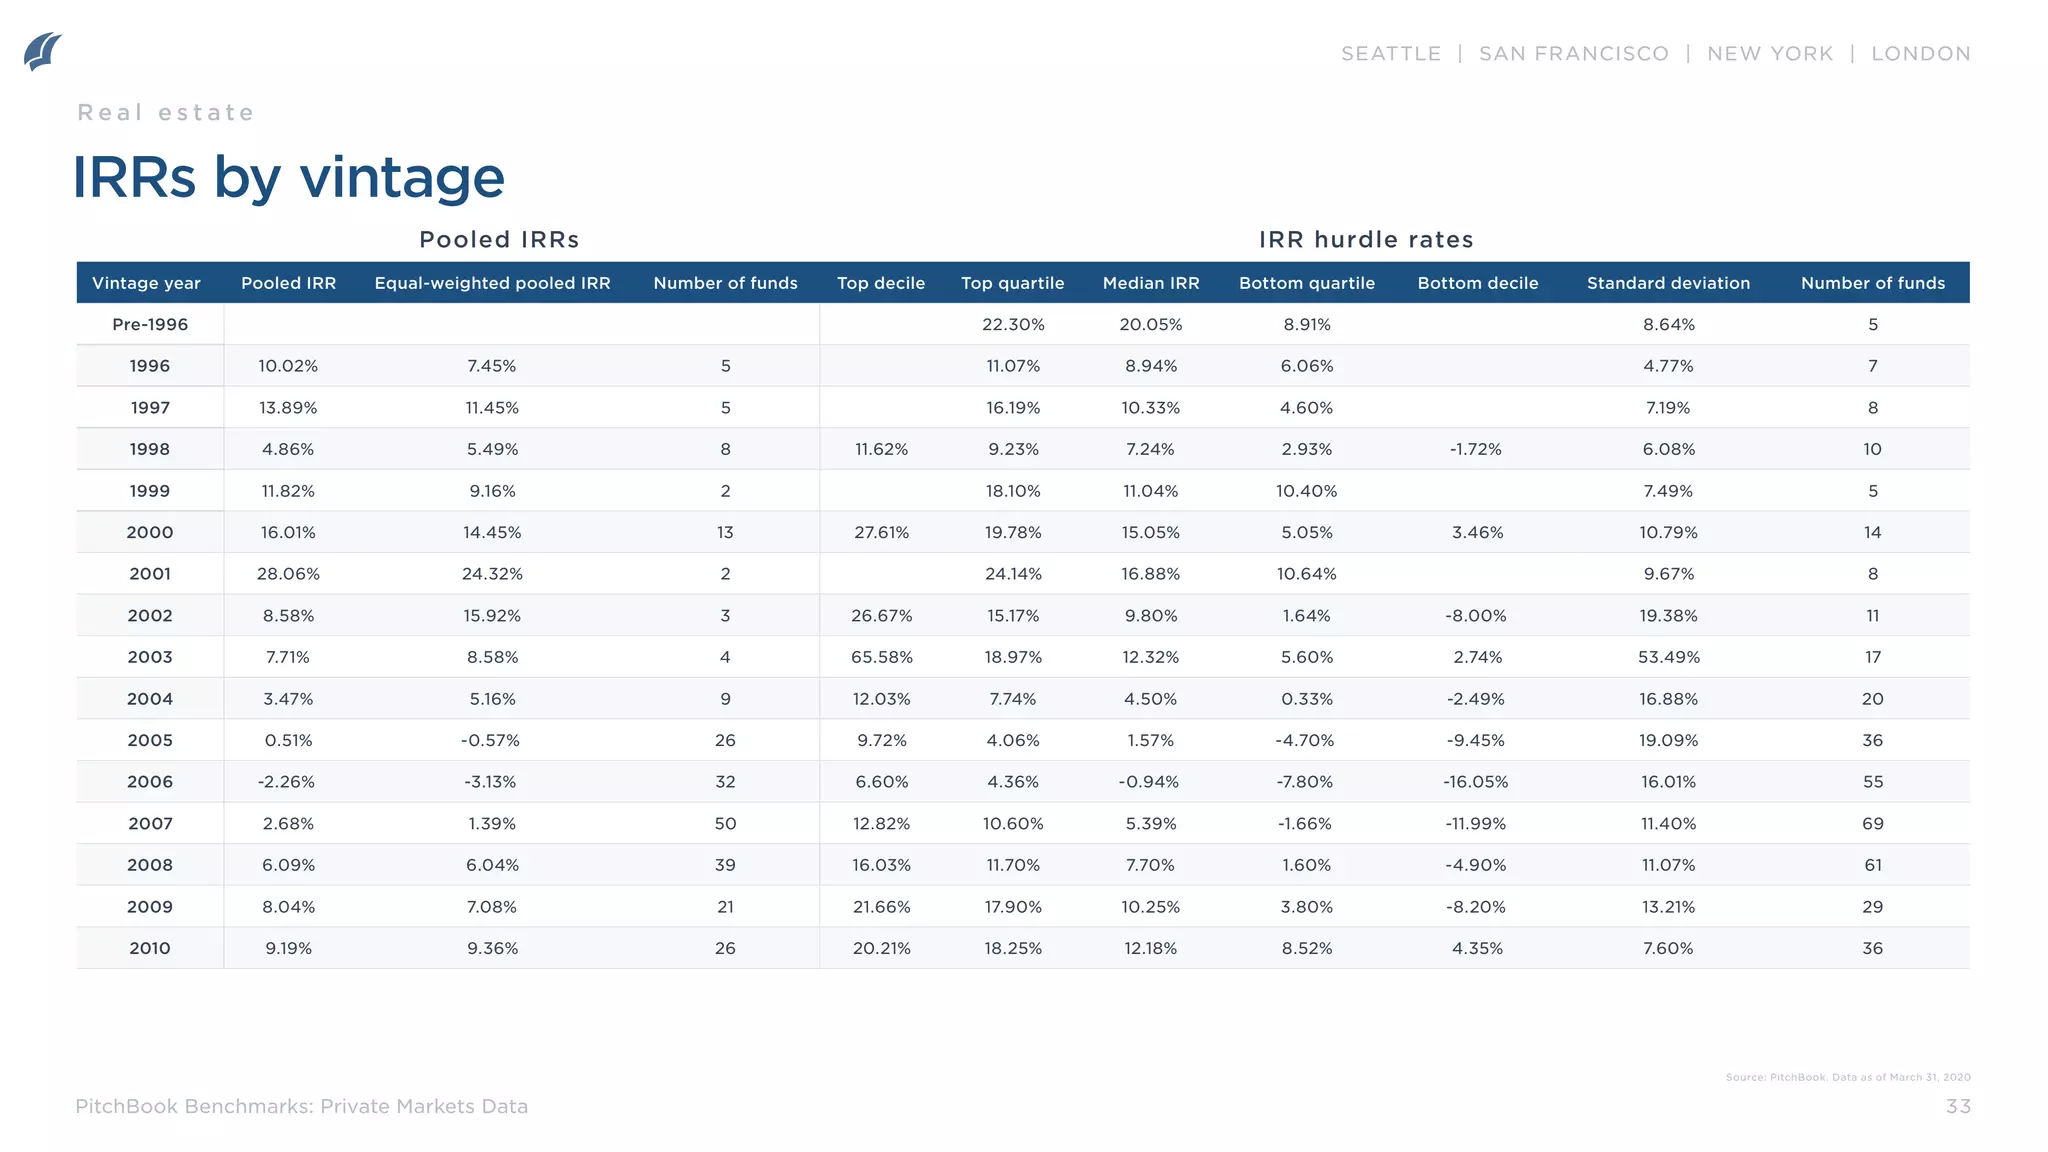
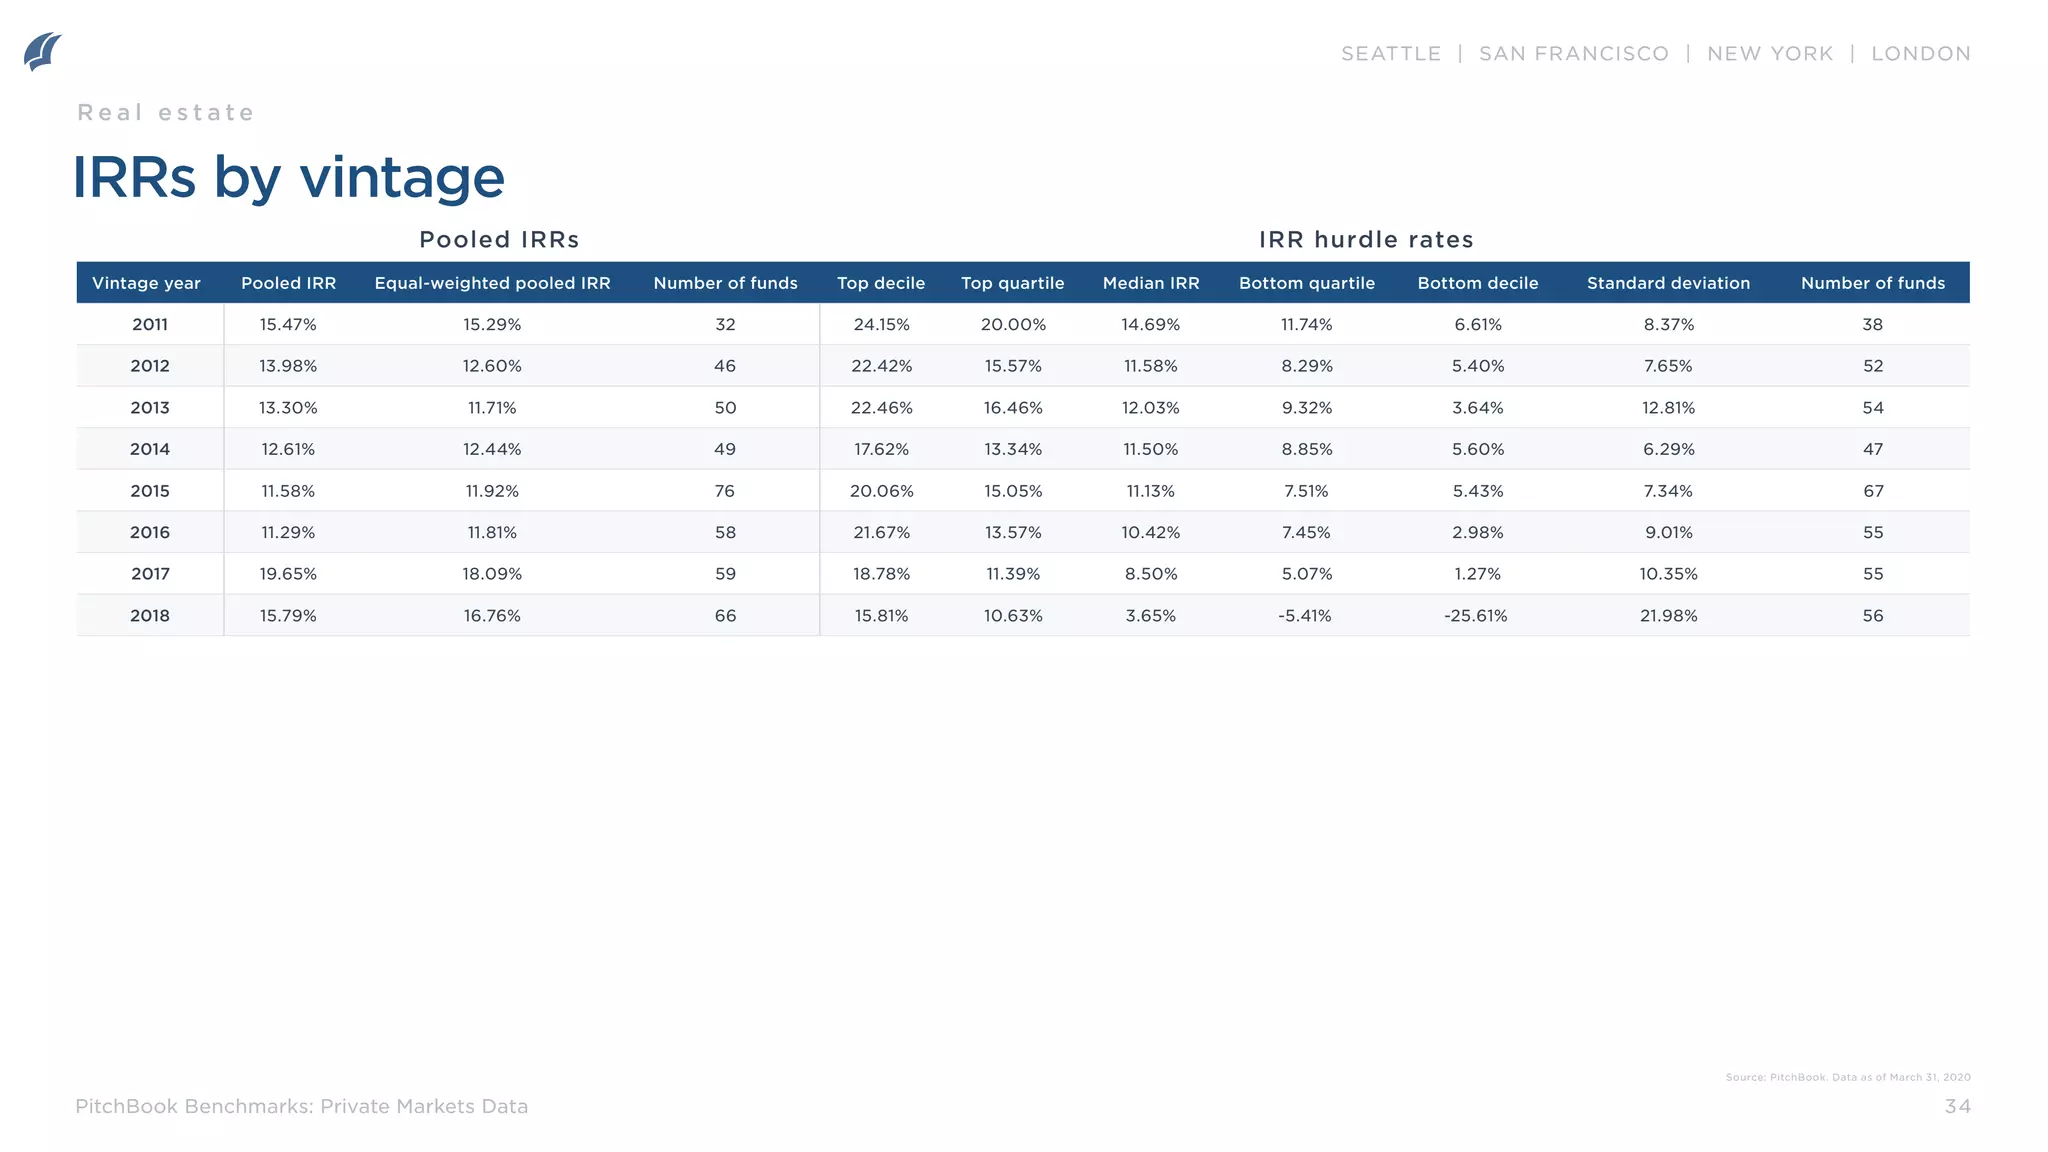
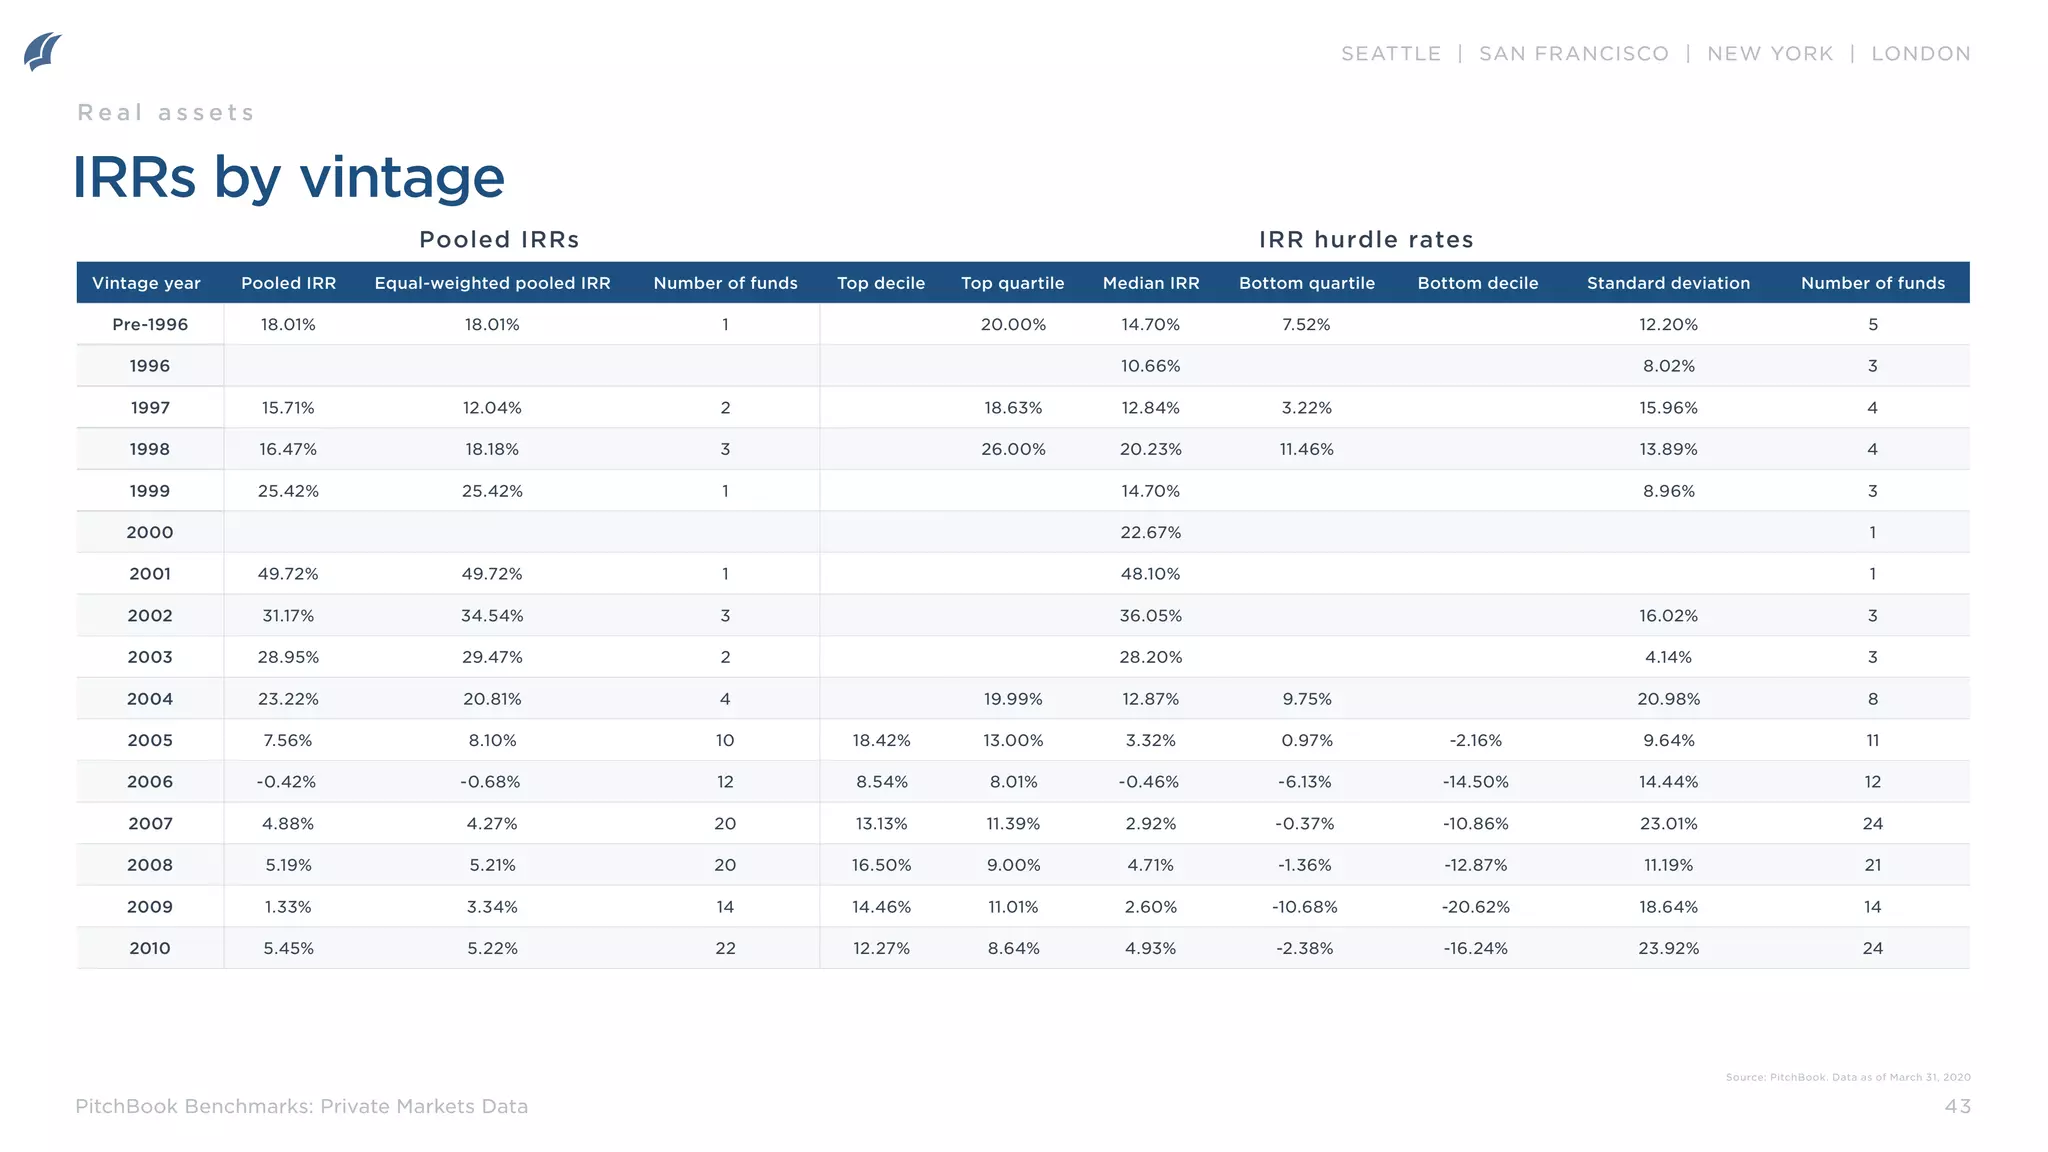
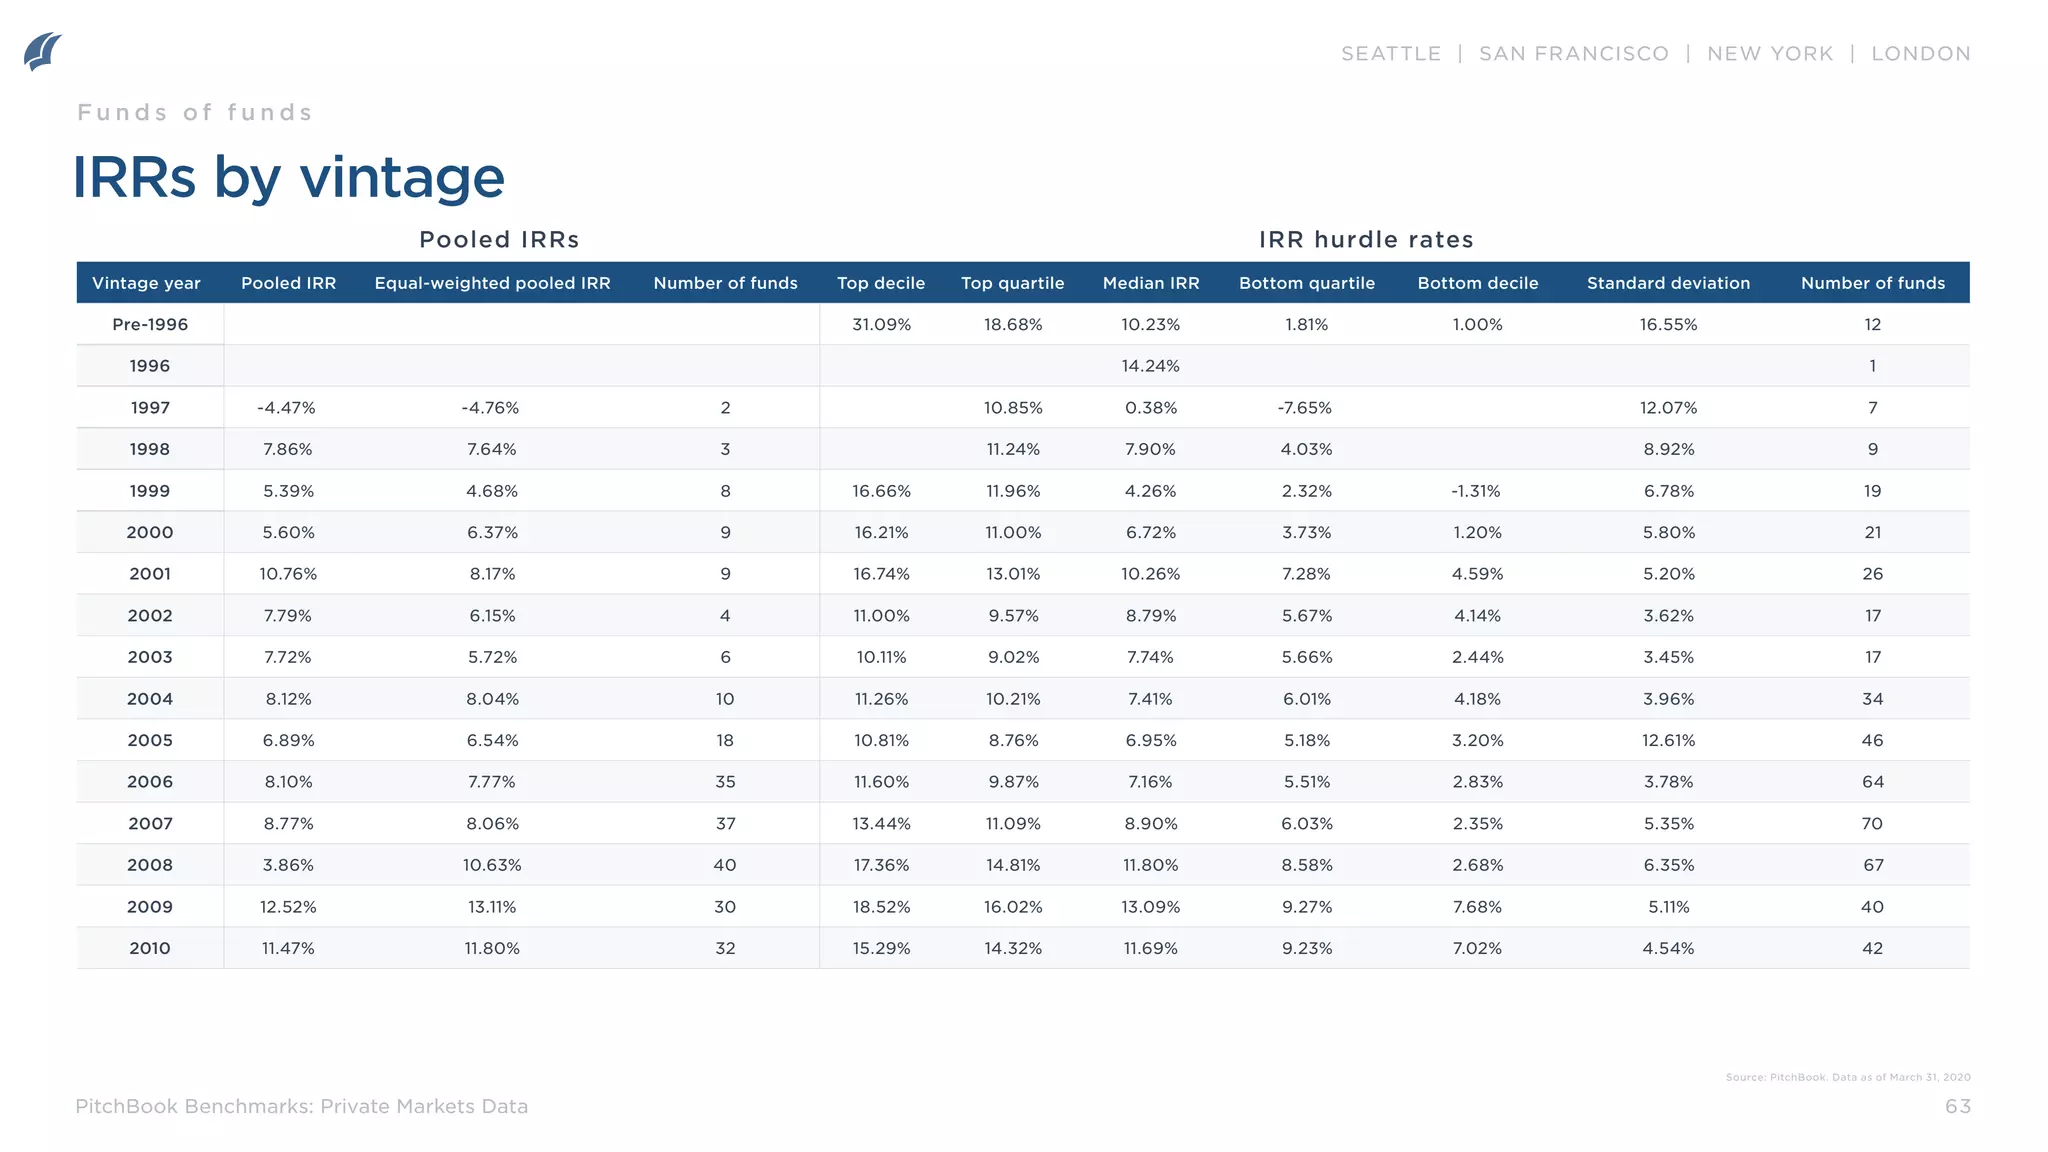
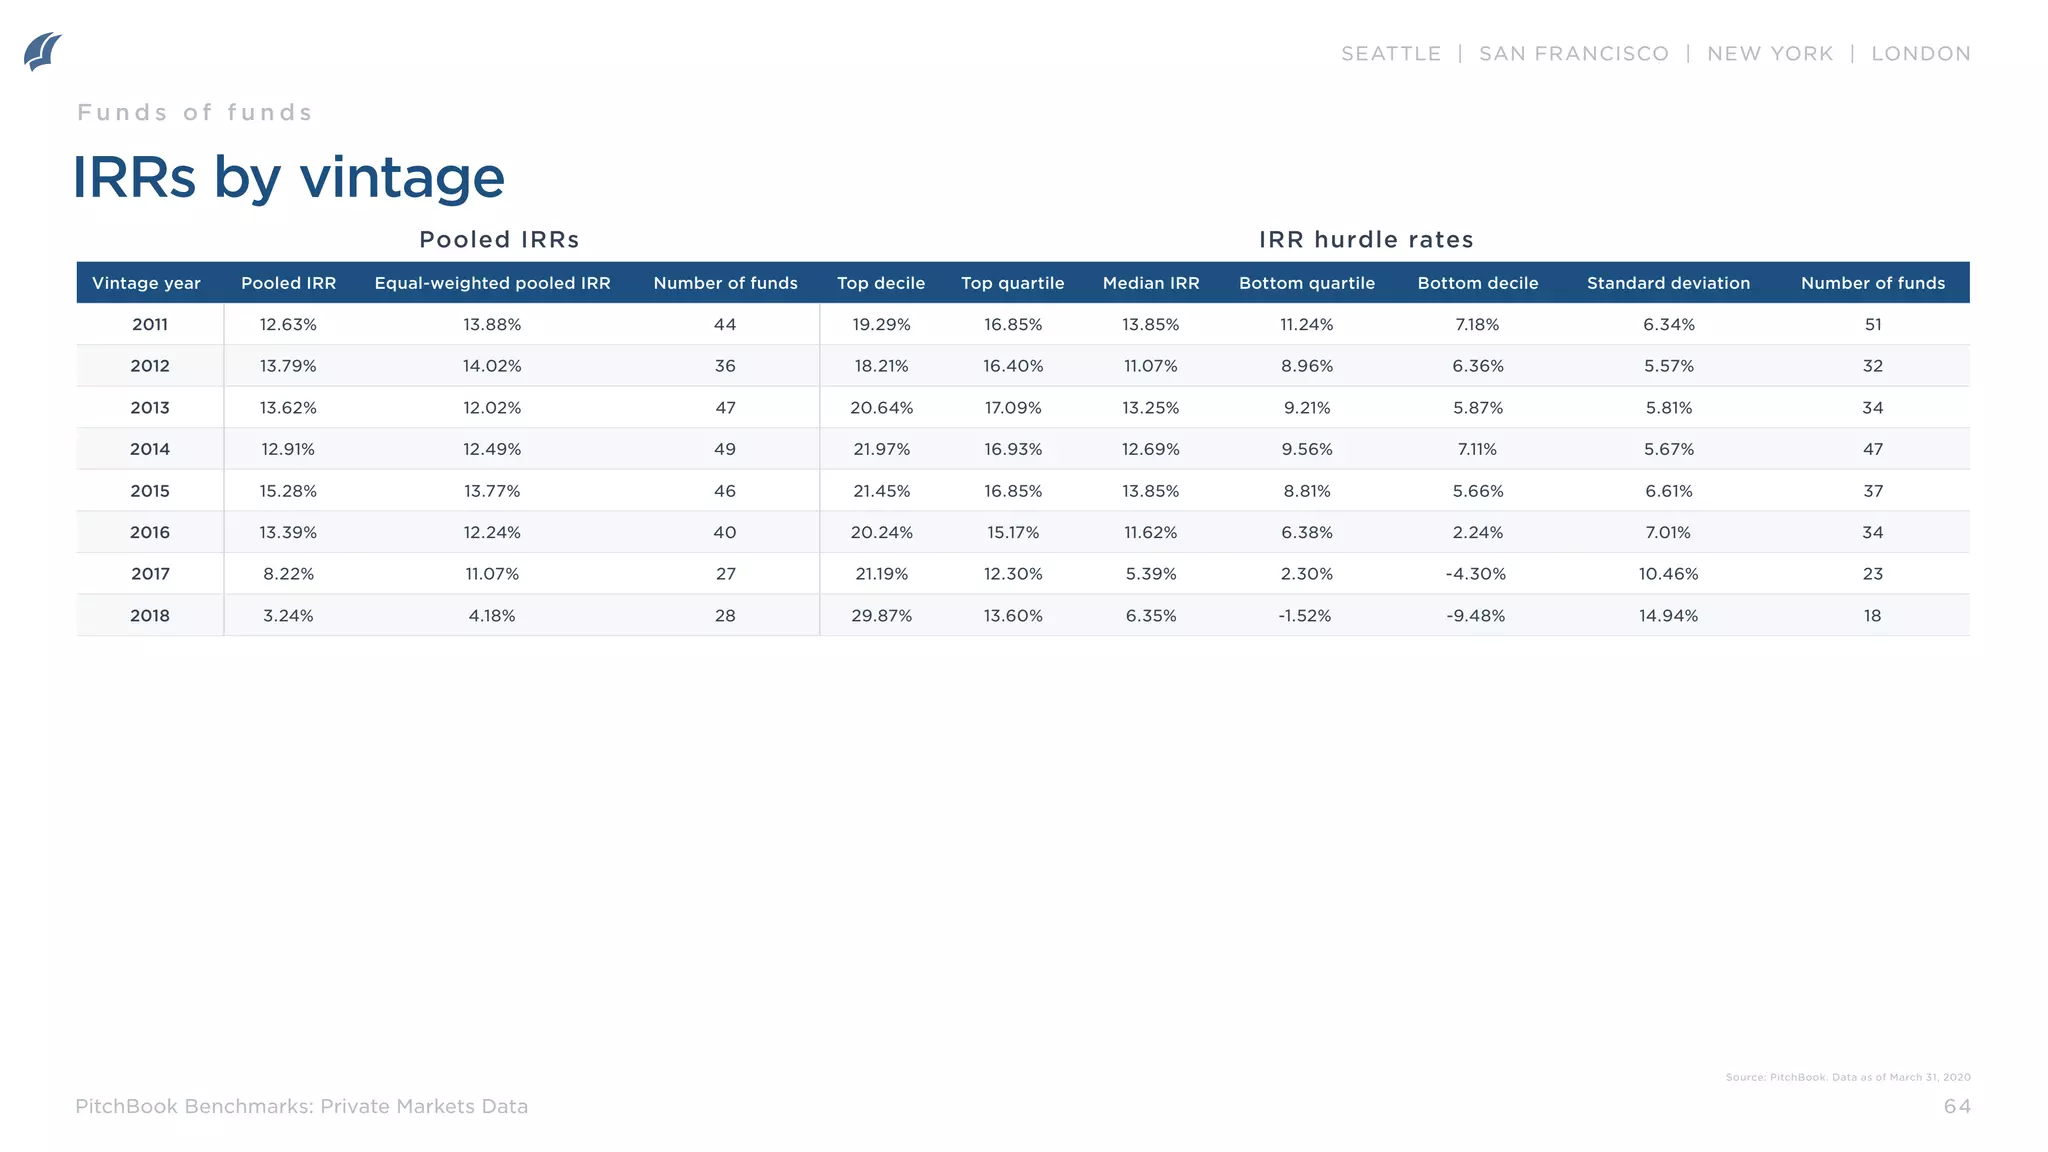
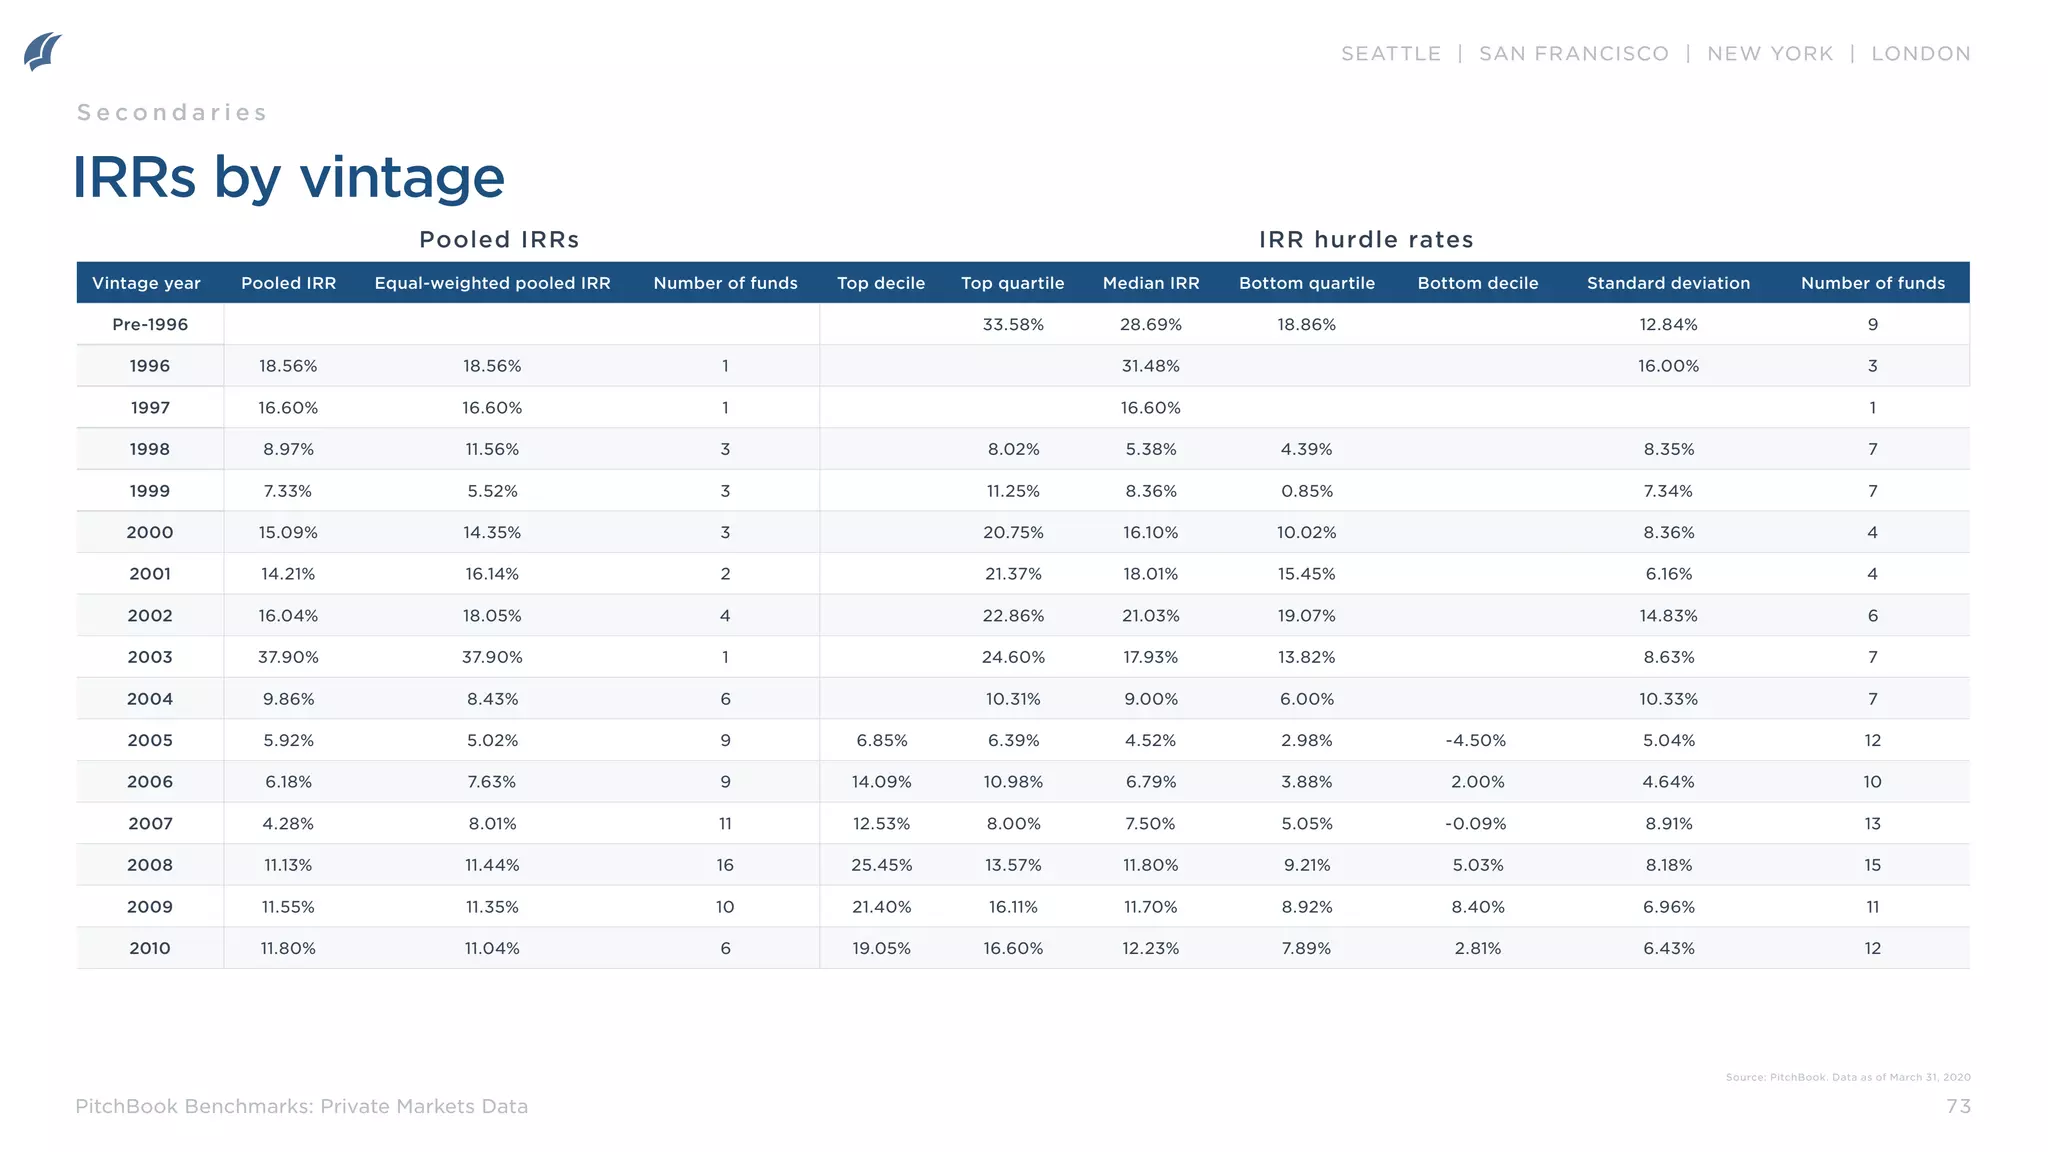
Internal rate of return (IRR): IRR represents the rate at which an historical series of cash flows are discounted so that the
net present value of the cash flows equals zero. For pooled calculations, any remaining unrealized value in the fund is
treated as a distribution in the most recent reporting period. This explains why some vintages show high IRRs but low DPI
values.
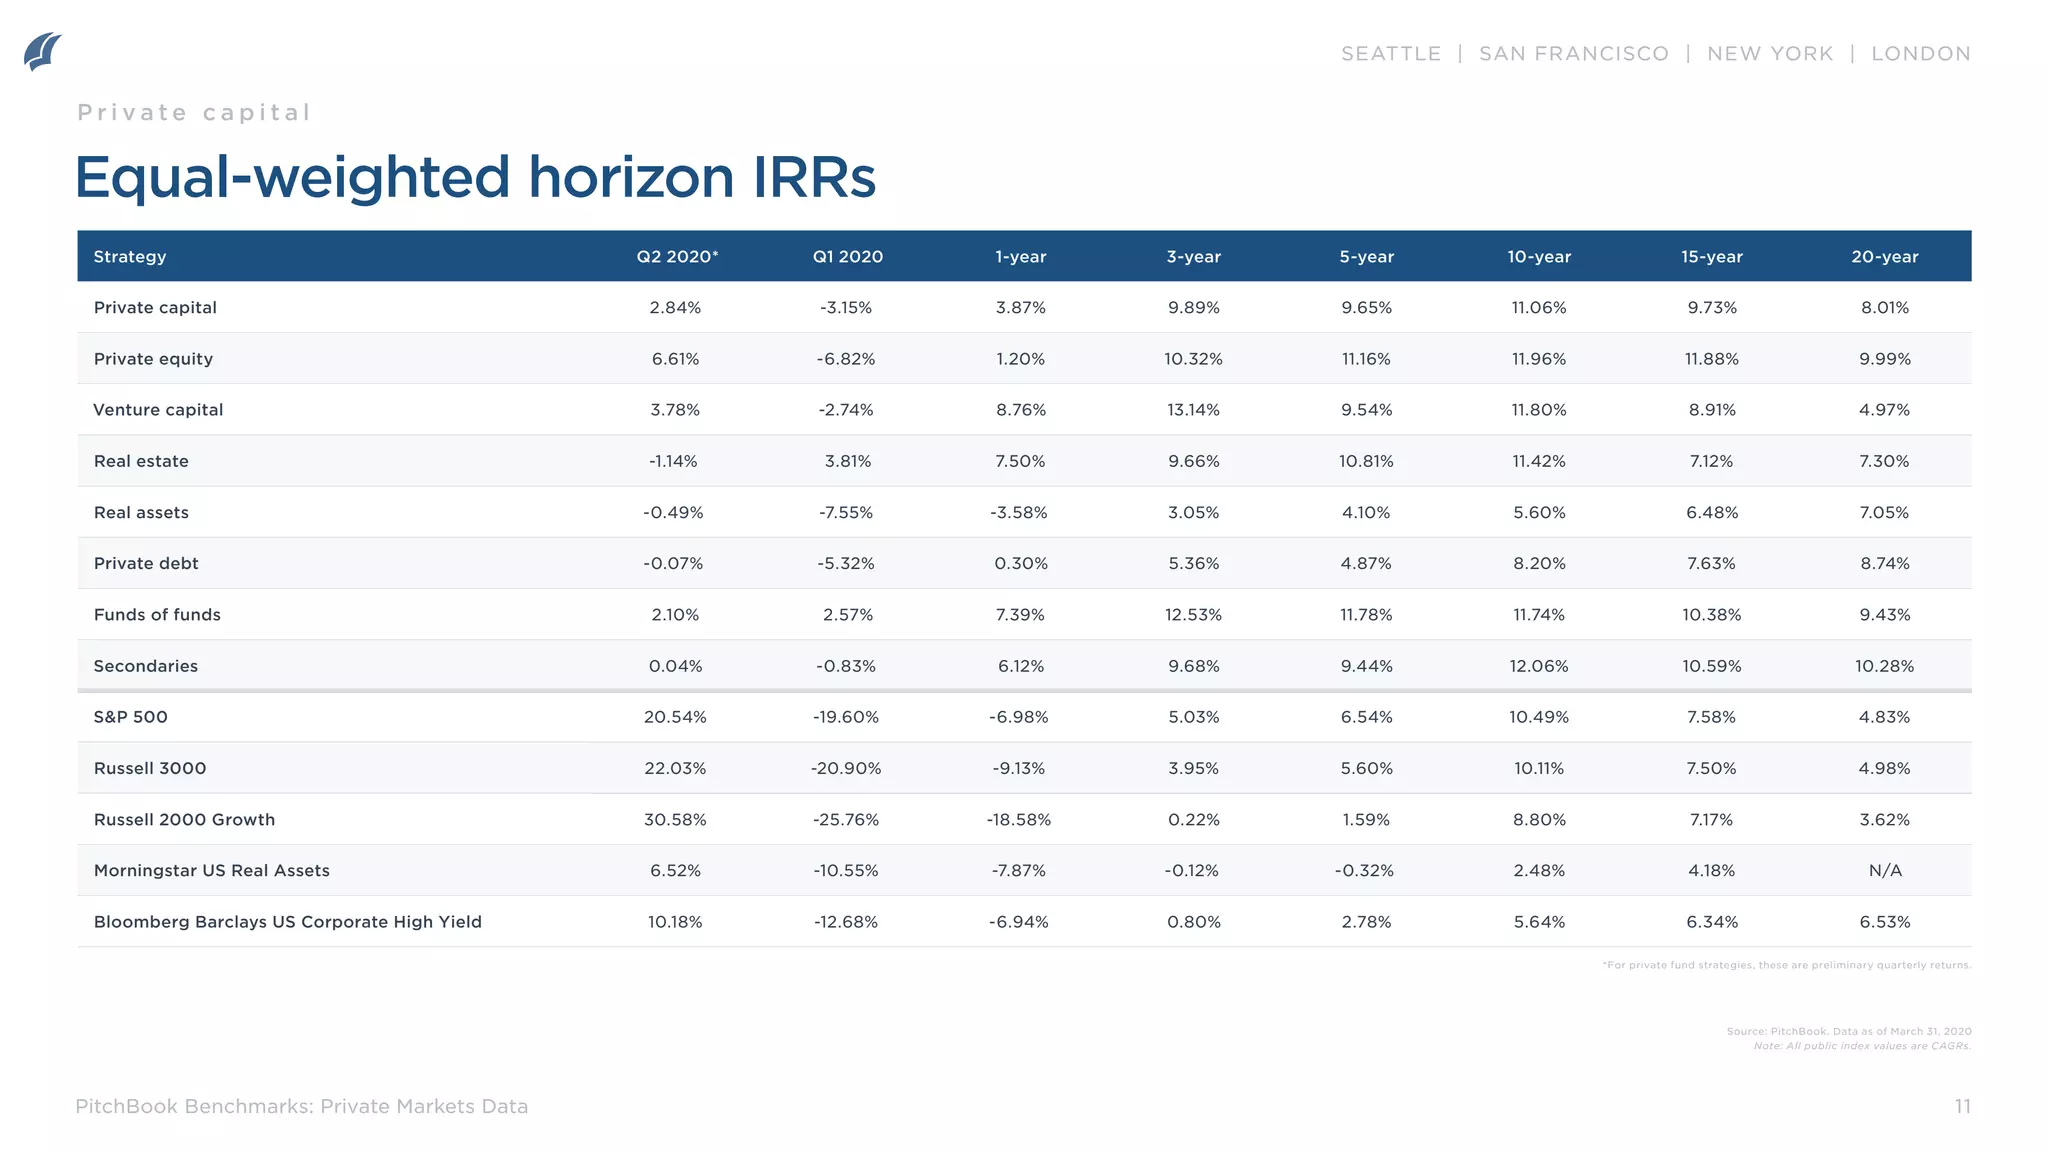
Horizon IRR: Horizon IRR is a capital-weighted pooled calculation that shows the IRR for a certain range in time. For
example, the one-year horizon IRR figures in the report may show the IRR performance for the one-year period beginning
in Q2 2019 through the end of Q1 2020, while the three-year horizon IRR is for the period beginning in Q2 2017 through the
end of Q1 2020.
Quarterly IRR: Calculated as the aggregate percentage change in aggregate NAV for each
group of funds in a sample, considering contributions and distributions during the quarter. Interpolated and extended data
are not used in this calculation.
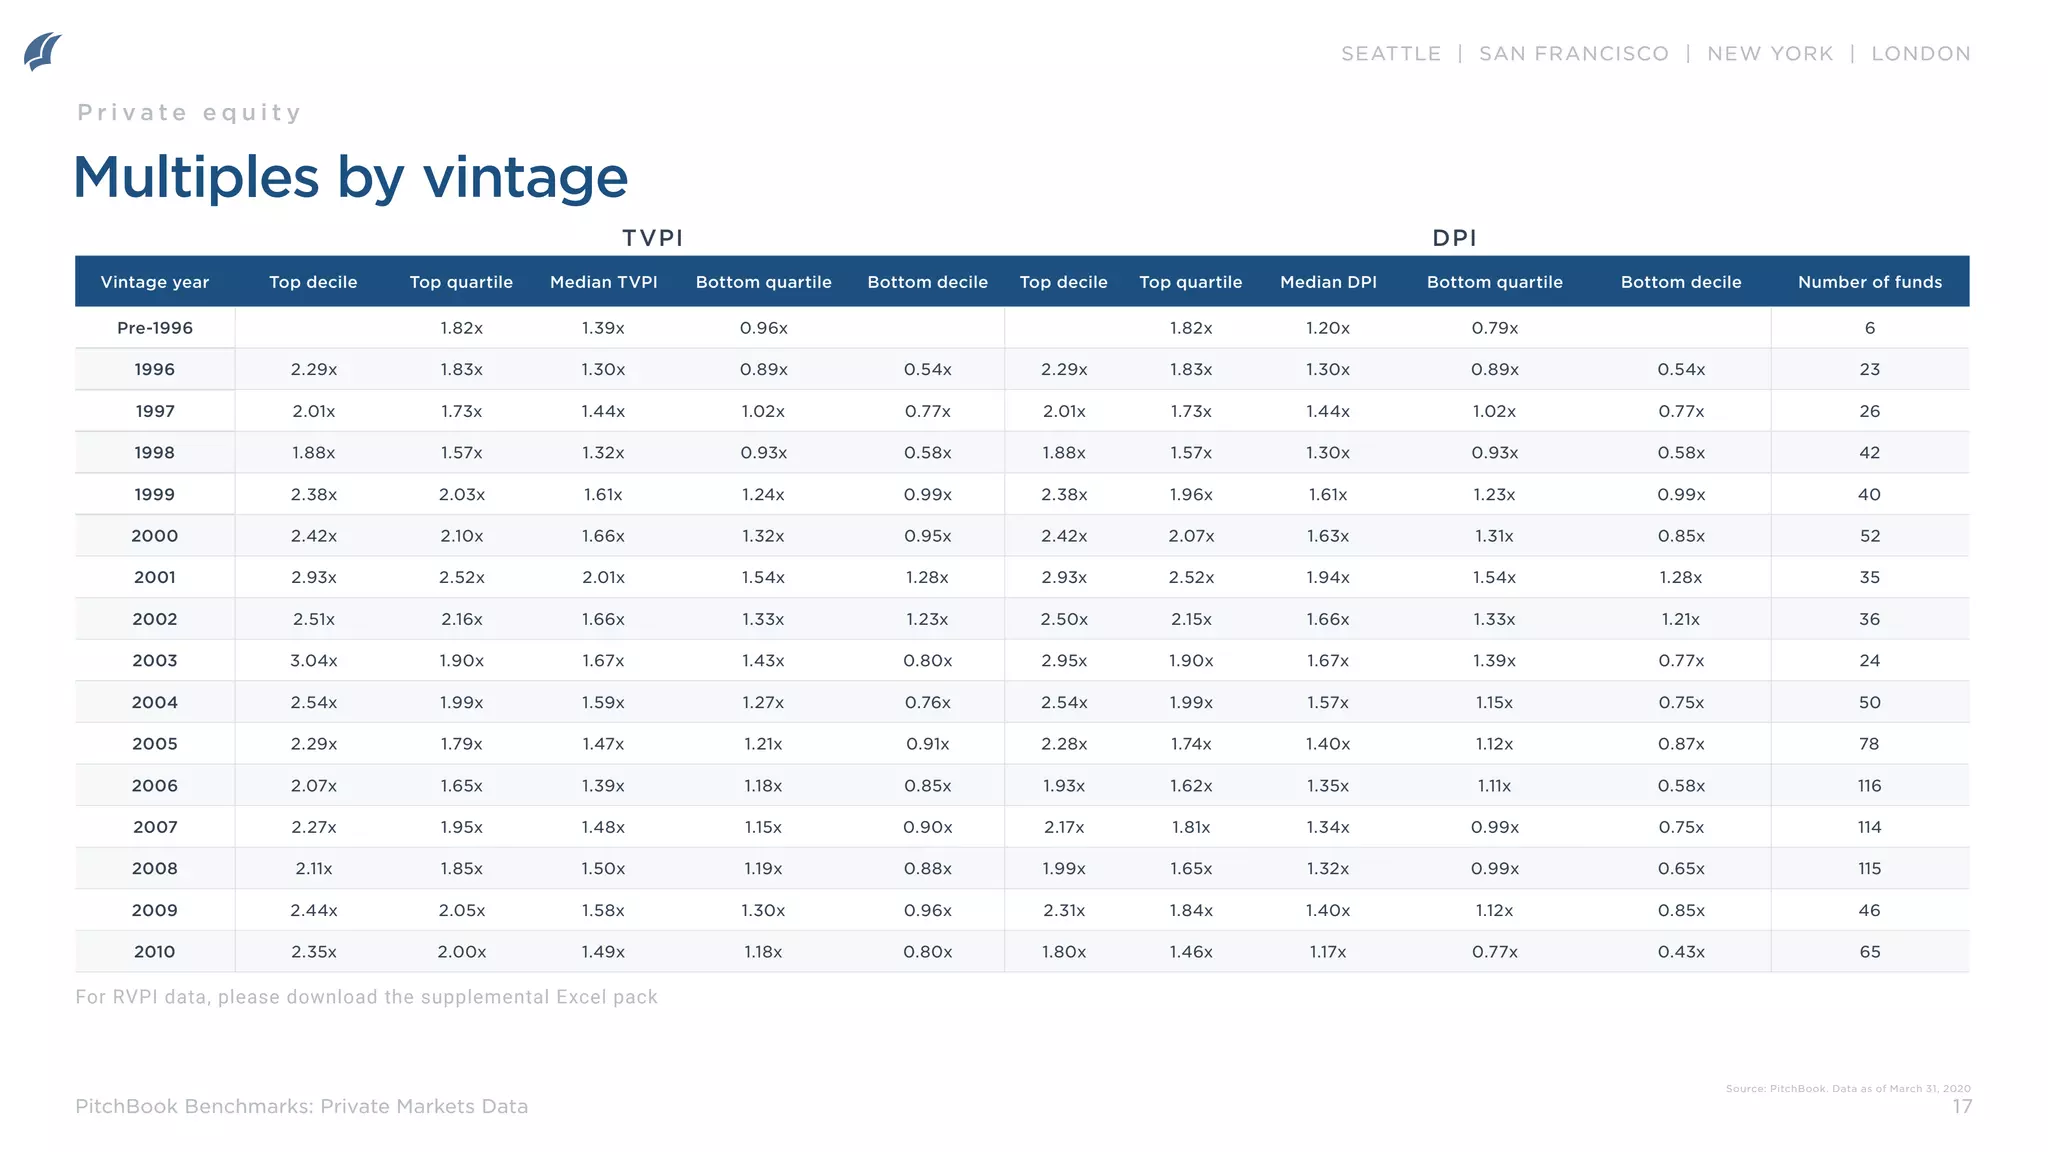
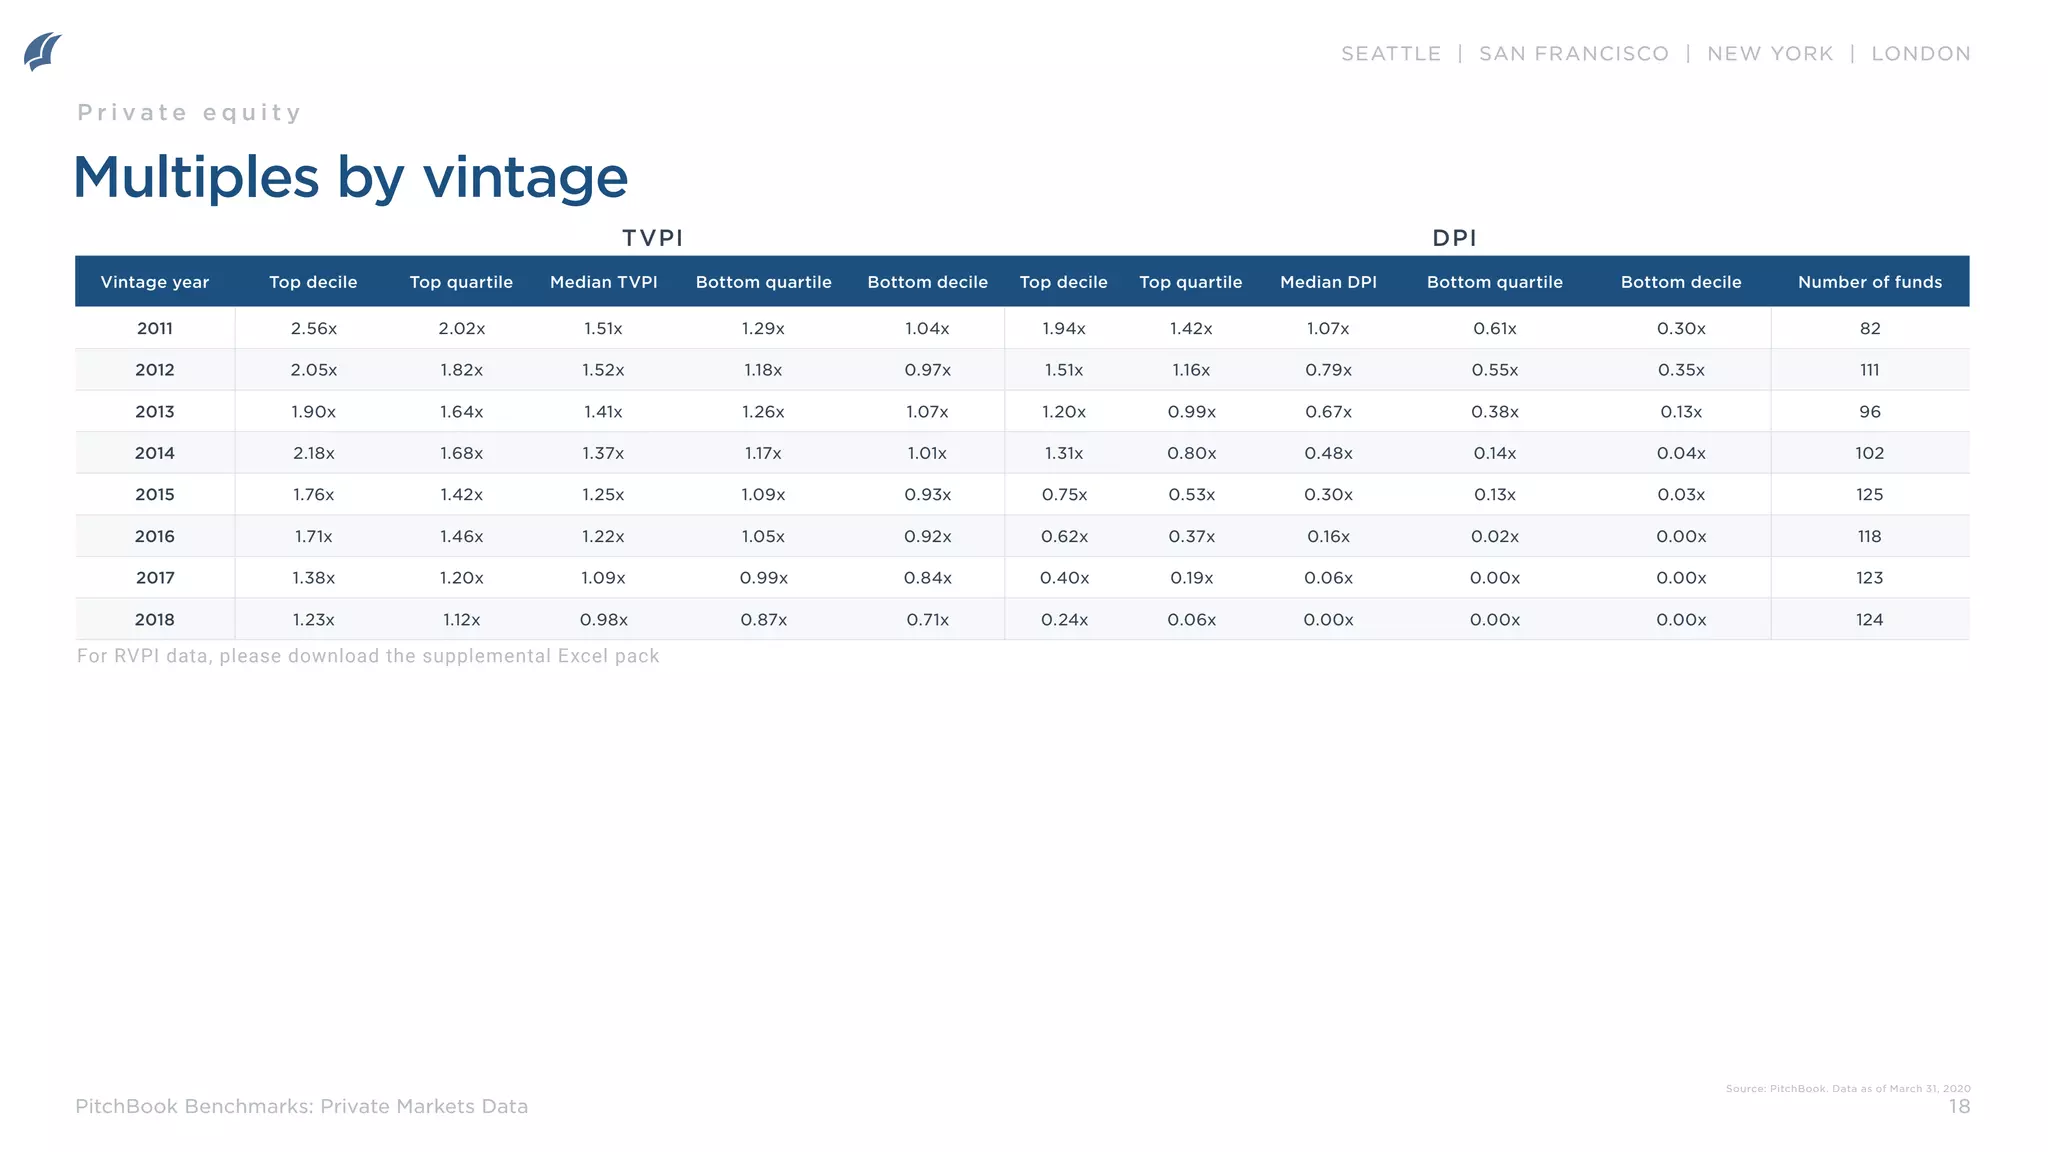
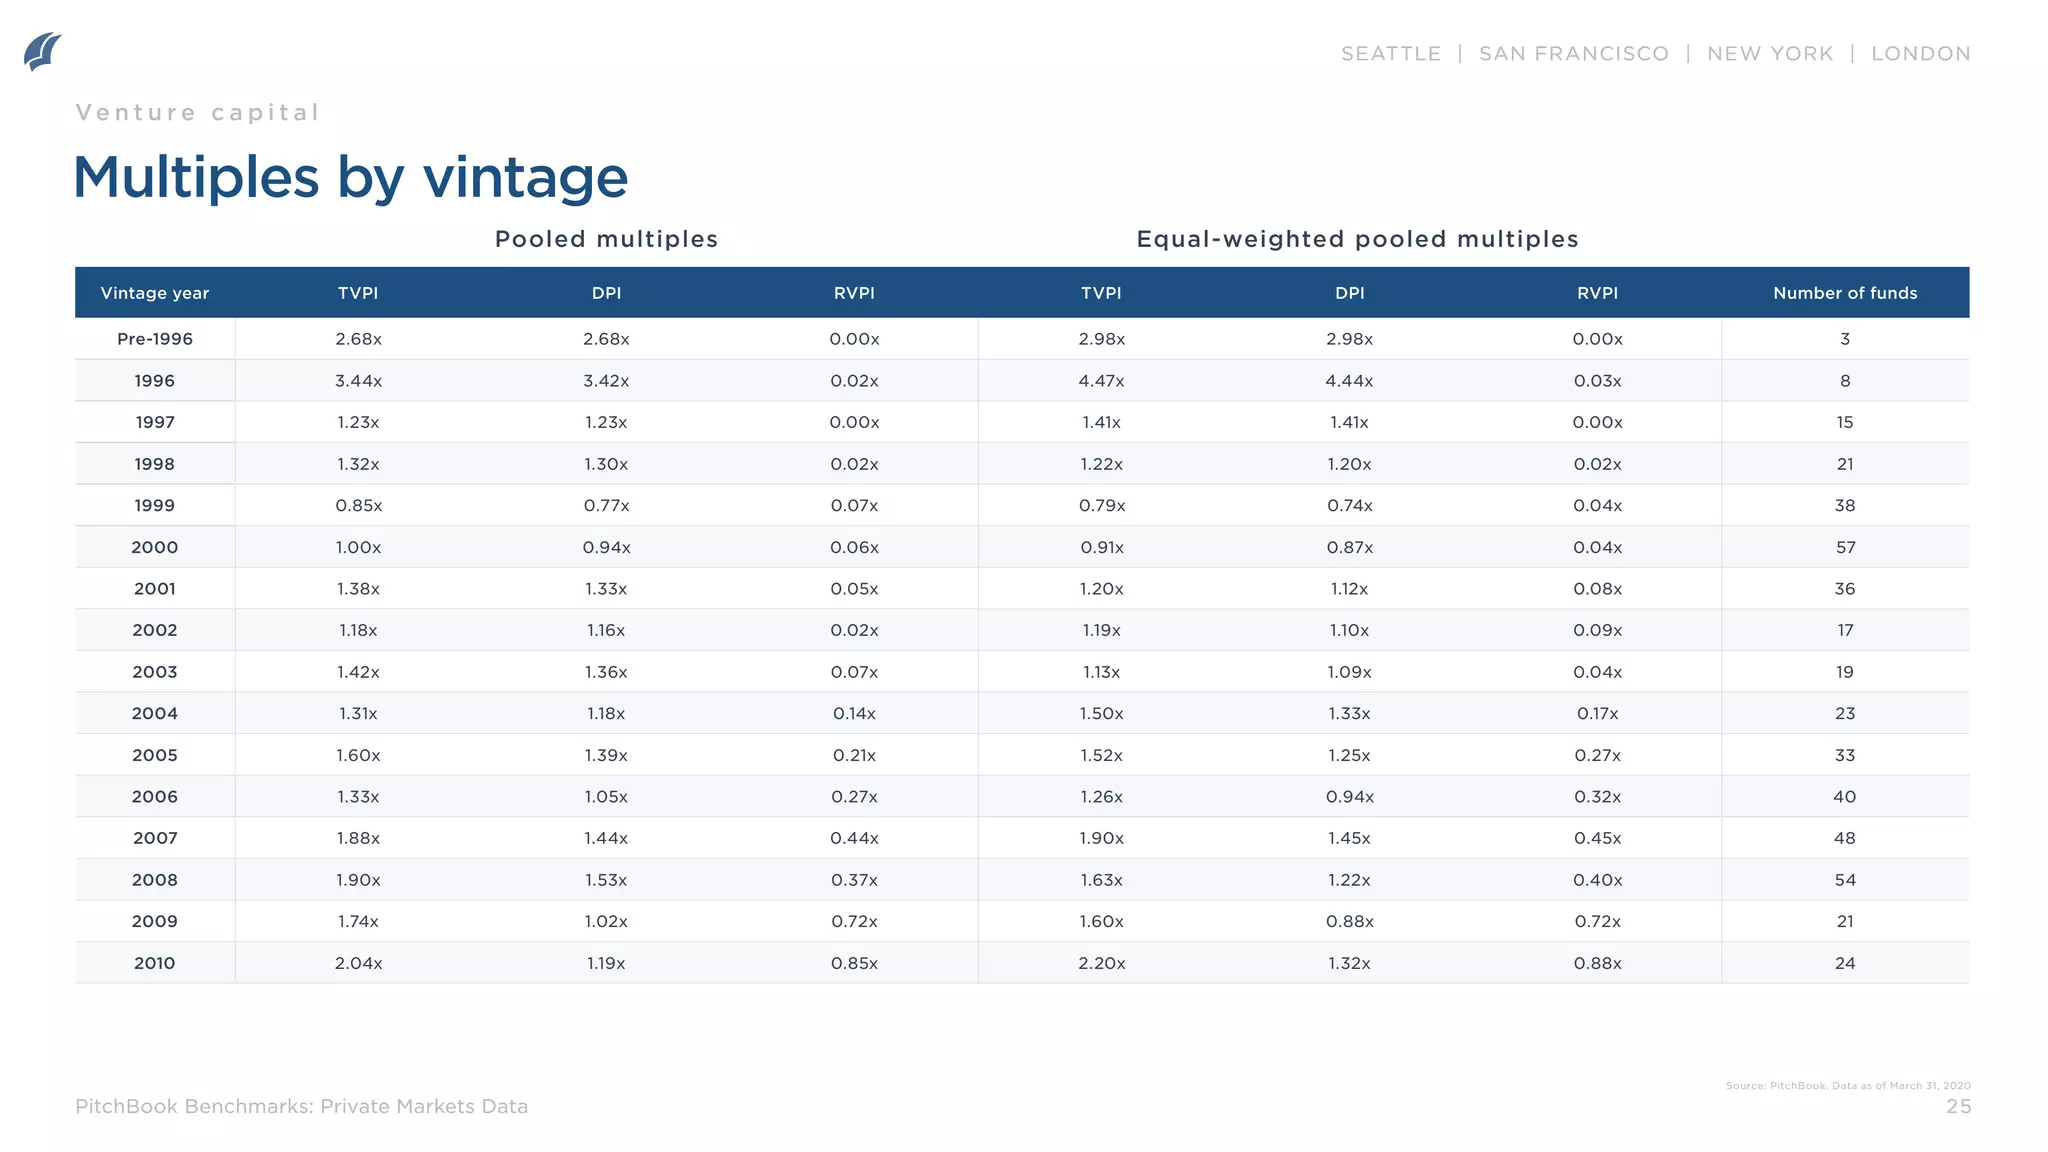
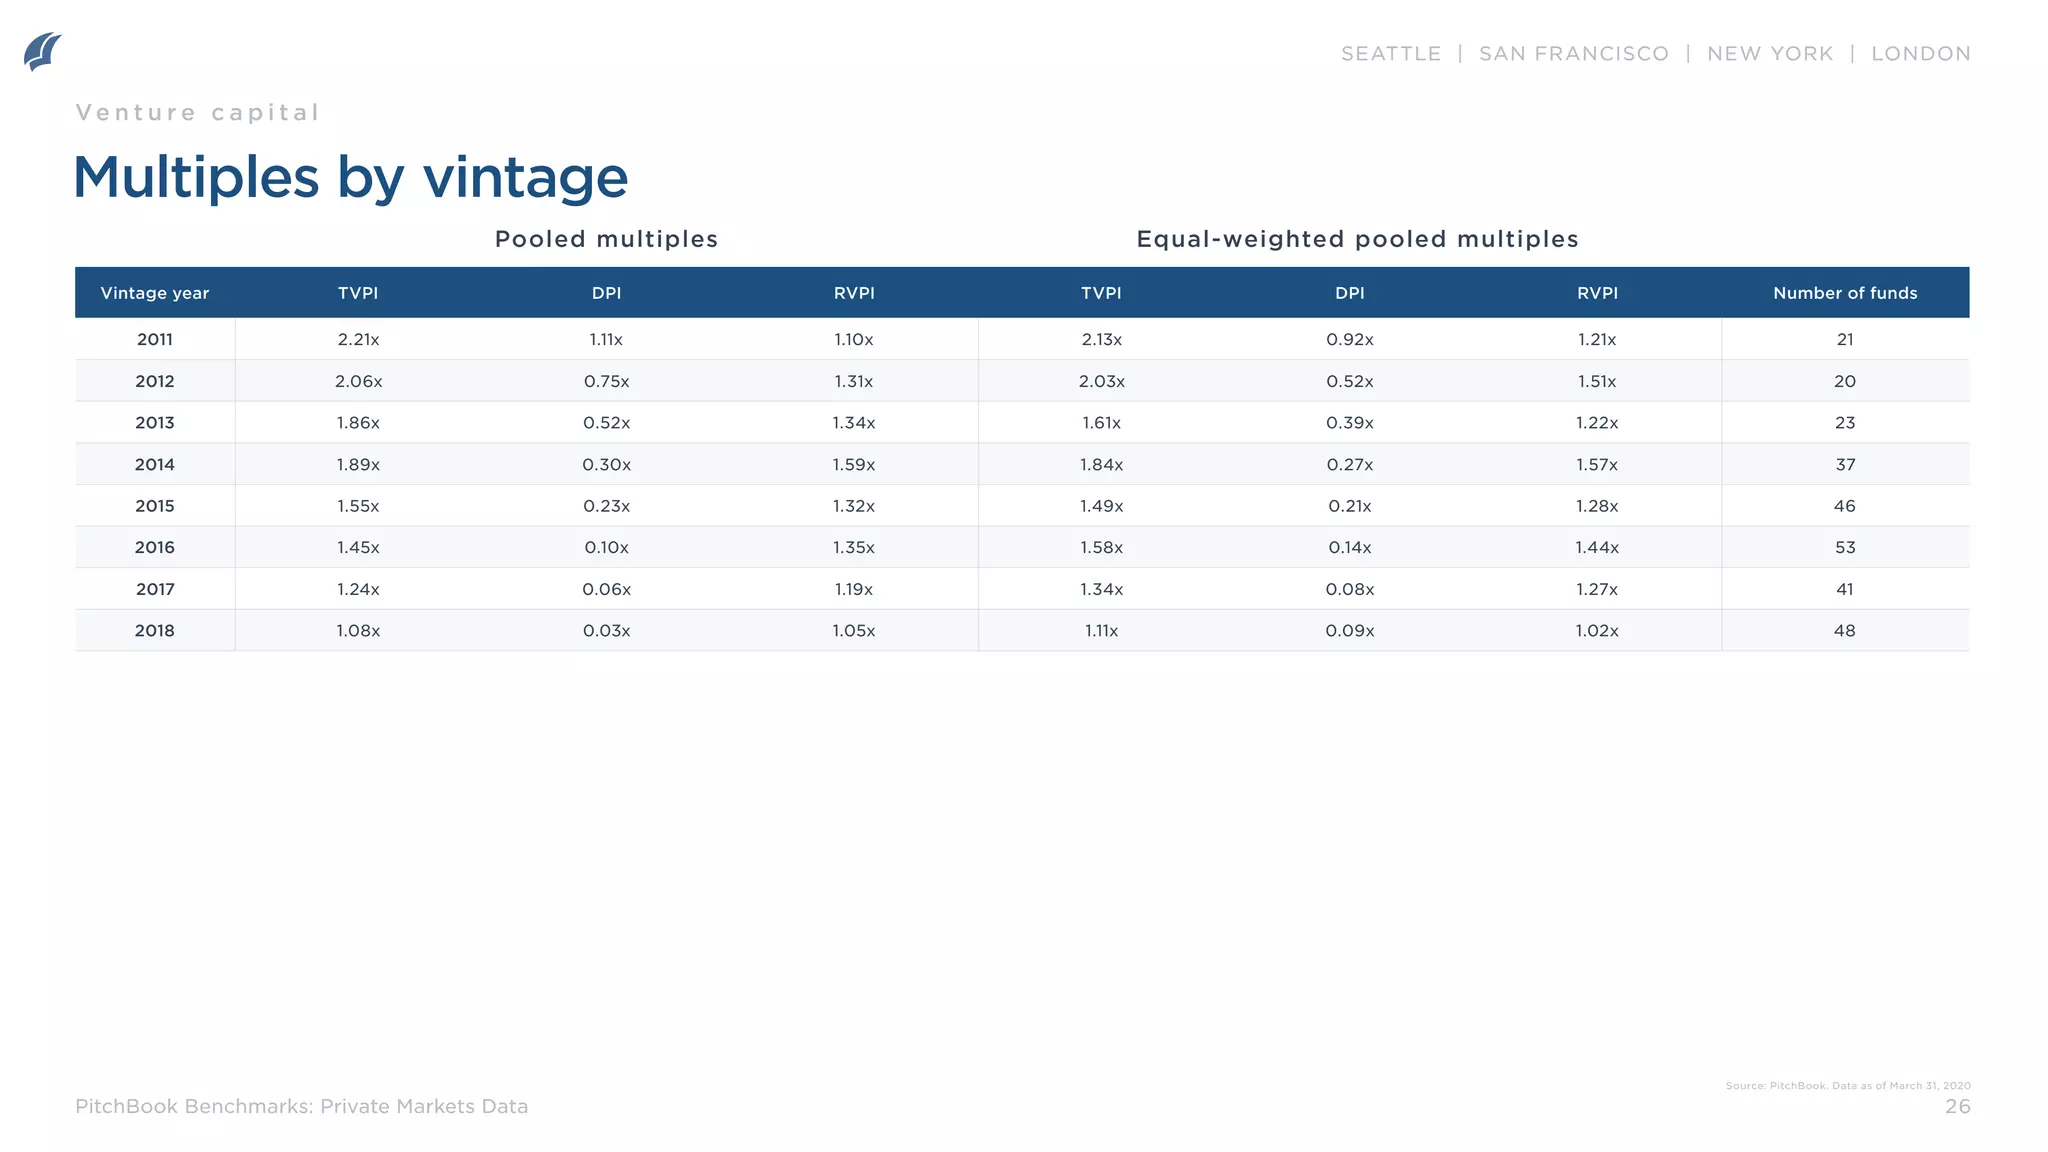
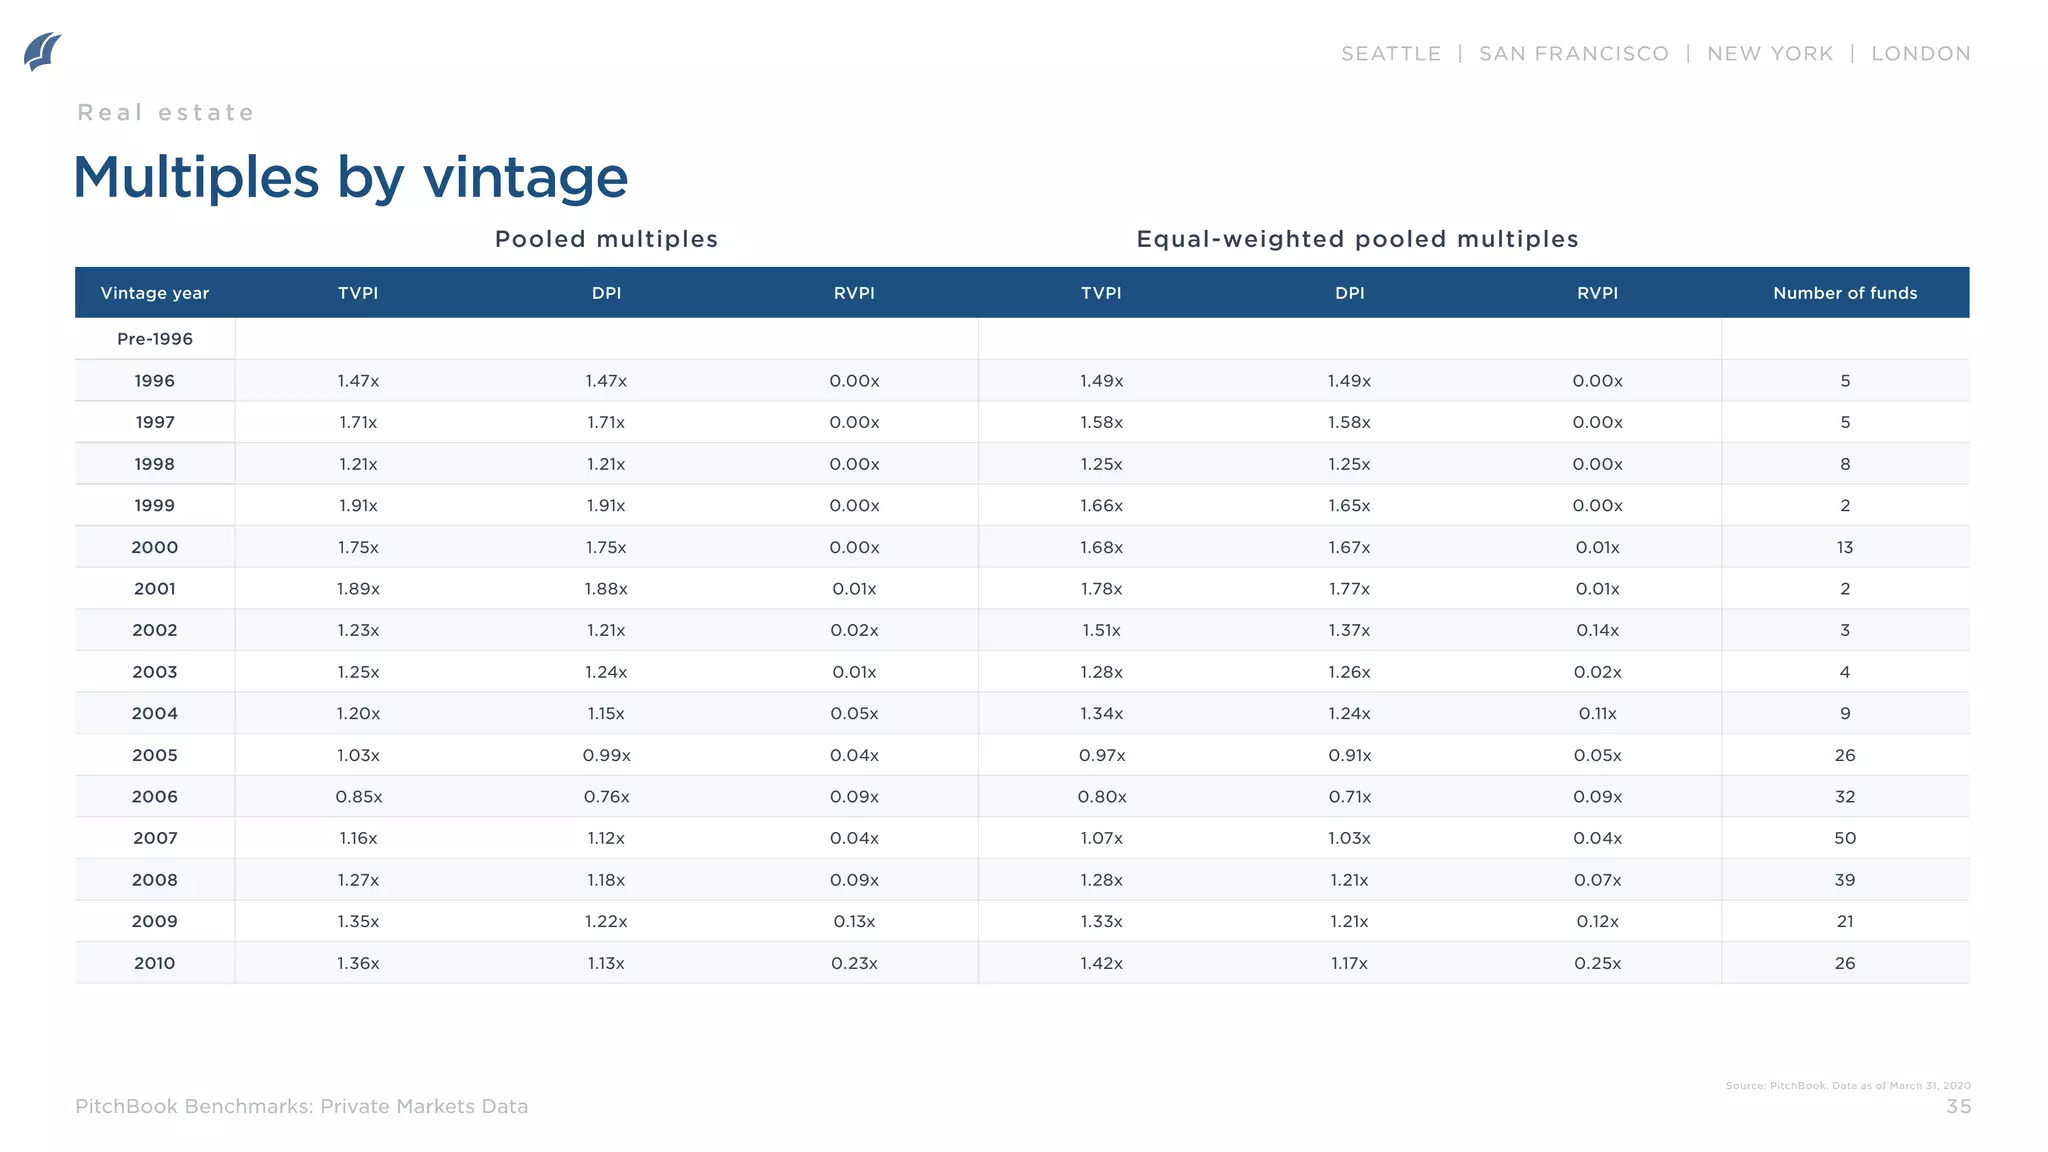
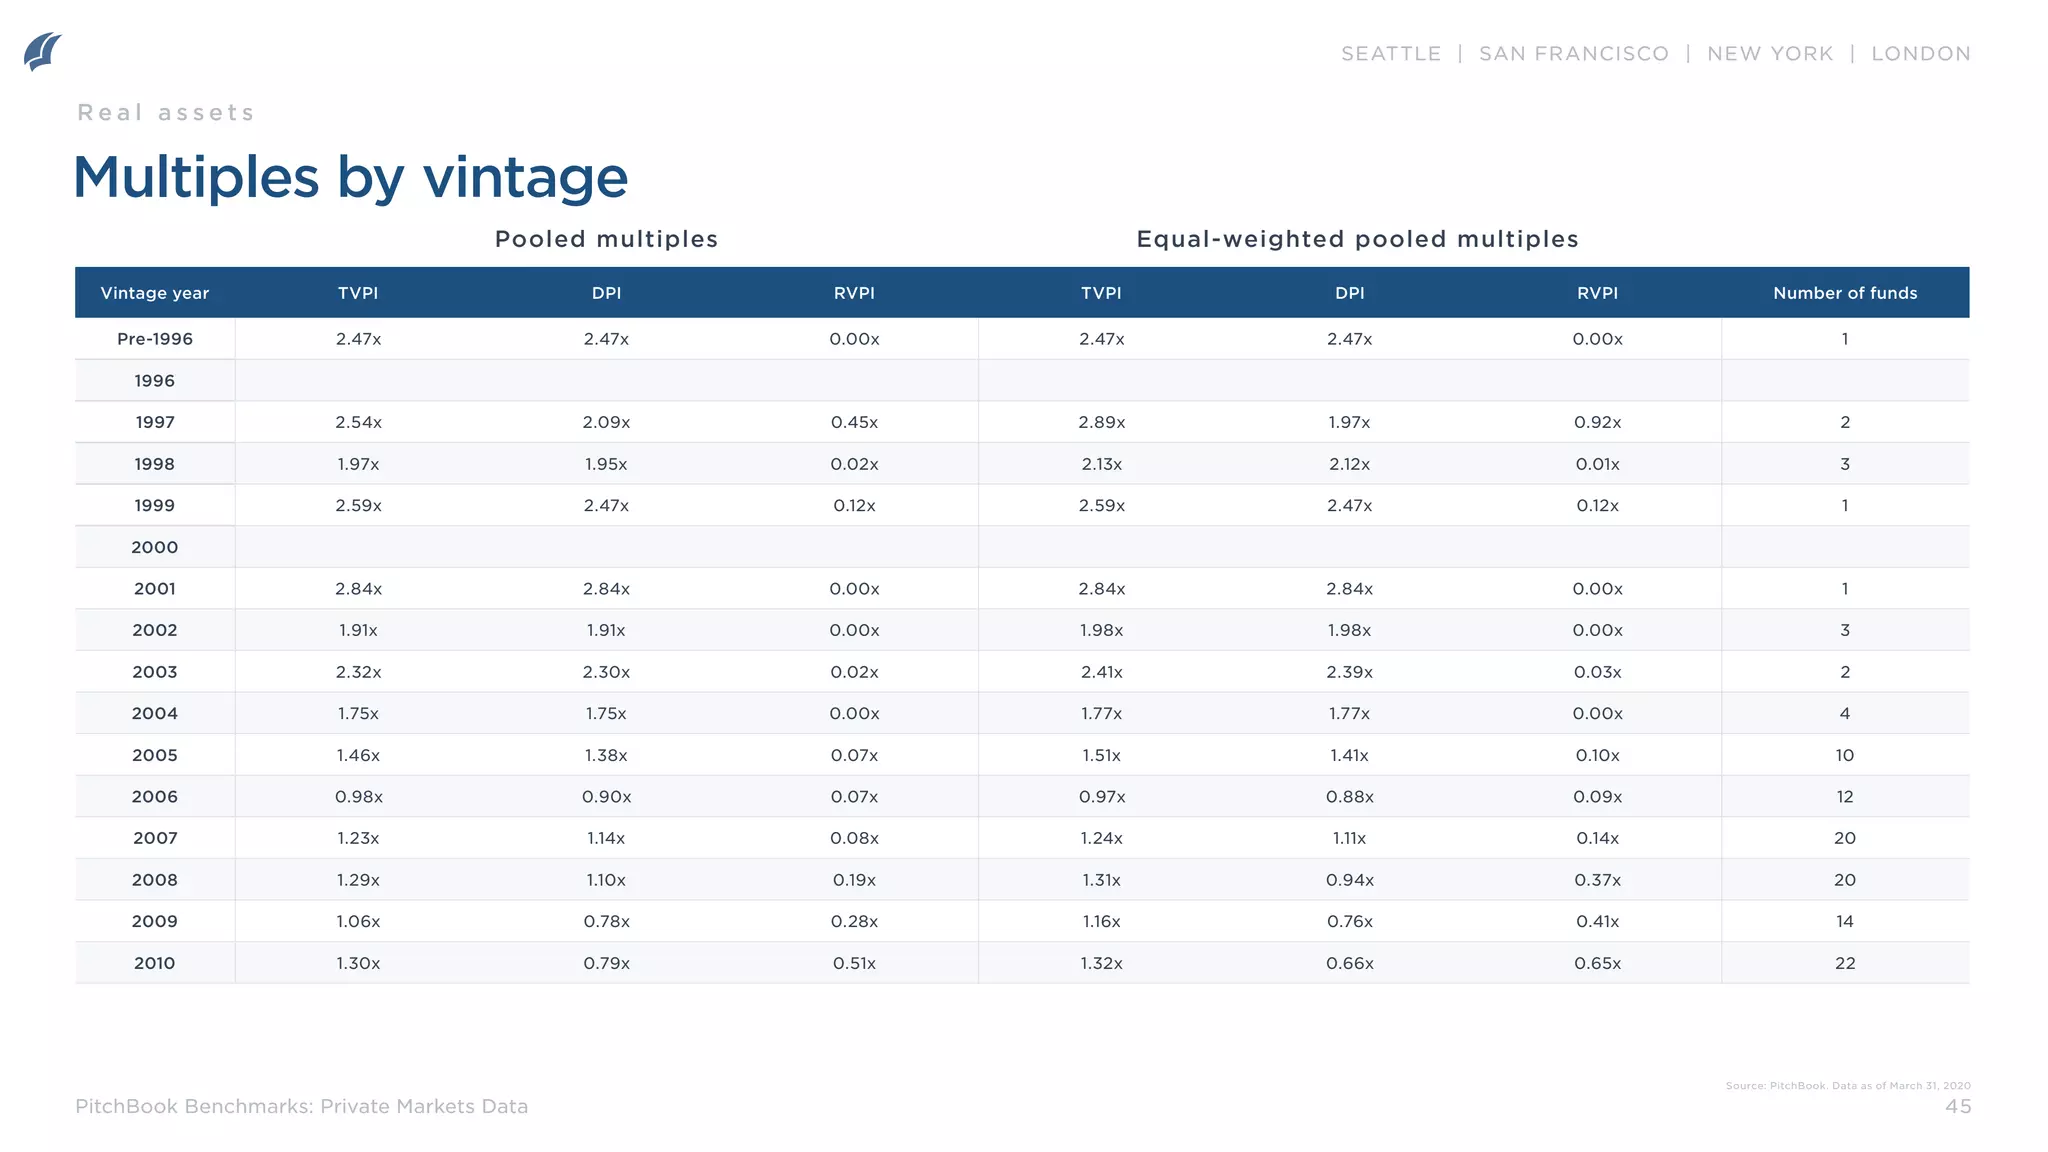
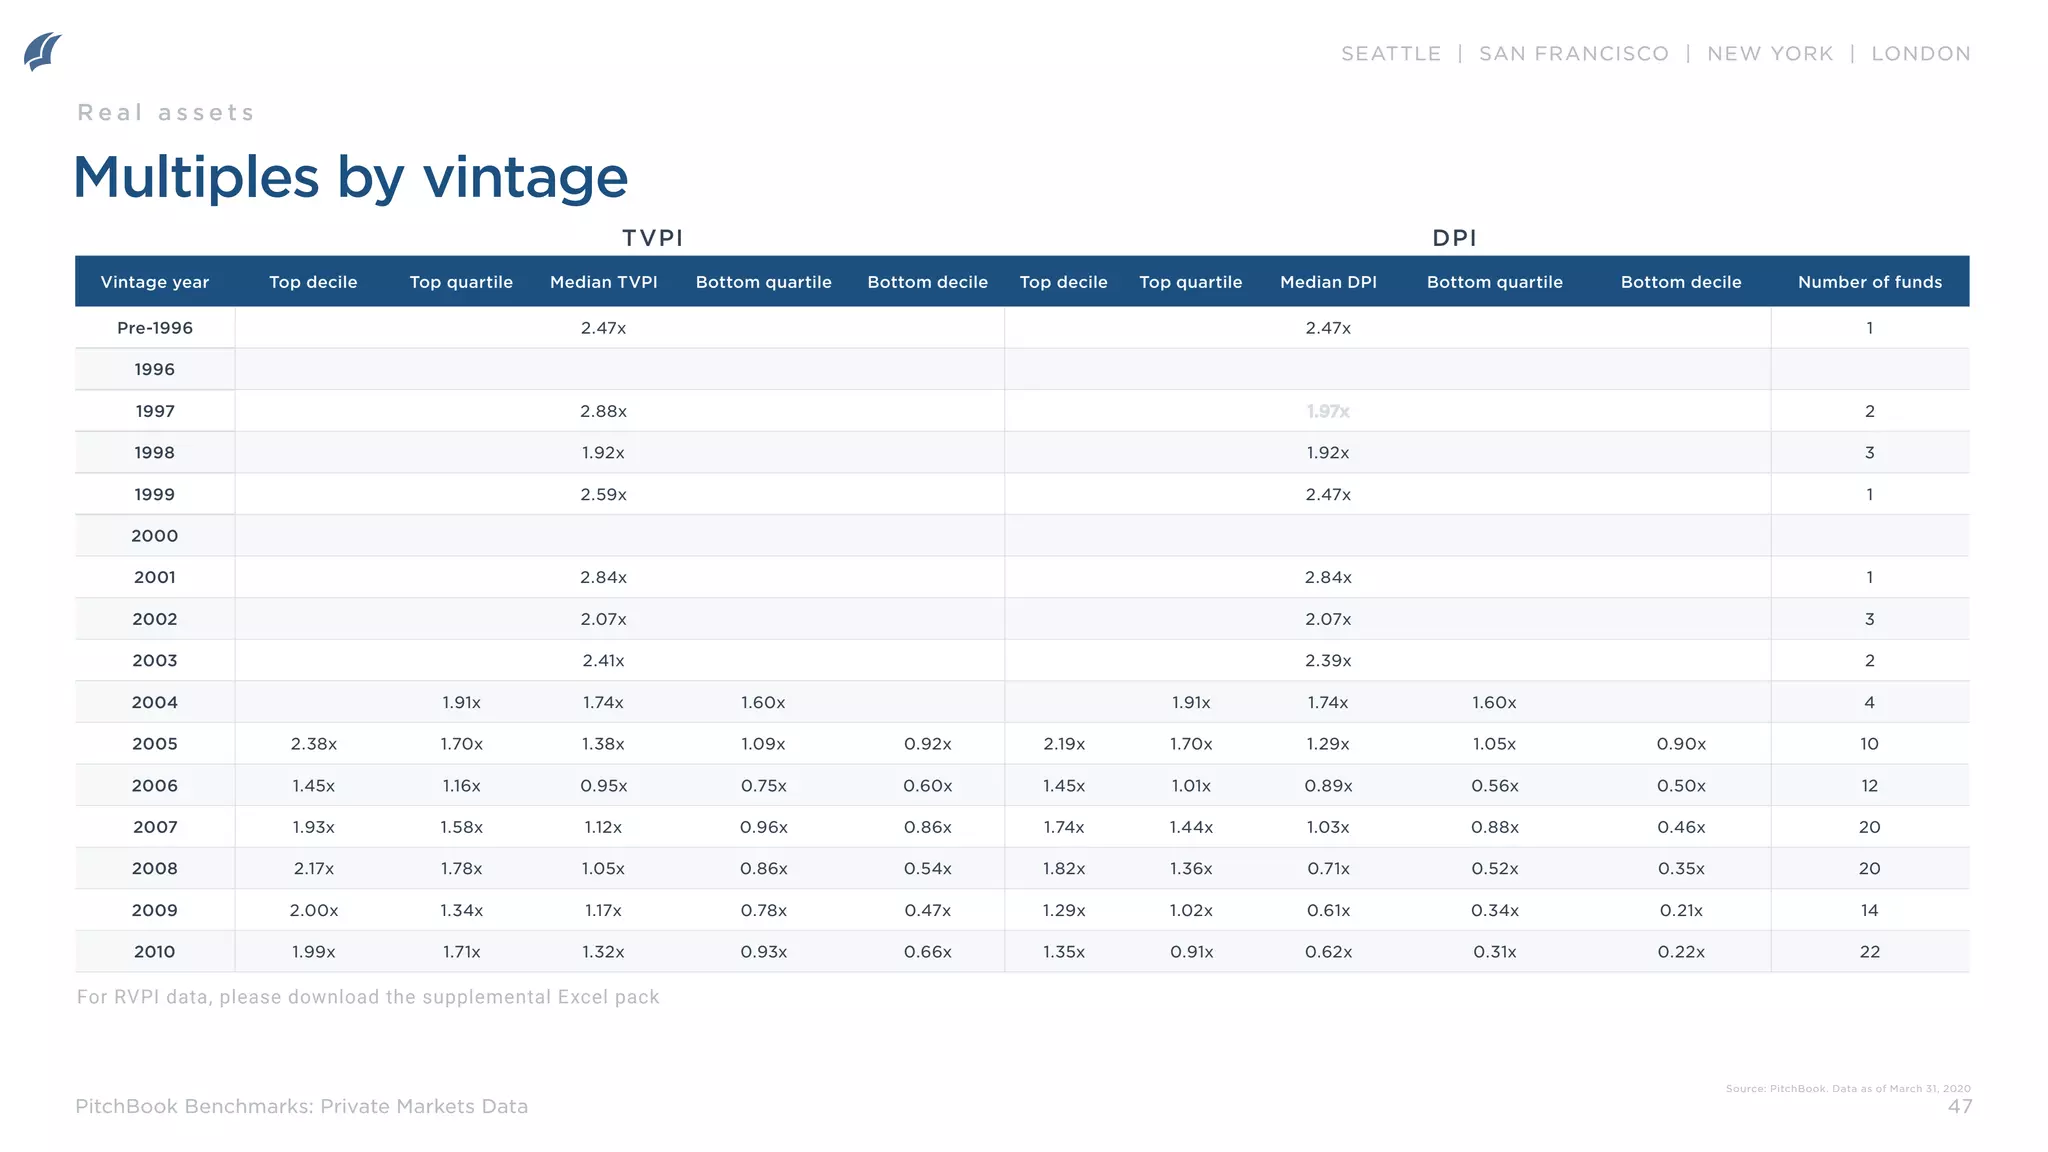
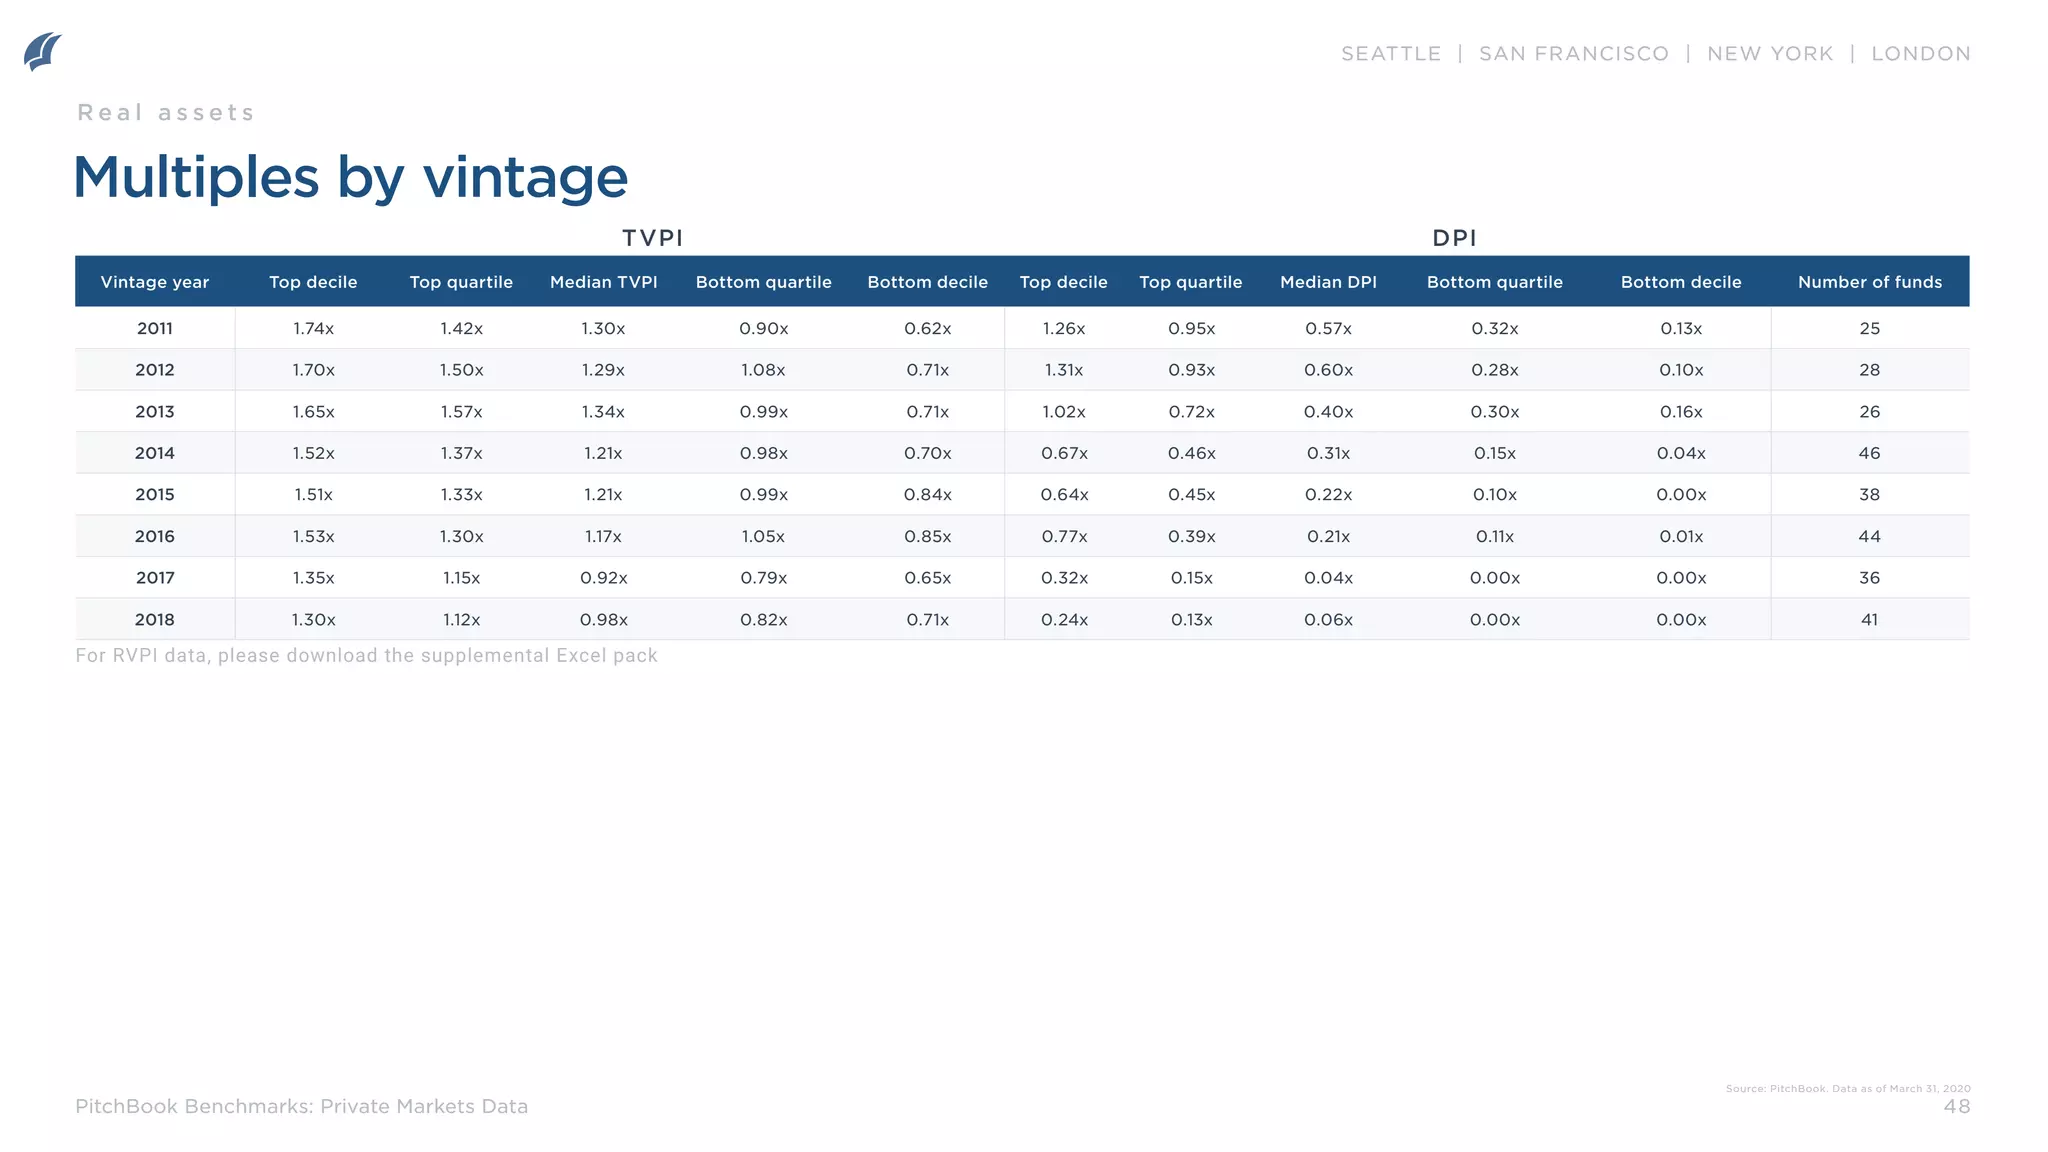
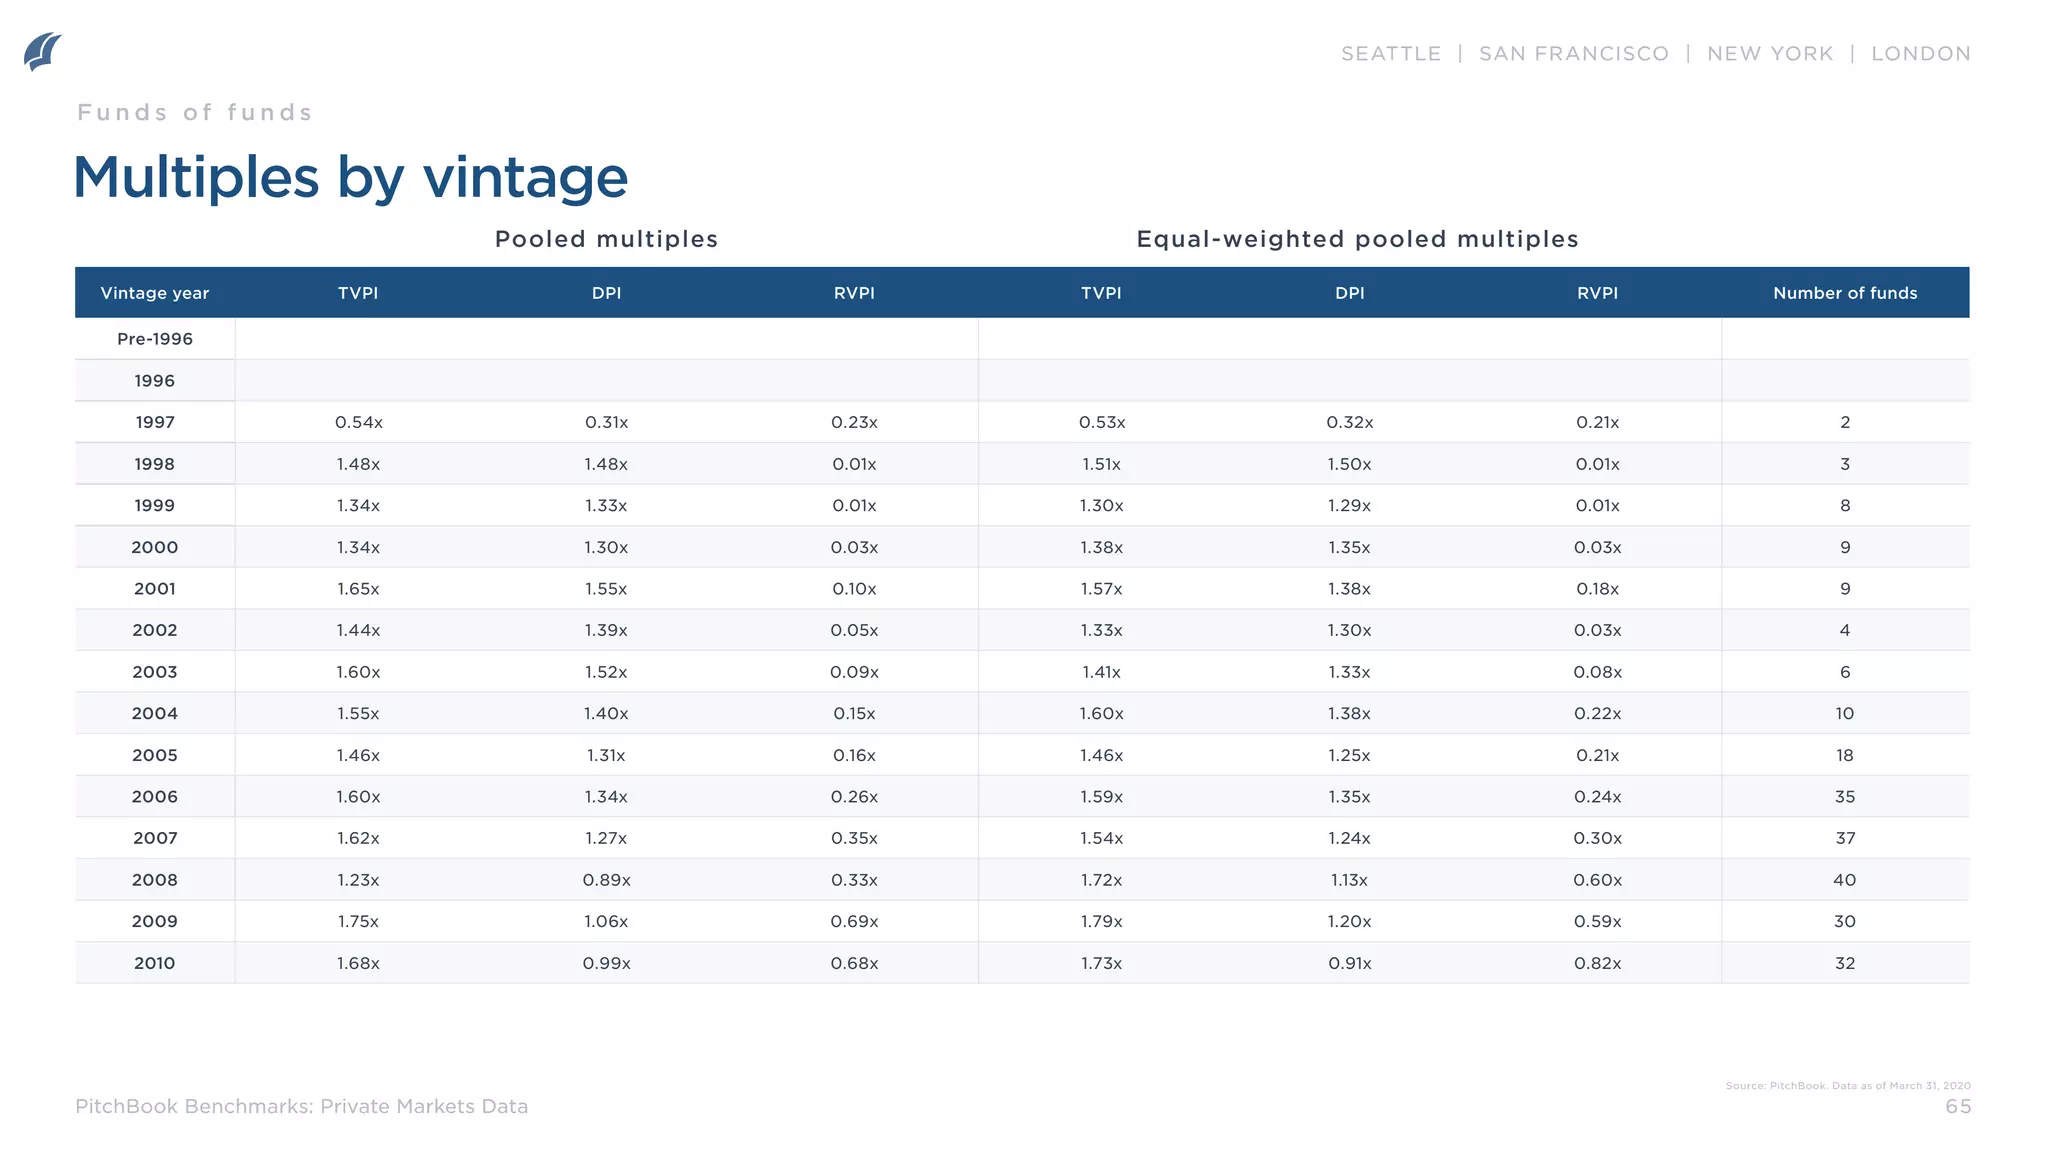
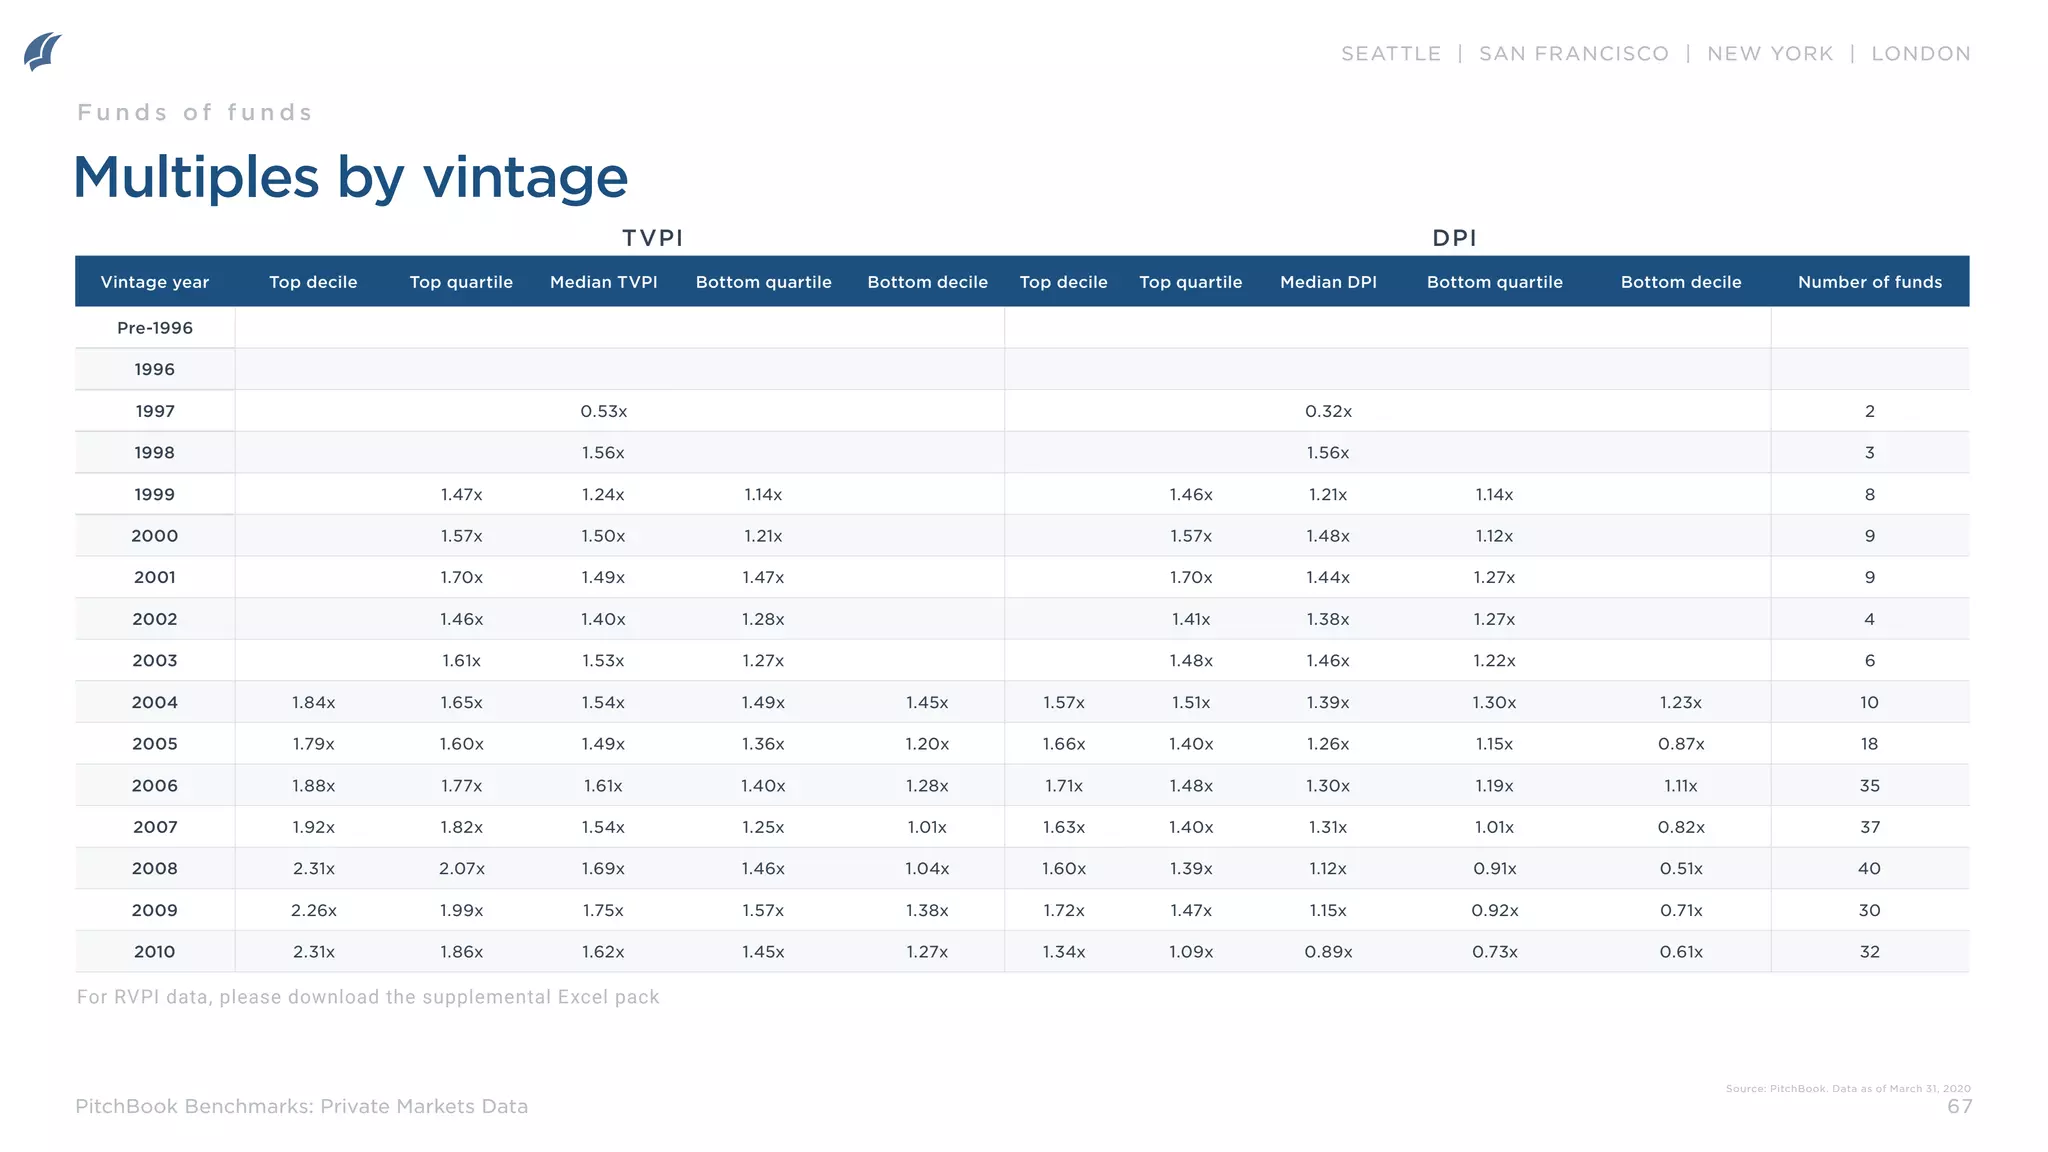
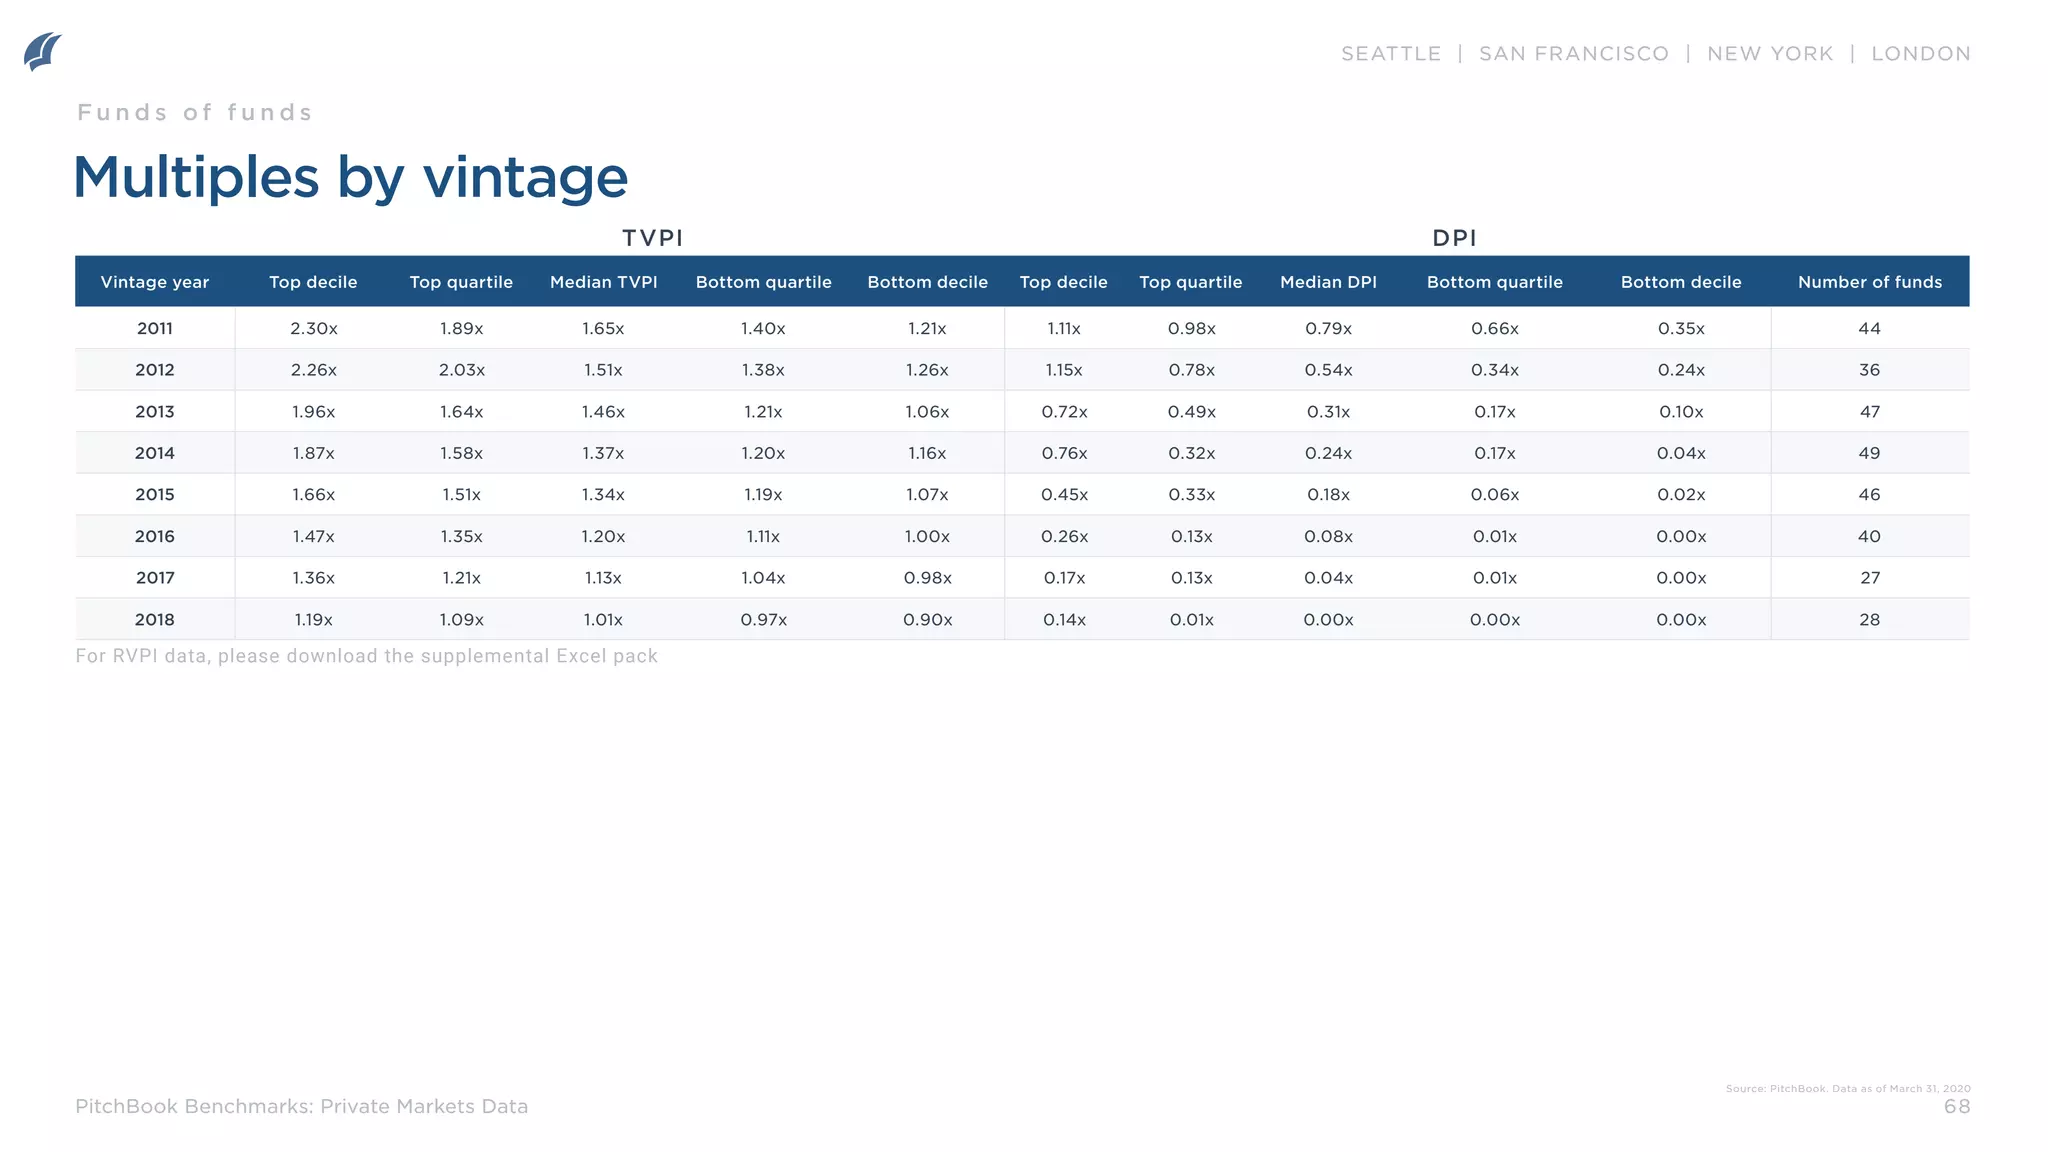
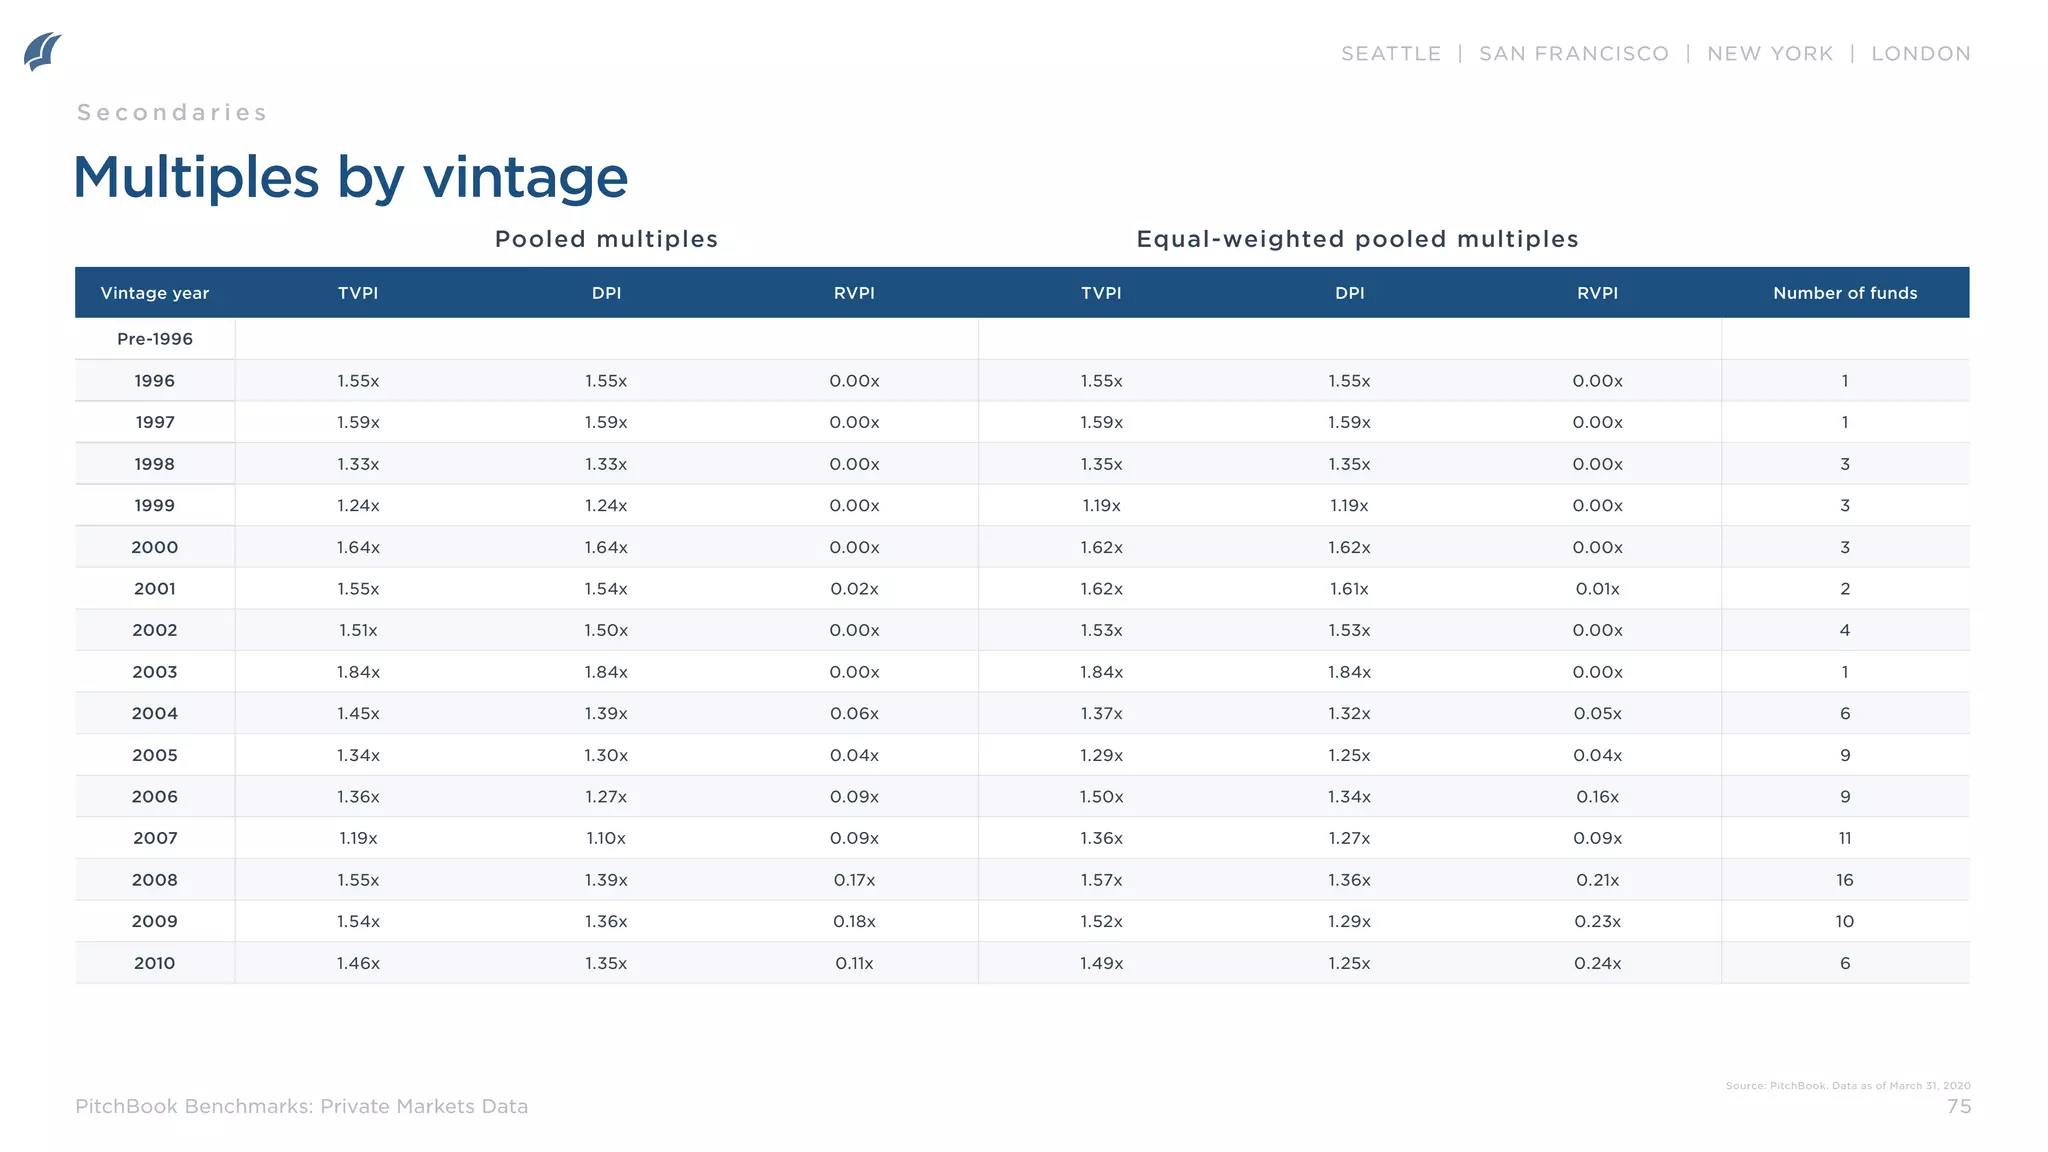
Distributions to paid-in (DPI) multiple: A measurement of the capital that has been distributed back to LPs as a proportion
of the total paid-in, or contributed, capital. DPI is also known as the cash-on-cash multiple or the realization multiple.
Remaining value to paid-in (RVPI) multiple: A measurement of the unrealized return of a fund as a proportion of the total
paid-in, or contributed, capital.
Total value to paid-in (TVPI) multiple: A measurement of both the realized and unrealized value of a fund as a proportion
of the total paid-in, or contributed, capital. Also known as the investment multiple, TVPI can be found by adding together
the DPI and RVPI of a fund.
Pooled calculations: Pooled calculations combine cashflow data from a group of funds to create a capital-weighted IRR
value. All cash flows and NAVs for each fund in the sample group (e.g. all private capital funds, 2004 vintage VC funds,
etc.) are aggregated in the calculation. For vintage-specific calculations, we begin the calculation in Q1 of the vintage year,
regardless of which quarter a fund first called capital. In cases where the sample has unrealized value, the ending NAV is
treated as a cash outflow in the last reporting period.
Equal-weighted pooled calculations: Using the same methodology as the pooled calculations, the equal-weighted version
expresses each fund’s cash flows and ending NAV as a ratio of fund size. The result is that each fund in these calculations
has an equal impact on the output, regardless of the fund size.
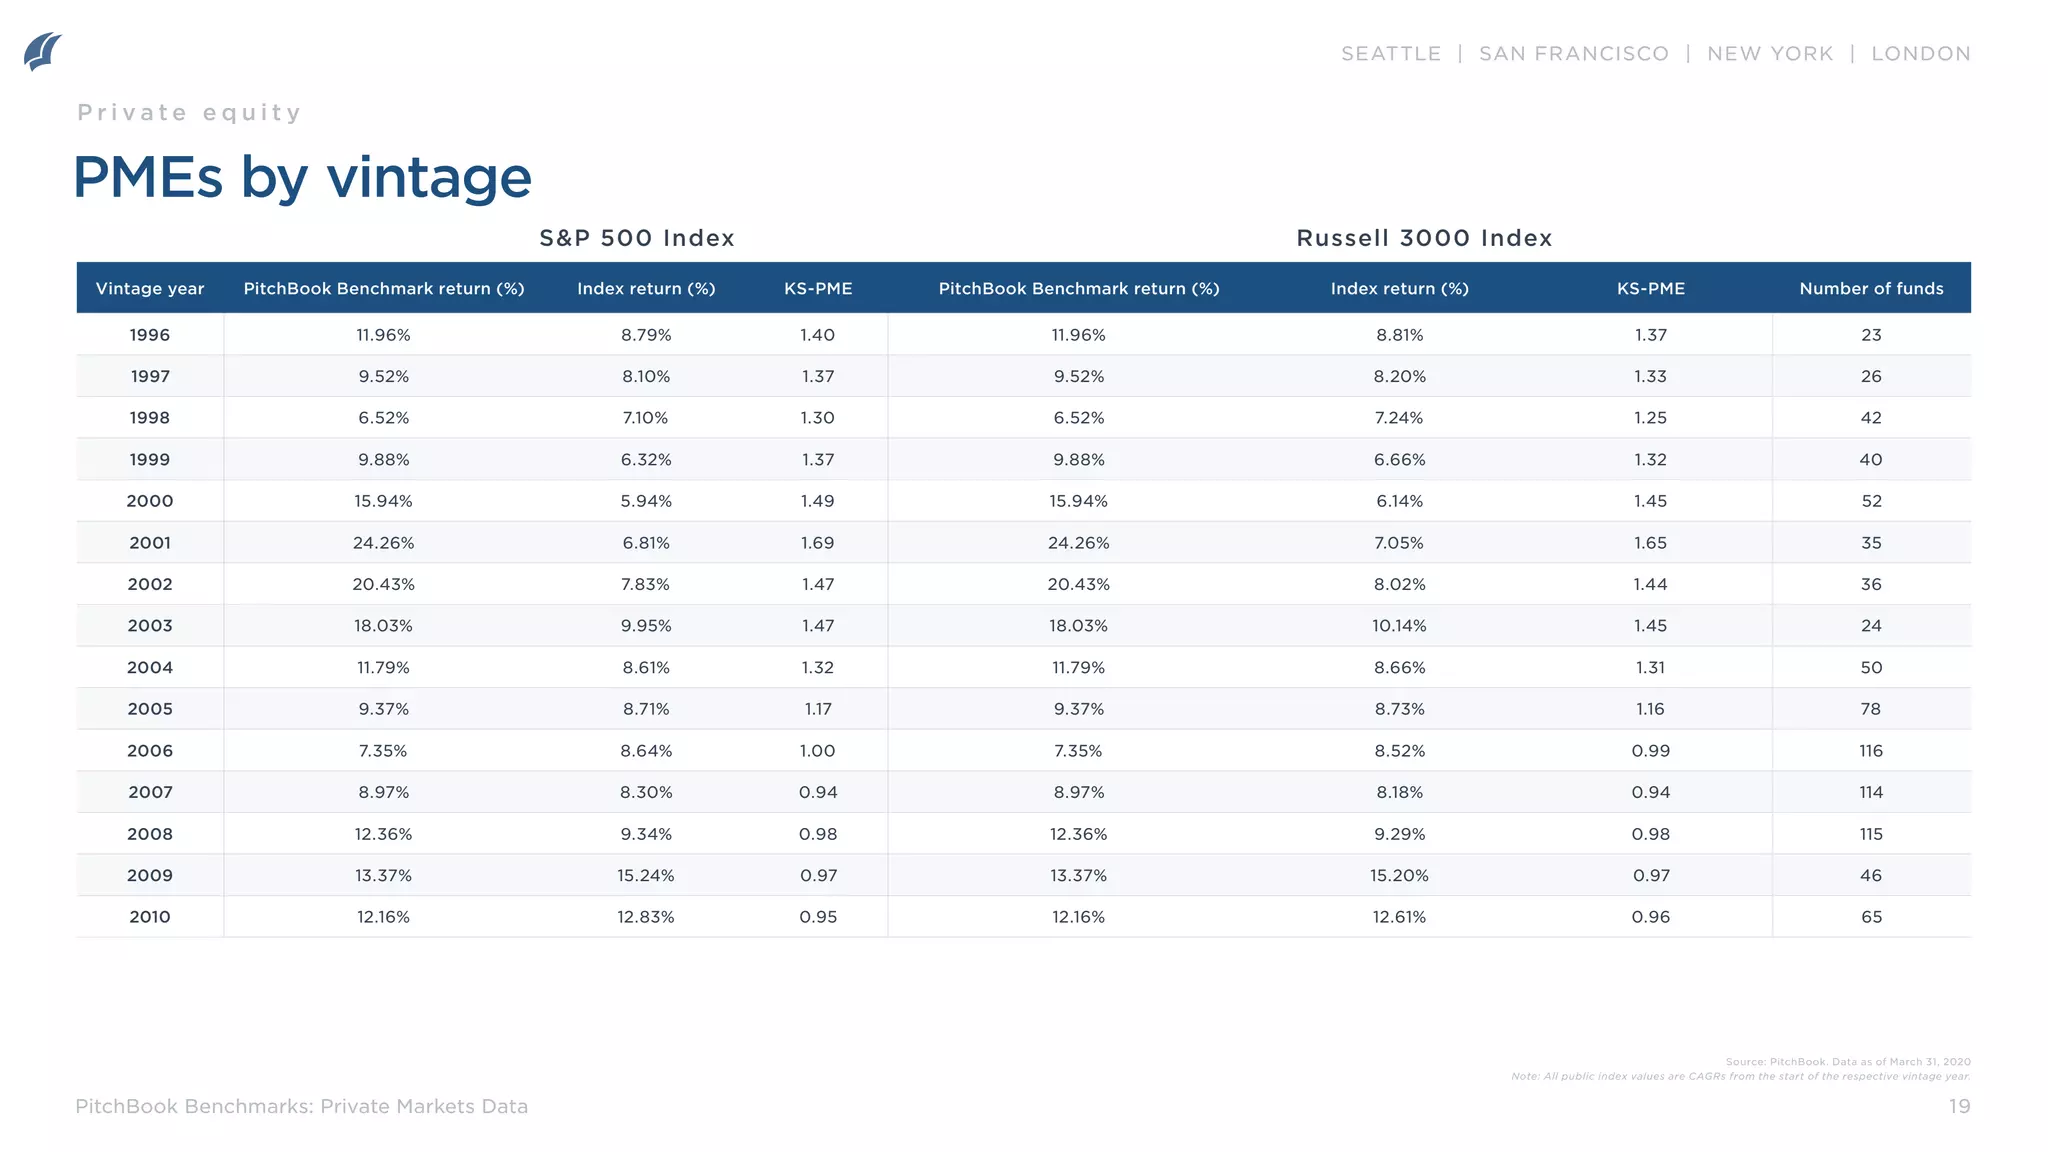
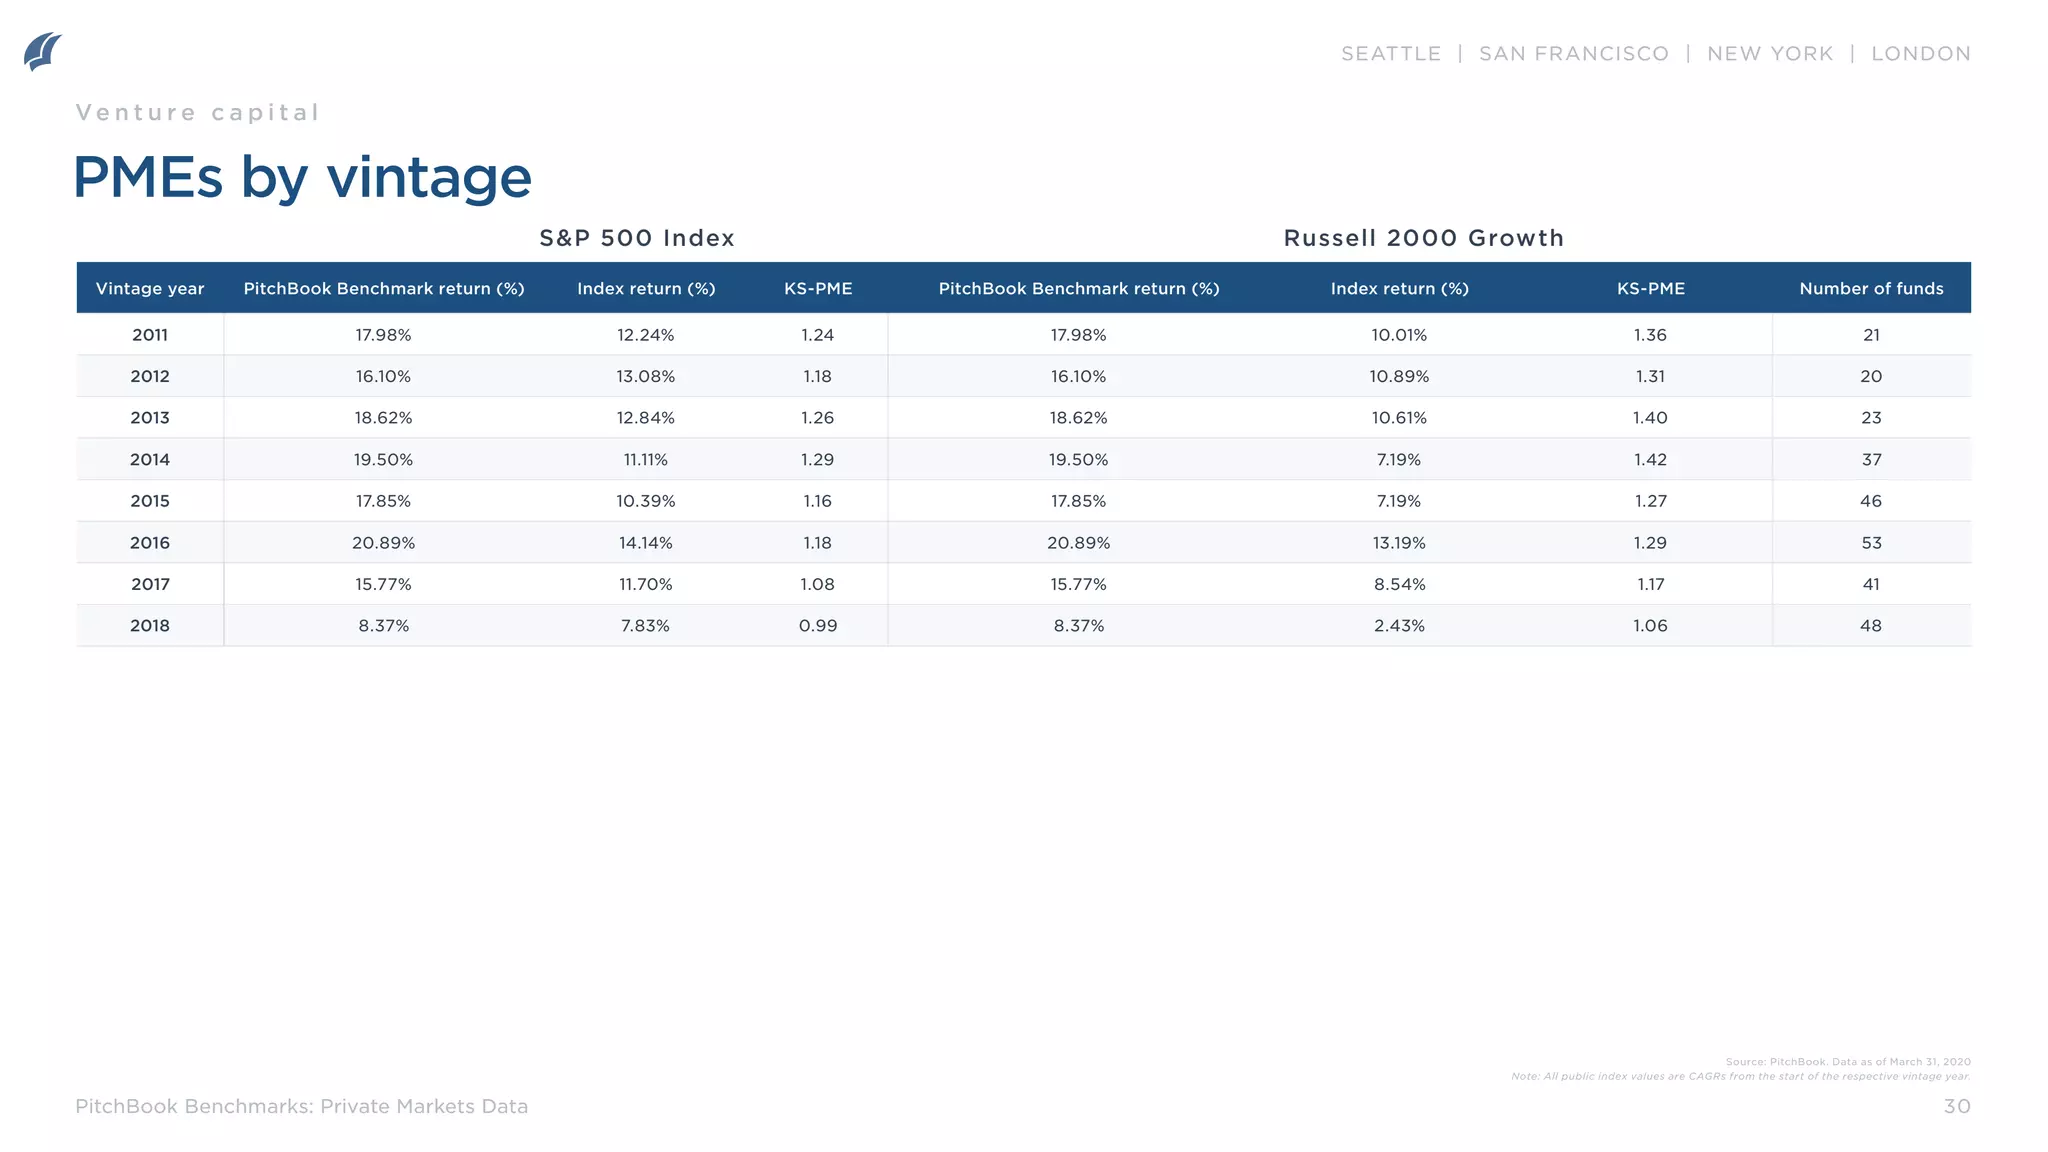
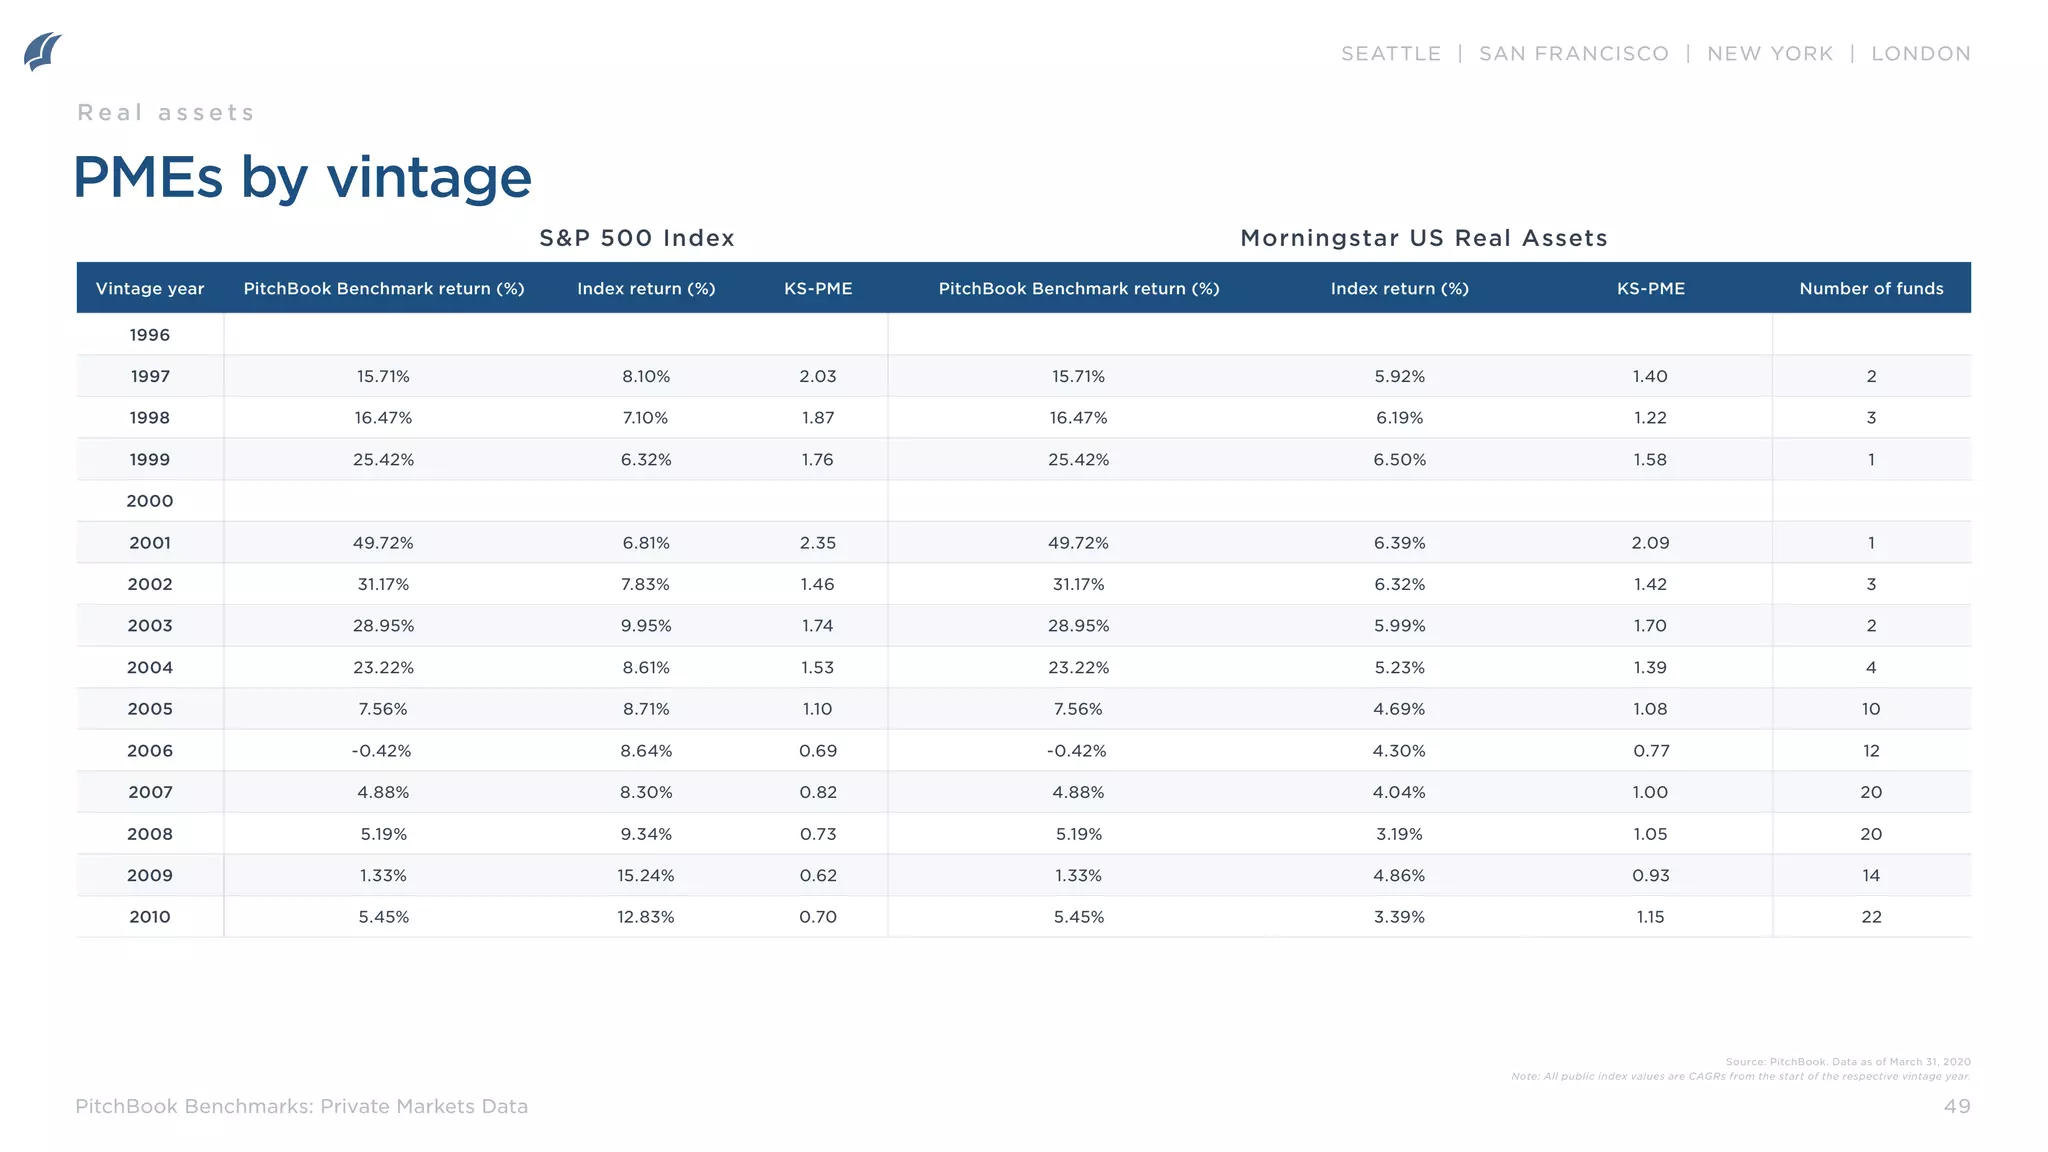
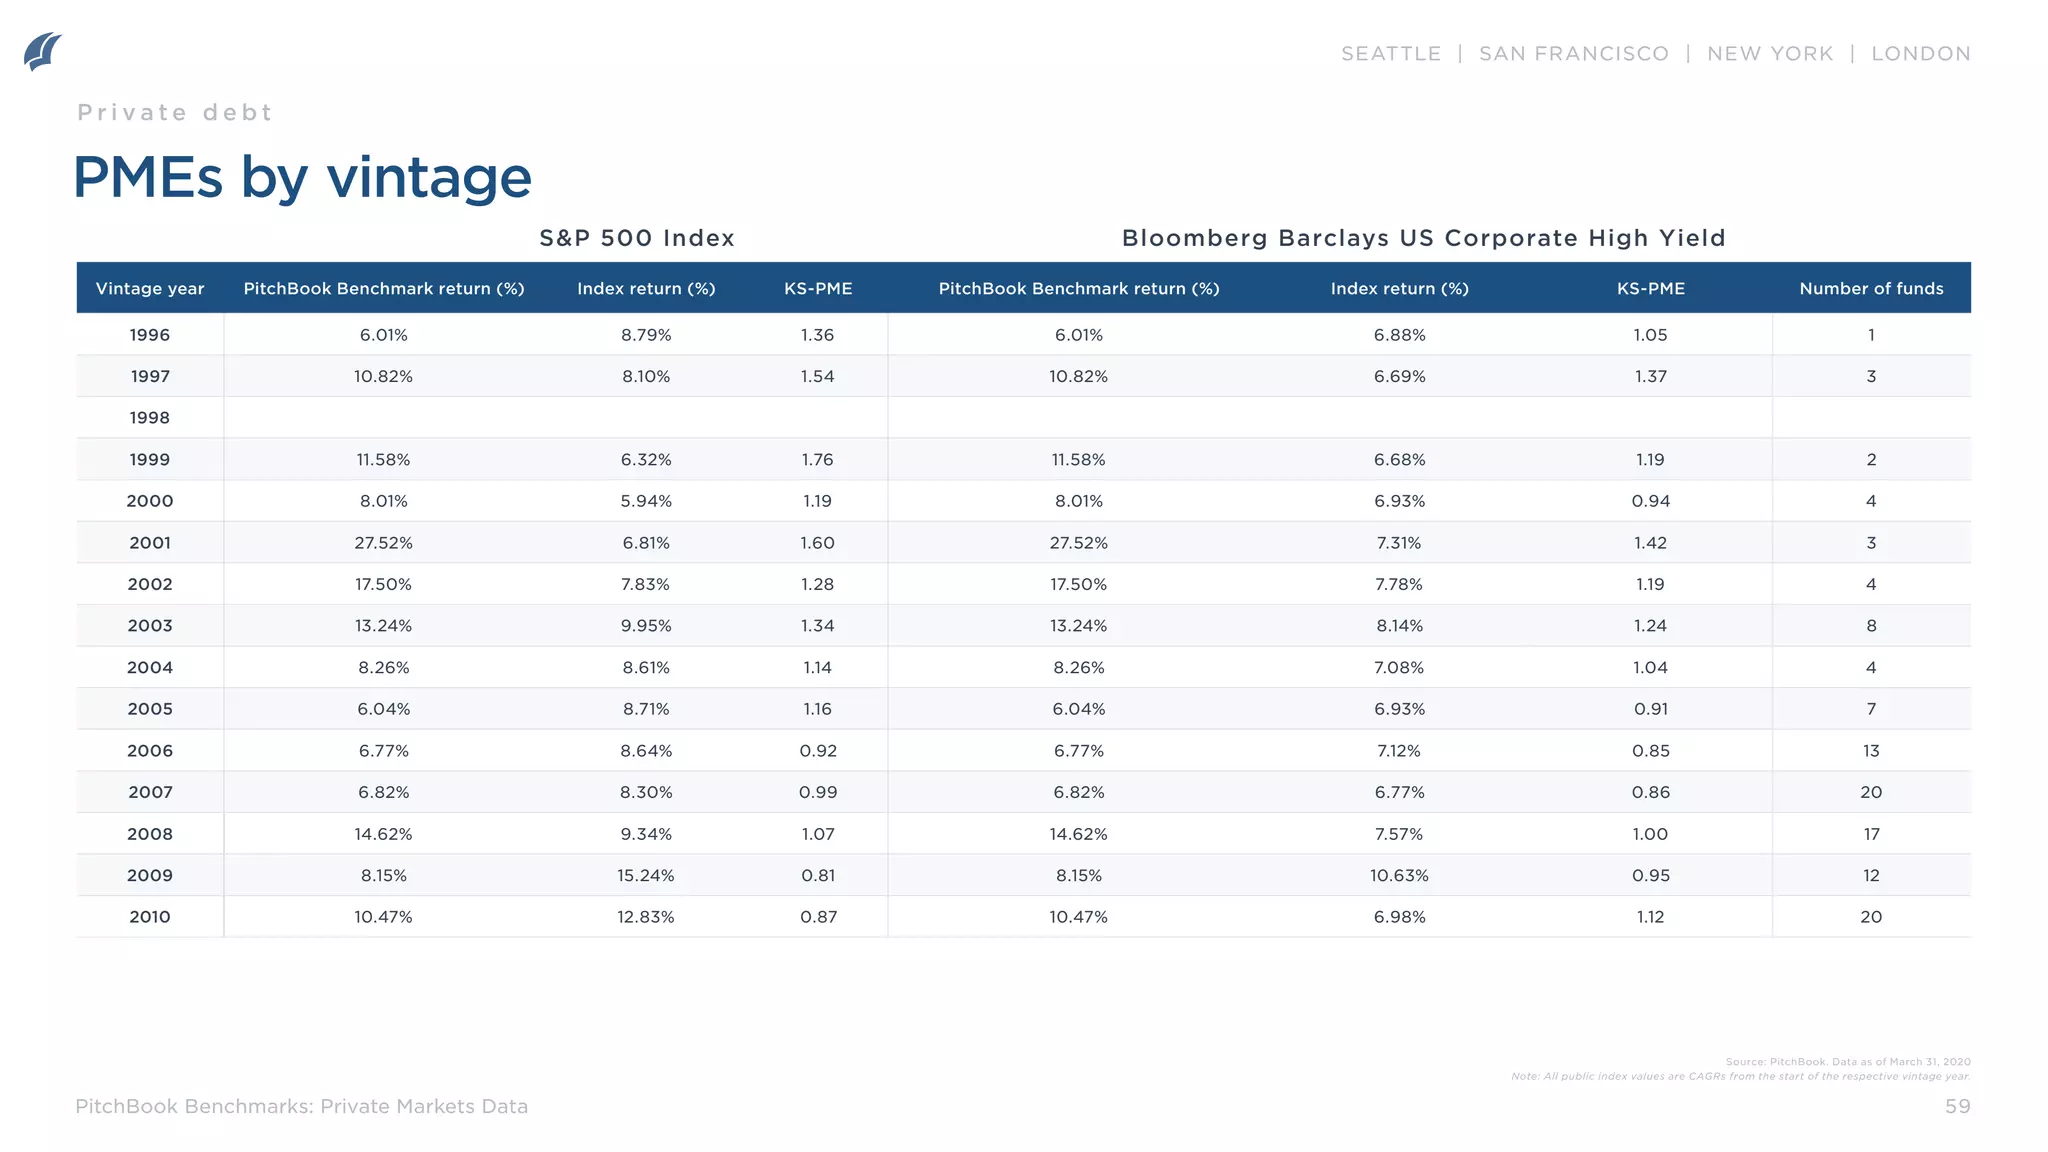
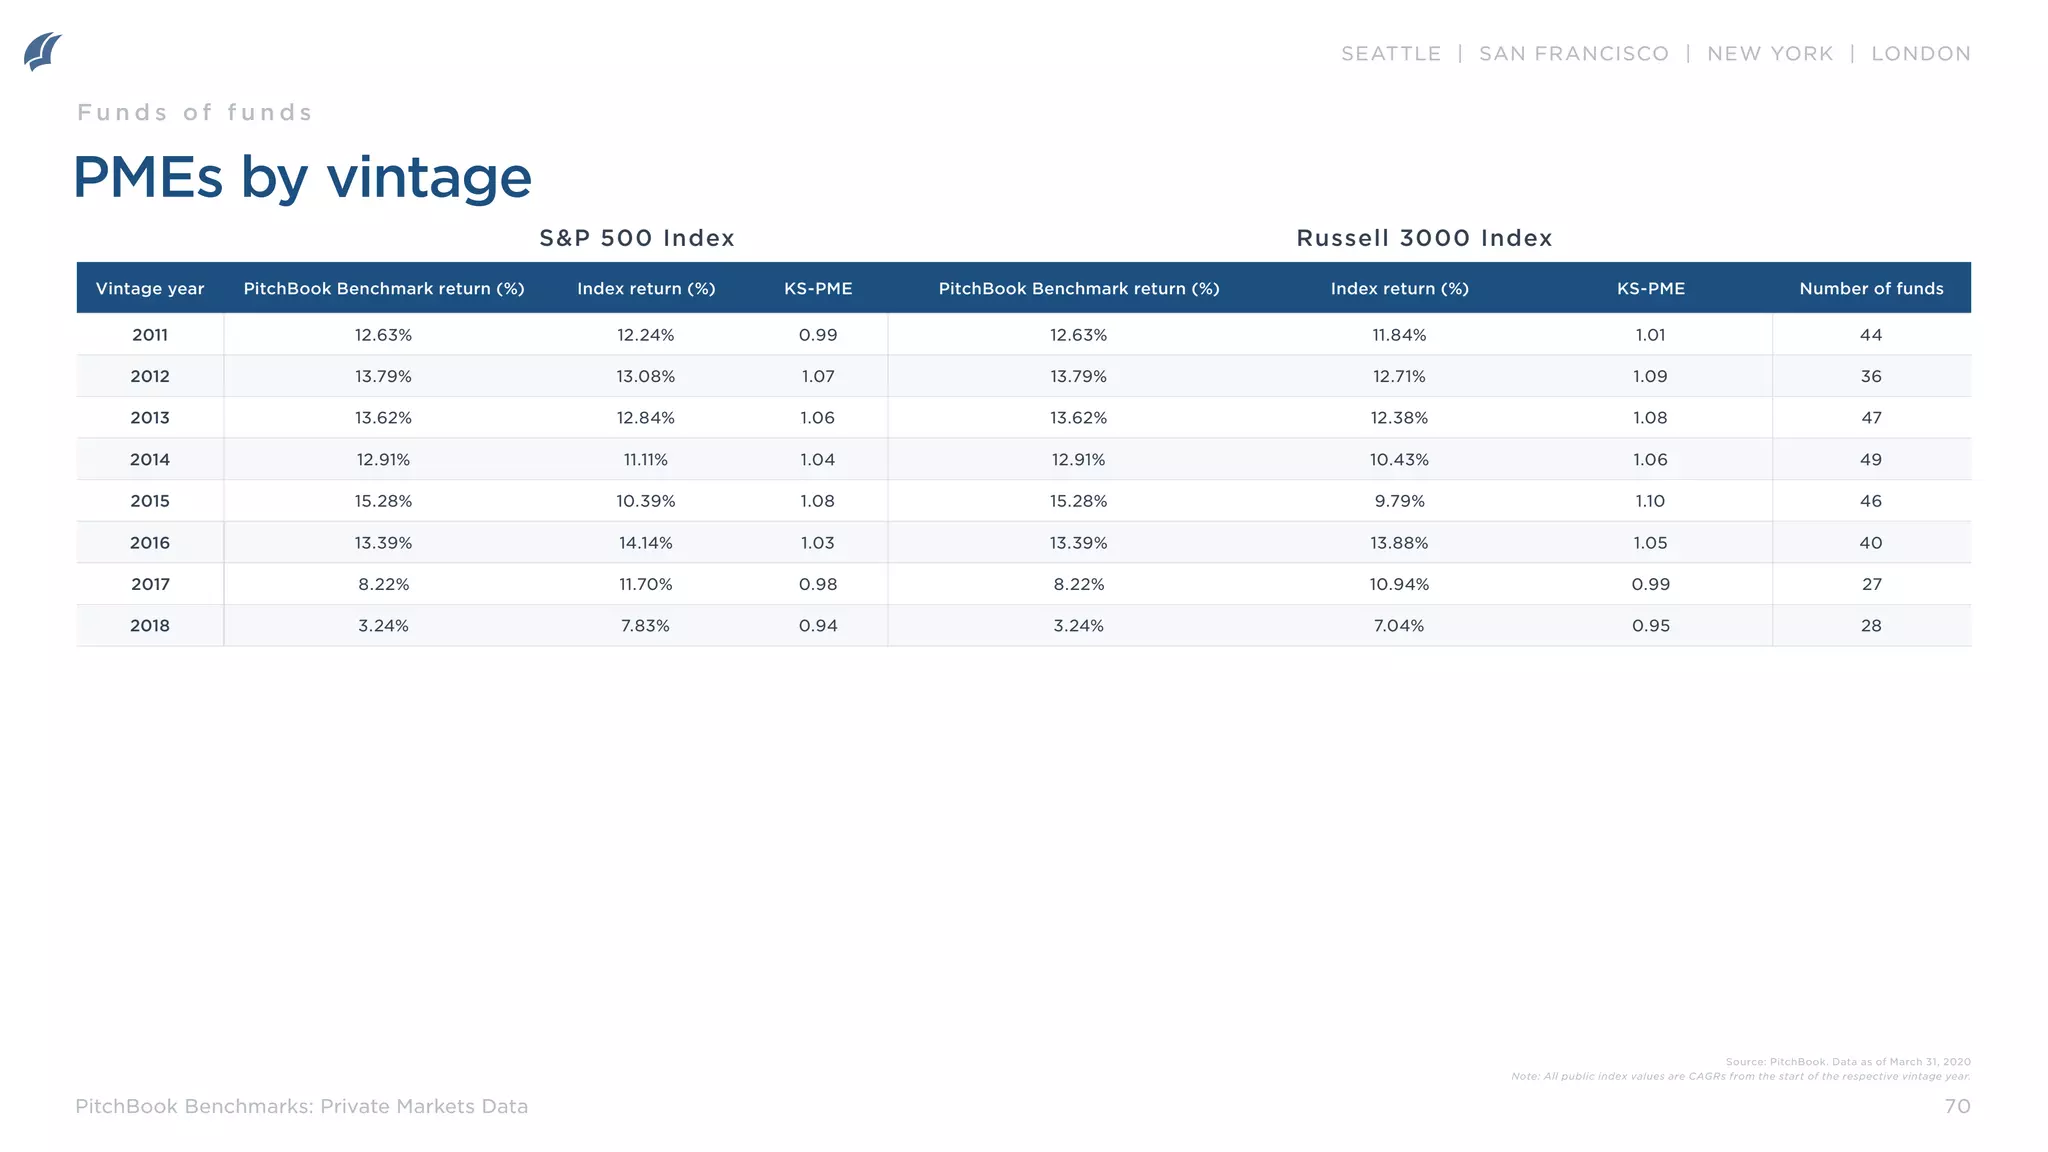
Public market equivalent (PME) calculations: PME metrics benchmark the performance of a fund (or group of funds)
against an index. A white paper detailing the calculations and methodology behind the PME benchmarks can be found
at pitchbook.com. PitchBook News & Analysis also contains several articles with PME benchmarks and analysis. All PME
figures are calculated using the Kaplan-Schoar PME method:
When using a KS-PME, a value greater than 1.0 implies outperformance of the fund over the public index (net of all fees).
Quarterly
percentage
change
NAV at end of quarter + distributions during the quarter - contributions during
the quarter
NAV at the beginning of the quarter
]
] - 1](https://image.slidesharecdn.com/pitchbookbenchmarksasofq12020withpreliminaryq22020data-230810161518-9cf2b44f/75/PitchBook_Benchmarks_as_of_Q1_2020_with_preliminary_Q2_2020_data-pdf-4-2048.jpg)