An affordable
⚡ electricvehicle charging
solution for multi-unit properties
SEED ROUND
Nicholas Johnson
6.27.22
www.orangecharger.com
2.
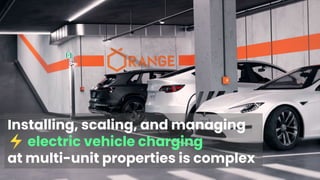
Installing, scaling, andmanaging
⚡ electric vehicle charging
at multi-unit properties is complex
3.
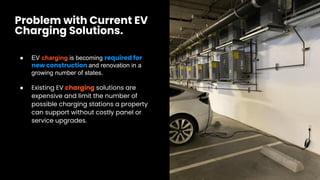
● EV chargingis becoming required for
new construction and renovation in a
growing number of states.
● Existing EV charging solutions are
expensive and limit the number of
possible charging stations a property
can support without costly panel or
service upgrades.
Problem with Current EV
Charging Solutions.
4.
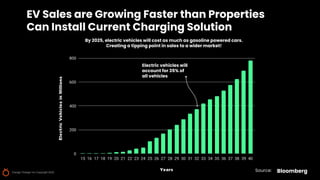
EV Sales areGrowing Faster than Properties
Can Install Current Charging Solution
Source: Bloomberg
By 2025, electric vehicles will cost as much as gasoline powered cars.
Creating a tipping point in sales to a wider market!
Electric vehicles will
account for 35% of
all vehicles
Orange Charger Inc Copyright 2022
5.
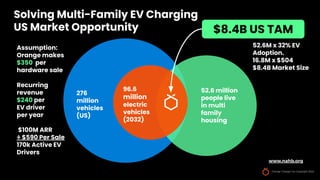
276
million
vehicles
(US)
Solving Multi-Family EVCharging
US Market Opportunity
52.6 million
people live
in multi
family
housing
$8.4B US TAM
www.nahb.org
96.6
million
electric
vehicles
(2032)
Assumption:
Orange makes
$350 per
hardware sale
Recurring
revenue
$240 per
EV driver
per year
$100M ARR
÷ $590 Per Sale
170k Active EV
Drivers
52.6M x 32% EV
Adoption.
16.8M x $504
$8.4B Market Size
Orange Charger Inc Copyright 2022
6.
Orange Charger IncCopyright 2022
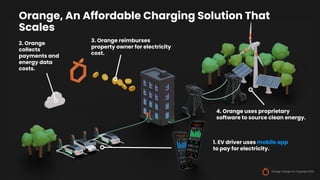
Orange, An Affordable Charging Solution That
Scales
1. EV driver uses mobile app
to pay for electricity.
2. Orange
collects
payments and
energy data
costs.
3. Orange reimburses
property owner for electricity
cost.
4. Orange uses proprietary
software to source clean energy.
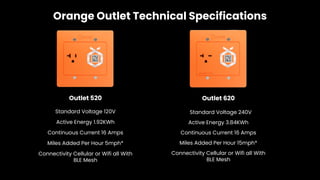
Orange Outlet TechnicalSpecifications
Outlet 520 Outlet 620
Standard Voltage 120V
Active Energy 1.92KWh
Continuous Current 16 Amps
Connectivity Cellular or Wifi all With
BLE Mesh
Miles Added Per Hour 5mph*
Standard Voltage 240V
Active Energy 3.84KWh
Continuous Current 16 Amps
Connectivity Cellular or Wifi all With
BLE Mesh
Miles Added Per Hour 15mph*
9.
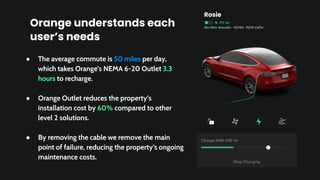
Orange understands each
user’sneeds
● The average commute is 50 miles per day,
which takes Orange’s NEMA 6-20 Outlet 3.3
hours to recharge.
● Orange Outlet reduces the property’s
installation cost by 60% compared to other
level 2 solutions.
● By removing the cable we remove the main
point of failure, reducing the property’s ongoing
maintenance costs.
2hr 25m Remain · 16/16A · 15/15 mi/hr
Rosie
10.
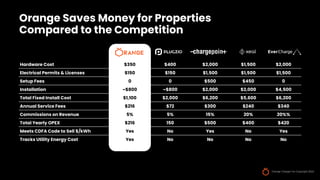
Orange Charger IncCopyright 2022
Orange Saves Money for Properties
Compared to the Competition
Hardware Cost $350 $400 $2,000 $1,500 $2,000
Electrical Permits & Licenses $150 $150 $1,500 $1,500 $1,500
Setup Fees 0 0 $500 $450 0
Installation ~$800 ~$800 $2,000 $2,000 $4,500
Total Fixed Install Cost $1,100 $2,000 $6,200 $5,600 $6,200
Annual Service Fees $216 $72 $300 $240 $340
Commissions on Revenue 5% 5% 15% 20% 20%%
Total Yearly OPEX $216 150 $500 $400 $420
Meets CDFA Code to Sell $/kWh Yes No Yes No Yes
Tracks Utility Energy Cost Yes No No No No
11.
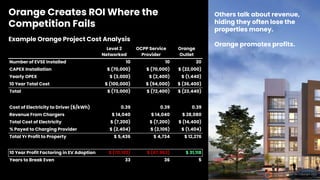
Orange Creates ROIWhere the
Competition Fails
Others talk about revenue,
hiding they often lose the
properties money.
Orange promotes profits.
Orange Charger Inc Copyright 2022
Example Orange Project Cost Analysis
Level 2
Networked
OCPP Service
Provider
Orange
Outlet
Number of EVSE Installed 10 10 20
CAPEX Installation $ (70,000) $ (70,000) $ (22,000)
Yearly OPEX $ (3,000) $ (2,400) $ (1,440)
10 Year Total Cost $ (100,000) $ (94,000) $ (36,400)
Total $ (73,000) $ (72,400) $ (23,440)
Cost of Electricity to Driver ($/kWh) 0.39 0.39 0.39
Revenue From Chargers $ 14,040 $ 14,040 $ 28,080
Total Cost of Electricity $ (7,200) $ (7,200) $ (14,400)
% Payed to Charging Provider $ (2,404) $ (2,106) $ (1,404)
Total Yr Profit to Property $ 5,436 $ 4,734 $ 12,276
10 Year Profit Factoring in EV Adoption $ (70,102) $ (67,963) $ 31,118
Years to Break Even 33 36 5
12.
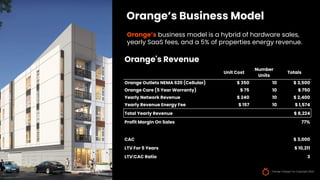
Orange Charger IncCopyright 2022
Orange’s Business Model
Orange’s business model is a hybrid of hardware sales,
yearly SaaS fees, and a 5% of properties energy revenue.
Orange's Revenue
Unit Cost
Number
Units
Totals
Orange Outlets NEMA 620 (Cellular) $ 350 10 $ 3,500
Orange Care (5 Year Warranty) $ 75 10 $ 750
Yearly Network Revenue $ 240 10 $ 2,400
Yearly Revenue Energy Fee $ 157 10 $ 1,574
Total Yearly Revenue $ 8,224
Profit Margin On Sales 77%
CAC $ 3,000
LTV For 5 Years $ 10,211
LTV:CAC Ratio 3
13.
Orange Charger IncCopyright 2022
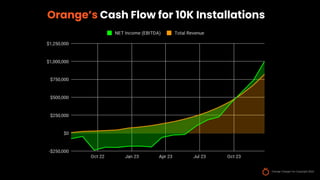
Orange’s Cash Flow for 10K Installations
14.
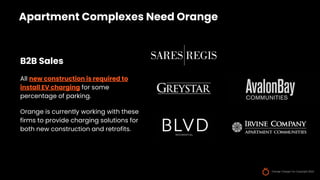
Apartment Complexes NeedOrange
B2B Sales
All new construction is required to
install EV charging for some
percentage of parking.
Orange is currently working with these
firms to provide charging solutions for
both new construction and retrofits.
Orange Charger Inc Copyright 2022
15.
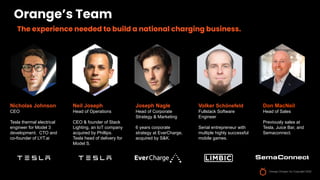
Orange’s Team
Nicholas Johnson
CEO
Teslathermal electrical
engineer for Model 3
development. CTO and
co-founder of LYT.ai
Don MacNeil
Head of Sales
Previously sales at
Tesla, Juice Bar, and
Semaconnect.
The experience needed to build a national charging business.
Joseph Nagle
Head of Corporate
Strategy & Marketing
6 years corporate
strategy at EverCharge,
acquired by S&K.
Neil Joseph
Head of Operations
CEO & founder of Stack
Lighting, an IoT company
acquired by Phillips.
Tesla head of delivery for
Model S.
Volker Schönefeld
Fullstack Software
Engineer
Serial entrepreneur with
multiple highly successful
mobile games.
Orange Charger Inc Copyright 2022
16.
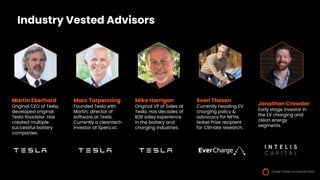
Industry Vested Advisors
MartinEberhard
Original CEO of Tesla,
developed original
Tesla Roadster. Has
created multiple
successful battery
companies.
Marc Tarpenning
Founded Tesla with
Martin; director of
software at Tesla.
Currently a cleantech
investor at Spero.vc.
Sven Thesen
Currently heading EV
charging policy &
advocacy for MFHs.
Nobel Prize recipient
for Climate research.
Mike Harrigan
Original VP of Sales at
Tesla. Has decades of
B2B sales experience
in the battery and
charging industries.
Orange Charger Inc Copyright 2022
Jonathan Crowder
Early stage investor in
the EV charging and
clean energy
segments.
17.
Orange Charger IncCopyright 2022
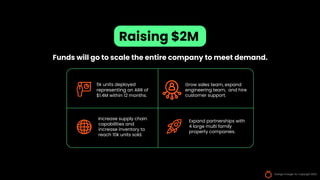
Raising $2M
Expand partnerships with
4 large multi family
property companies.
Increase supply chain
capabilities and
increase inventory to
reach 10k units sold.
Grow sales team, expand
engineering team, and hire
customer support.
Funds will go to scale the entire company to meet demand.
5k units deployed
representing an ARR of
$1.4M within 12 months.
18.
Orange Charger IncCopyright 2021
Nicholas Johnson
nicholas@orangecharger.com
+1 (415) 302-5909
Thank You
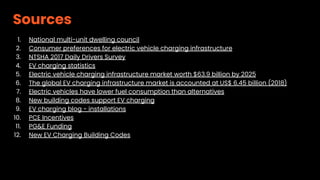
Sources
1. National multi-unitdwelling council
2. Consumer preferences for electric vehicle charging infrastructure
3. NTSHA 2017 Daily Drivers Survey
4. EV charging statistics
5. Electric vehicle charging infrastructure market worth $63.9 billion by 2025
6. The global EV charging infrastructure market is accounted at US$ 6.45 billion (2018)
7. Electric vehicles have lower fuel consumption than alternatives
8. New building codes support EV charging
9. EV charging blog - installations
10. PCE Incentives
11. PG&E Funding
12. New EV Charging Building Codes