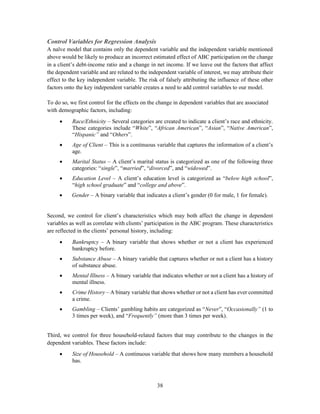
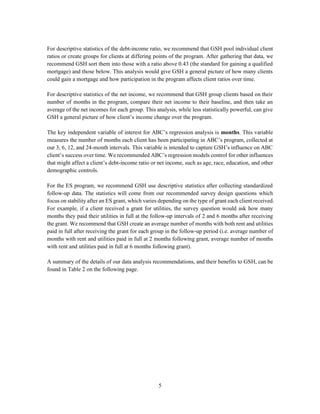
This report provides recommendations for evaluating the effectiveness of Good Shepherd Housing's
(GSH) Apartments Budgeting Counseling (ABC) and Emergency Services (ES) programs in
supporting client self-sufficiency. For ABC, the report recommends measuring debt-income ratio
and change in net income using surveys administered every 3-6 months and regression analysis. For
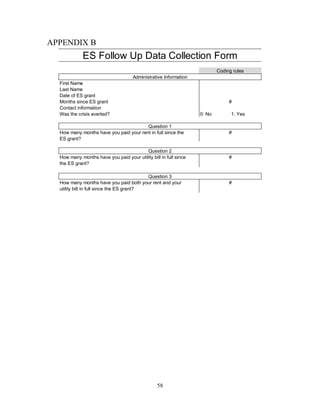
ES, it recommends measuring housing stability using a text message survey 2 and 6 months after
grants and descriptive statistics. The report is based on a literature review and analysis of GSH's
current data collection practices, with the goal of developing quantitative measures to assess
program impact over time as outlined in GSH's strategic plan.
![7
Introduction
Good Shepherd Housing (GSH) is a nonprofit organization headquartered in Alexandria, Virginia,
that aims to reduce homelessness in Fairfax County. Over the past 40 years, GSH has gradually
grown from a small volunteer-led initiative to an organization that now provides housing to over
77 households a year. GSH has not conducted a formal evaluation of the impact of their programs
in the past, but in the summer of 2014, they asked our team of graduate students at Georgetown
University’s McCourt School of Public Policy to recommend an evaluation plan for two programs,
Apartments Budgeting Counseling (ABC) and Emergency Services (ES).
In 2011, GSH launched a five-year strategic plan comprised of three core goals to achieve their
vision of becoming the “best-in-class” provider of stable housing for households at risk of
homelessness in their service area. Our project focused on one of those three goals, “increas[ing]
program effectiveness to better meet clients’ needs” (GSH 2011). A strategy outlined by GSH in
achieving this goal included “developing performance management capability,” and three specific
sub-strategies (or tactics) were proposed. Our project pursued two of these tactics from the strategic
plan: developing quantitative measures for GSH’s program effectiveness and developing
comprehensive surveys to administer to clients.
For the last nine months, we have been studying GSH’s goals, programs, and existing evaluation
procedures, and reviewing research into the ways that similar programs have been evaluated. In
this report, we describe what we have learned from our research and present our recommendations
on how to answer the research question:
What methods should GSH use to assess and evaluate the effectiveness of the ABC and ES
programs in supporting GSH client’s self-sufficiency?
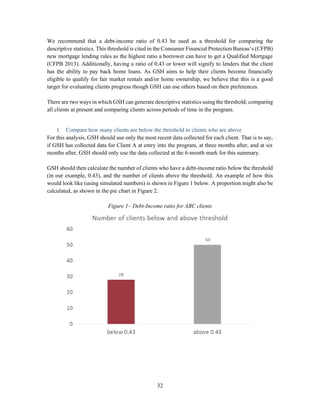
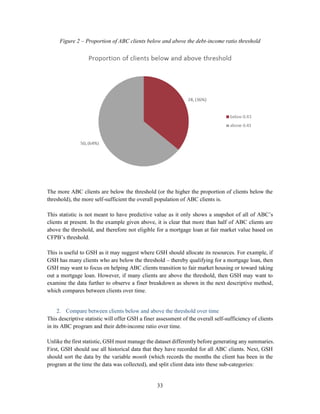
The first chapter of this report, titled Project Methodology, outlines the steps we took to answer the
research question. Specifically, we describe how we came to our key definitions and
recommendations through research, interviews, and close consultation of GSH staff members.
Next, the Literature Review chapter describes the important research we surveyed and analyzed
throughout the course of the project. This chapter is intended to give an overview of the academic
research that helped us connect ABC’s and ES’ evaluation needs to tested models in similar fields.
This chapter leads into Defining and Measuring Self-Sufficiency, which gives a brief background
of relevant literature and our recommended concepts of self-sufficiency for both programs for the
purposes of evaluation.
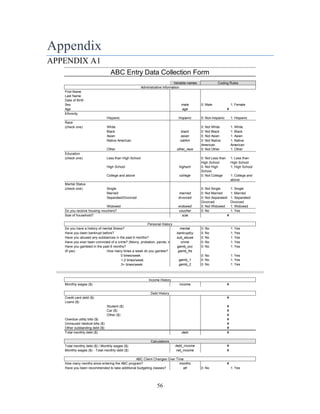
The following chapter, Existing Data and Procedures, outlines GSH’s current data collection
practices for both programs. After the documentation of GSH’s current data collection methods,
this report builds upon GSH’s current practices and offers recommendations for future data
collection in the Data Collection Recommendations chapter.](https://image.slidesharecdn.com/6245b62e-f6c1-41a1-a0a1-f479ce3c7293-160728152749/85/Piong_GSH-Final-Consulting-Report-10-320.jpg)

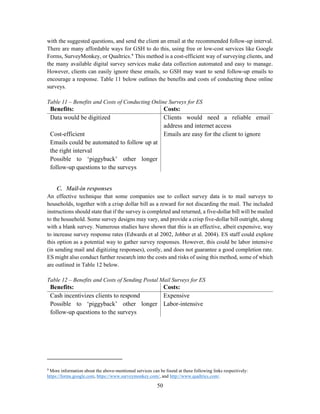
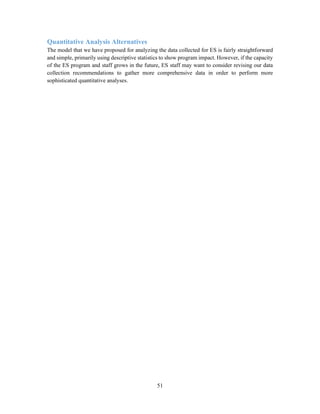
![15
is support for using debt or savings as a measure of self-sufficiency, often in conjunction with other
measures; we found four studies that examined transitional housing similar to ABC that focused
on debt or savings as a measure of self-sufficiency (Washington 2002, Kleit 2004, Santiago and
Galster 2004, Verma, et al. 2013).
The federal government also recognizes the importance of reduced debt and increased savings in
increasing an individual’s self-sufficiency. The Family Self-Sufficiency program, the largest
program dedicated to increasing self-sufficiency for public housing recipients, requires participants
to place a portion of their income into a savings account which they then receive after graduation
from the program (Brennan 2014). While participants can lose their account if they drop out of the
program, reducing debt and increasing savings is an important measure of a client’s level of self-
sufficiency (Brennan 2014).
Constructing the ABC Measure
While we used the literature as a guide for determining the best measure of self-sufficiency for
ABC, we also wanted to tailor our recommendation specifically to the program’s needs. Given that
the most relevant concepts from the literature we found are income and debt/savings, we looked to
find concepts that capture those variables into a workable method for the ABC program. We
examined ABC’s current data collection procedures as well as its current proposed changes (Good
Shepherd Housing and Family Services, Inc. 2014) to that program’s model with the aim of
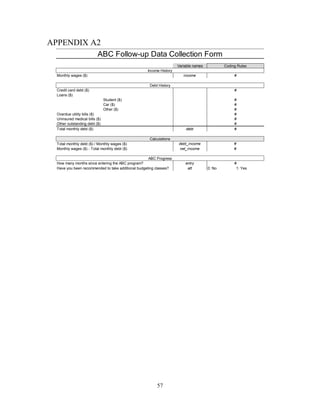
minimizing the strain of our recommendations on GSH’s current processes. At program entry, GSH
currently collects detailed income data from their clients as well as debt information through credit
checks. Though GSH initially contacts and assesses client progress on a quarterly basis, GSH does
not collect detailed debt and income information thereafter, preferring to assess client progress on
smaller achievable goals. Exit interviews do not currently collect detailed income and debt data. A
GSH document detailing possible ABC program changes indicates that they are considering
collecting forms that collect both detailed debt and income information during the quarterly review
(Good Shepherd Housing and Family Services, Inc. 2014).
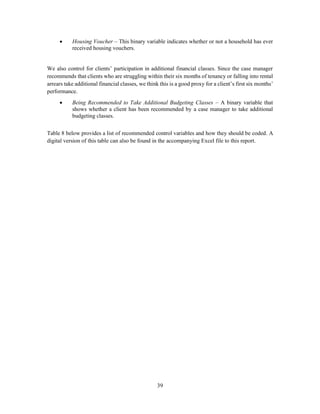
We recommend GSH use two measures that capture both the effect of income and debt changes: a
simple debt-income ratio (debt ÷ income), and change in net income [(current monthly income -
current monthly debt payments) - (monthly income at entry - monthly debt at entry)]. By using both
measures, GSH can account for a client’s debt as a proportion of income as well as their level of
monthly net income. We do not recommend GSH use savings as a measure of self-sufficiency as
the net income captures some of the same effect as savings, the cost of collecting that information
would outweigh the benefit of capturing the rest of the effect, and the fact that many assets are not
easily liquidated.
Both the debt-income ratio and the net income measure can be affected by changes in client monthly
debt or income. Ideally, GSH would observe a decrease in the debt-income ratio, which would
indicate a client moving closer to having no monthly debt. Additionally, GSH would hope to
observe an increase in the change in net income measure for each client at the same time. By
capturing both reduction of debt and increase of income, these two measures would provide a
measure of GSH’s positive impact on clients’ financial self-sufficiency over time.](https://image.slidesharecdn.com/6245b62e-f6c1-41a1-a0a1-f479ce3c7293-160728152749/85/Piong_GSH-Final-Consulting-Report-18-320.jpg)
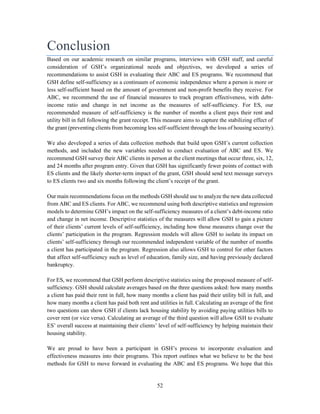
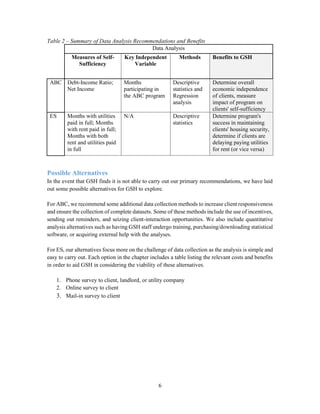
![37
II. Evaluation for ABC – Regression Analysis
Dependent Variables
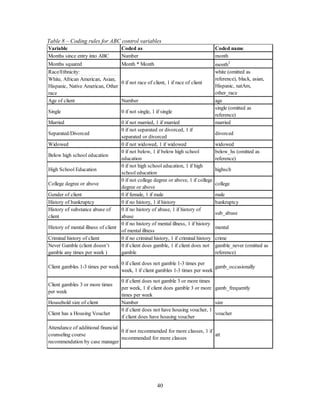
As discussed in the Defining and Measuring Self-Sufficiency chapter, we recommend that debt-
income ratio (debt ÷ income) and change in net income [(current monthly income - current monthly
debt payments) - (monthly income at entry - monthly debt at entry)] are the preferred measures of
self-sufficiency for the ABC program’s clients.
The following example illustrates how the two dependent variables should be generated: imagine
a client had a monthly income of $5,000 and monthly debt of $1,500 when he or she joined the
program and a monthly income of $5,000 and monthly debt of $1,000 after participating into the
program for six months. For this client, the debt-income ratio at the 6-month mark would be
($1,000/$5,000), or 0.20 compared to 0.3 at entry. For this same client, the net income at the entry
point would be ($5,000 - $1,500), or $3,500, and the net income at the 6-month mark would be
($5,000 - $1,000), or $4,000. Then change in net income would be ($4,000 - $3,500), or $500. Both
the decrease in the debt-income ratio and the increase in net income suggest that this client’s self-
sufficiency has increased.
Conversely, now imagine a client who had the same debt-income ratio of ($1,500/$5,000), or 0.3
at entry, but at the 6-month mark had a monthly income of $5,000 and monthly debt of $2,000,
resulting in a debt-income ratio of 0.4. This client’s change in net income would be ($3,000 -
$3,500), or -$500. Both the increase in the debt-income ratio and the decrease in net income suggest
that this client’s self-sufficiency has decreased.
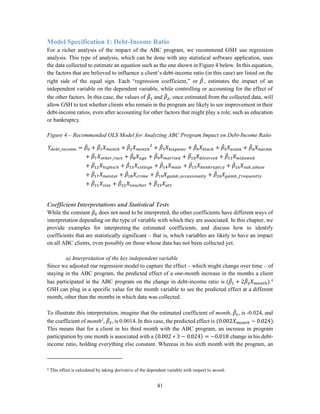
Key Independent Variable of Interest
The key independent variable of interest is the number of months elapsed since a client joined the
ABC program, which is coded as month. This is a continuous variable that captures how many
months a client has participated in the ABC program. As GSH collects entry data and follow-up
data at 3 months, 6 months, 12 months, and 24 months with the ABC program, this variable will
only take the value of 0, 3, 6, 12, and 24 in our recommended analysis.
As we think the relationship between months since a client entered in the ABC program and his or
her self-sufficiency might be non-linear – which is saying that the ABC program might impact a
client differently as the time spent in the program changes – we also generate the square of month
and include this new variable, month2
, to adjust for this non-linearity.
Using standard ordinary least squares (OLS) regression procedures such as those described in
Wooldridge (Wooldridge 2012), a regression model can then be estimated and its results analyzed.
For example, using this method, we would be able to estimate how much a person’s age affects his
or her income level. Knowing this, it is then possible to further predict a person’s income based on
his or her age.](https://image.slidesharecdn.com/6245b62e-f6c1-41a1-a0a1-f479ce3c7293-160728152749/85/Piong_GSH-Final-Consulting-Report-40-320.jpg)