This document provides an overview and instructions for using PHPDebugger, a PHP debugging tool with two components: TADebugger installed on the PHP/web server side, and PHPDebugger running on the client side. It allows setting breakpoints, inspecting variables, and posting messages and backtraces from PHP to the client for debugging. The document covers installation, setting up communication between the components, and basic usage and tips.
![Using PHPDebugger - work in progress / unfinished - - work in progress / unfinished - December 2006 Stefan Pantke [email_address] http://www.turingart.com /](https://image.slidesharecdn.com/php-debugger-119637801027273-4/85/Php-Debugger-1-320.jpg)
![Using PHPDebugger - work in progress / unfinished - - work in progress / unfinished - December 2006 Stefan Pantke [email_address] http://www.turingart.com /](https://image.slidesharecdn.com/php-debugger-119637801027273-4/75/Php-Debugger-1-2048.jpg)
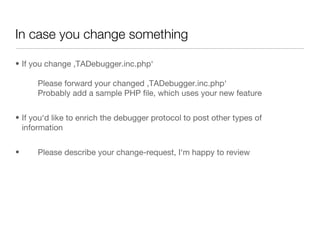
![PHPDebugger :: Main features Two components: TADebugger at the PHP side and PHPDebugger at the client-side Interfaces with PHP using a new PHP class ‚TADebugger‘ PHP and PHPDebugger communicate using TCP [-> Firewall ] Does not require a source-level re-compile of PHP Is available for Mac OS X and Windows, might be become available for Linux too Supports any browser and ships with a built-in one too [a simple one]](https://image.slidesharecdn.com/php-debugger-119637801027273-4/85/Php-Debugger-6-320.jpg)
![For the rest, let‘s assume... 192.68.1.100 IP of the web-server your PHP web-app runs on 192.168.1.42 IP of the system PHPDebugger runs on 8881 Port, on which PHPDebugger listens [default port] /Applications/MAMP/htdocs/phpDebugger/ Web-server root of our PHP web-app Instrument one of your web-apps using the following step-by-step guide](https://image.slidesharecdn.com/php-debugger-119637801027273-4/85/Php-Debugger-8-320.jpg)
![PHPDebugger :: Installation Install ‚TADebugger.inc.php‘ somewhere in your web-app‘s folder You might wish to install the file your ‚includes‘ folder [assumed] Load the ‚TADebugger‘ class using require_once( ‚includes/TADebugger.inc.php‘ ); as the first statement of your PHP source file Now, you may access the debugger using the $sharedDebugger variable](https://image.slidesharecdn.com/php-debugger-119637801027273-4/85/Php-Debugger-9-320.jpg)
![PHPDebugger :: Setting up communication First, define where PHPDebugger runs and where your PHP web-app lives Define the IP of the system you launched PHPDebugger $sharedDebugger->myDebugHost = '192.168.1.42'; Define the port, which PHPDebugger listens on: $sharedDebugger->myDebugPort = 8881; Define the root folder of your web-app [optional] $sharedDebugger->setAppBasePath( '/Applications/MAMP/htdocs/phpDebugger/' );](https://image.slidesharecdn.com/php-debugger-119637801027273-4/85/Php-Debugger-10-320.jpg)
![The Author Stefan Pantke Dipl.-Informatiker [M. Sc. CS] [email_address] I might wear polo shirts too ;-)](https://image.slidesharecdn.com/php-debugger-119637801027273-4/85/Php-Debugger-20-320.jpg)