Download as PDF, PPTX


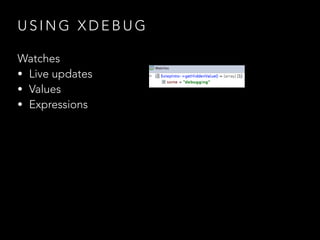
![S E T T I N G U P X D E B U G
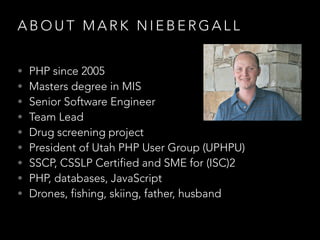
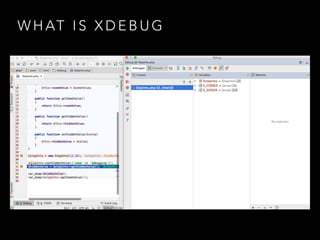
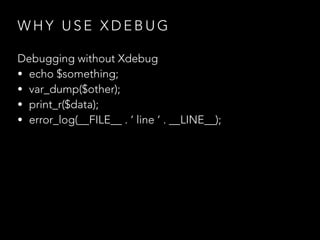
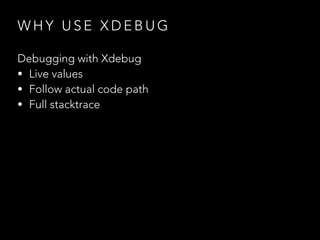
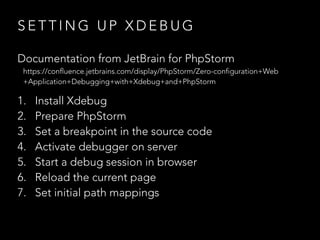
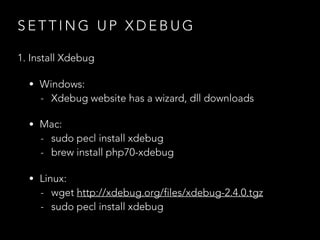
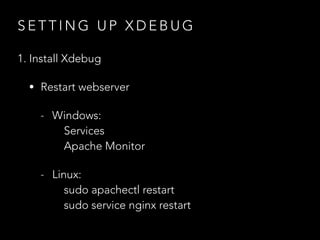
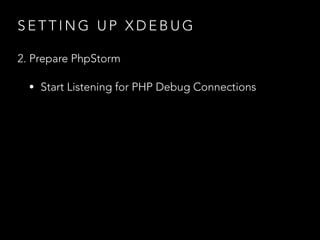
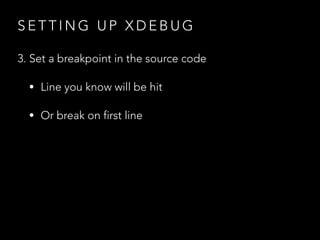
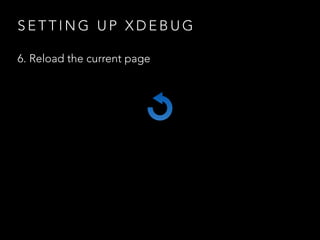
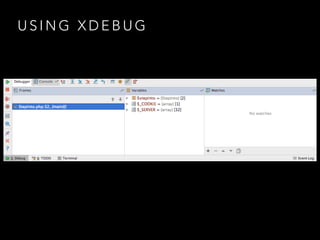
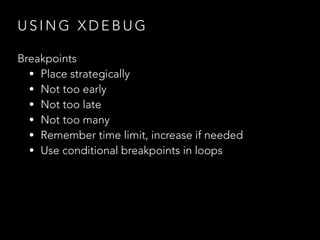
1. Install Xdebug
• Update php.ini by adding lines:
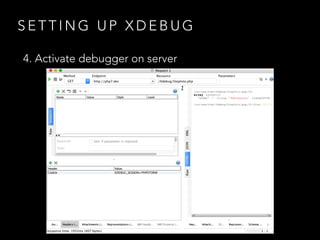
zend_extension = php_xdebug-2.4.0-5.5-vc11.dll
[xdebug]
xdebug.remote_enable = 1
xdebug.remote_port = 9000
xdebug.remote_host = localhost
xdebug.idekey = PHPSTORM](https://image.slidesharecdn.com/debuggingphpwithxdebug-160712180641/85/Debugging-PHP-With-Xdebug-28-320.jpg)
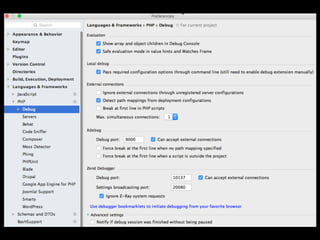
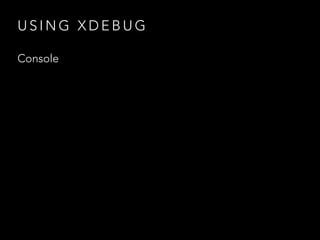
![S E T T I N G U P X D E B U G
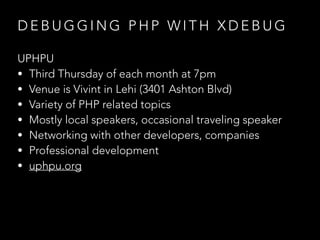
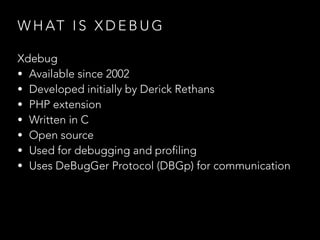
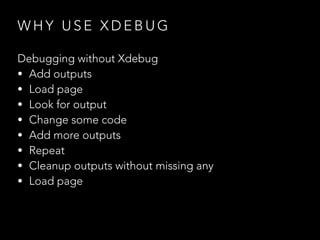
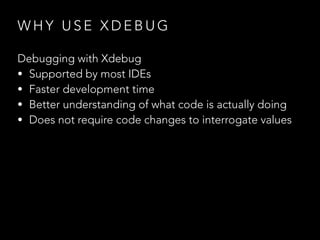
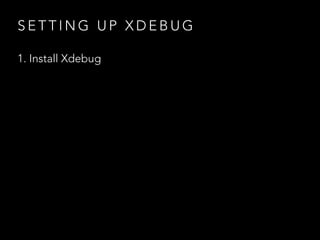
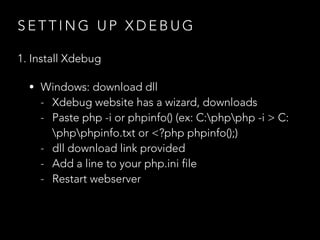
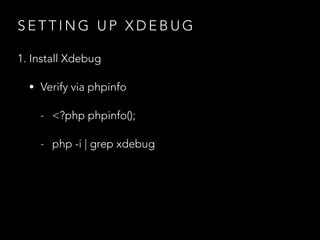
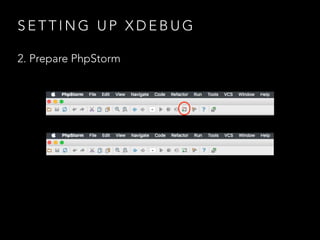
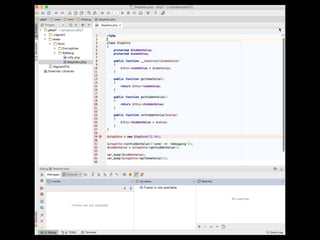
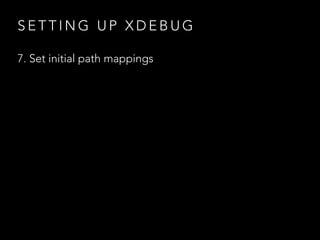
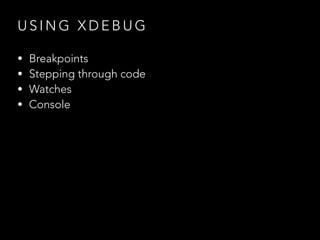
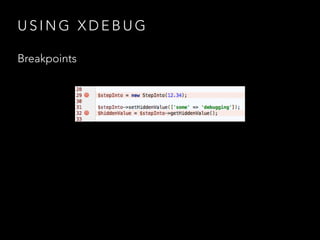
1. Install Xdebug
• Update php.ini by adding lines:
zend_extension = /usr/lib64/php/modules/xdebug.so
[xdebug]
xdebug.remote_enable = 1
xdebug.remote_port = 9000
xdebug.remote_host = localhost
xdebug.idekey = PHPSTORM](https://image.slidesharecdn.com/debuggingphpwithxdebug-160712180641/85/Debugging-PHP-With-Xdebug-29-320.jpg)

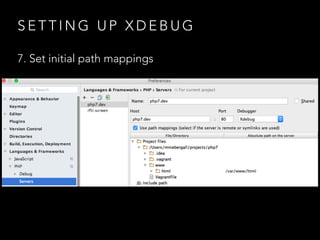
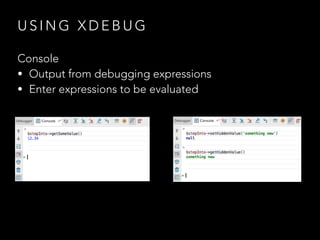


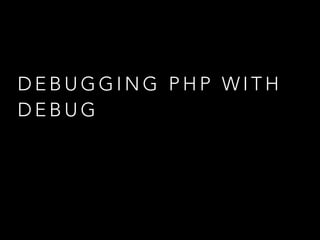
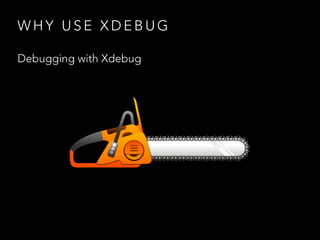
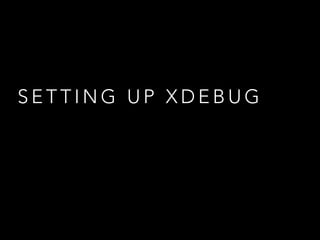
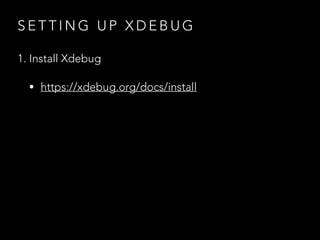
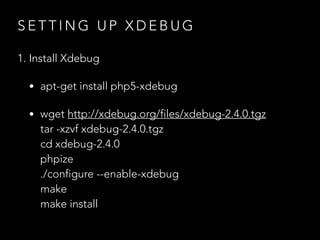
![S O U R C E S
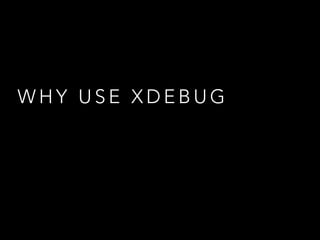
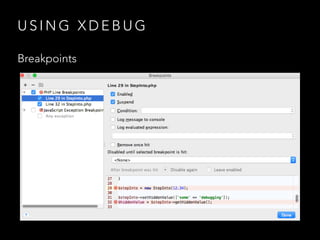
• JetBrains documentation https://confluence.jetbrains.com/display/PhpStorm/Zero-
configuration+Web+Application+Debugging+with+Xdebug+and+PhpStorm
• Xdebug documentation https://xdebug.org/docs/install
• David Stockton, php[architect], January 2015, https://www.phparch.com/wp-
content/uploads/2015/01/levelup-xdebug-phparchitect-jan2015.pdf](https://image.slidesharecdn.com/debuggingphpwithxdebug-160712180641/85/Debugging-PHP-With-Xdebug-81-320.jpg)

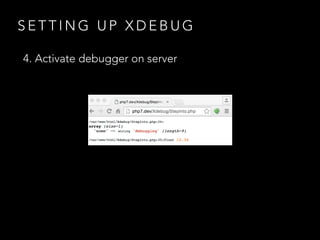
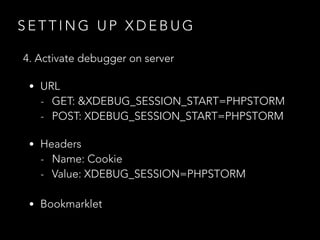
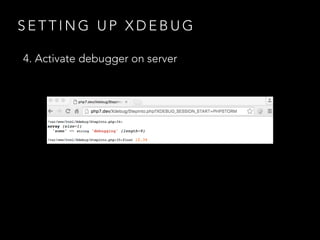
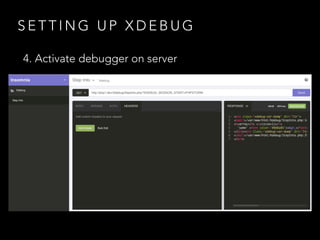
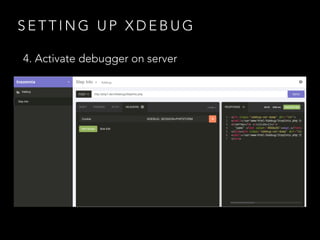
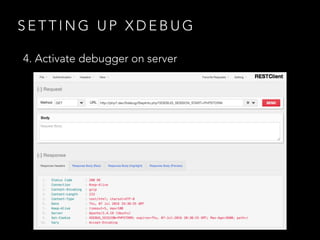
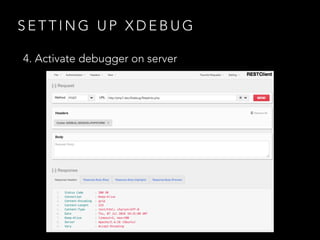
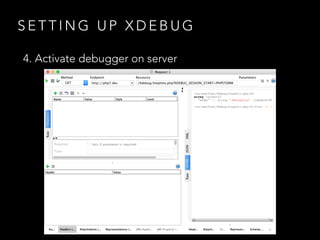
The document discusses debugging PHP applications using Xdebug, highlighting its benefits such as faster development, better understanding of code execution, and avoiding code changes for debugging. It provides detailed setup instructions for Xdebug with PHPStorm, including installation steps and configuration, as well as how to utilize breakpoints and monitoring tools for effective debugging. Additionally, the document emphasizes networking opportunities and professional development for PHP developers through the Utah PHP User Group meetings.


![Filesystem Management with Flysystem - php[tek] 2023](https://cdn.slidesharecdn.com/ss_thumbnails/filesystemmanagementwithflysystem-phptek2023-230514204651-488affd7-thumbnail.jpg?width=640&height=640&fit=bounds)
![Leveling Up With Unit Testing - php[tek] 2023](https://cdn.slidesharecdn.com/ss_thumbnails/levelingupwithunittesting-phptek2023-230514204446-cf06ada2-thumbnail.jpg?width=640&height=640&fit=bounds)