Download as PDF, PPTX


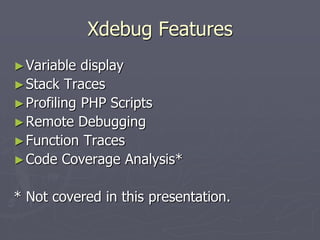
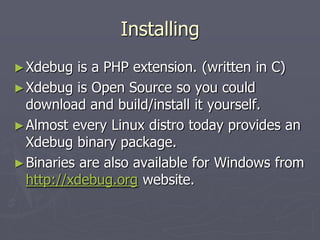
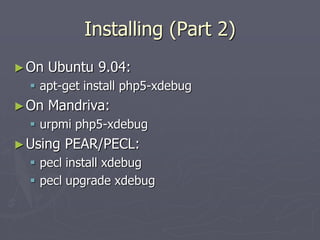
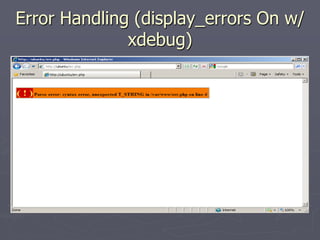
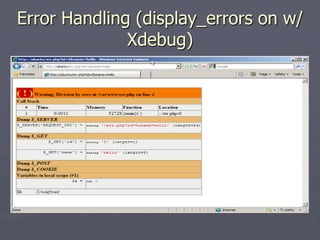
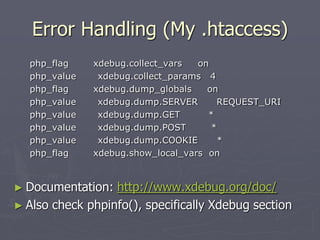
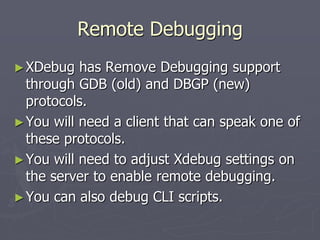
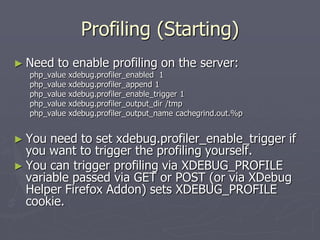
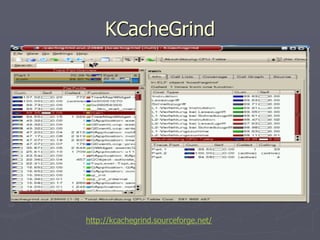
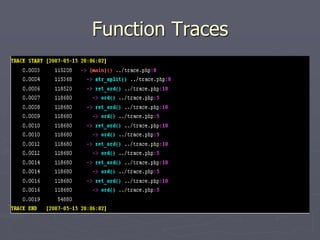
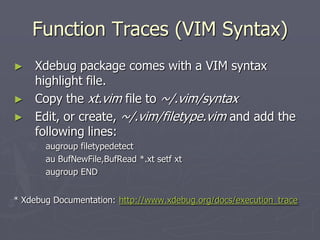
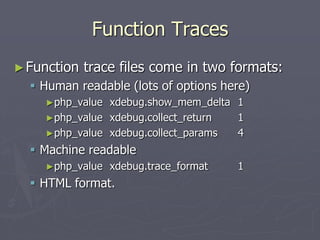
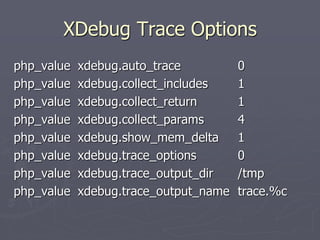
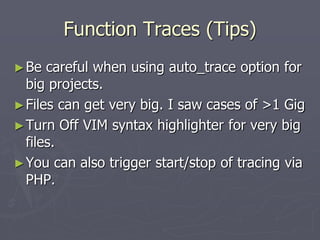
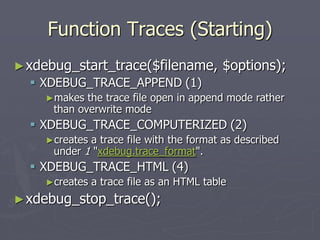

This document provides an overview of the Xdebug PHP debugging tool. It discusses installing Xdebug, enabling error handling and displaying variables, using Xdebug for remote debugging and profiling PHP scripts, and generating function traces. The document also lists Xdebug features and configuration options for profiling, remote debugging, and function traces.