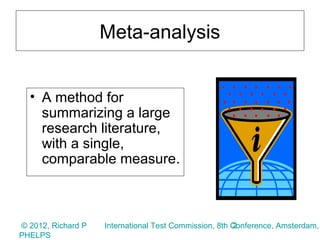
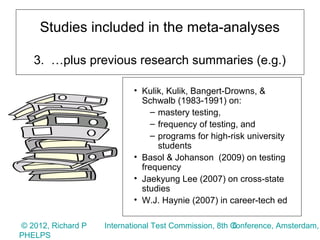
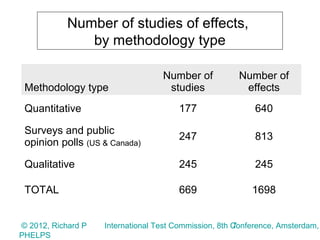
The effect of testing on student achievement:
                   1910-2010


                    Richard P. PHELPS

© 2012, Richard P                                       1
                     International Test Commission, 8th Conference, Amsterdam,
PHELPS
Meta-analysis


  • A method for
    summarizing a large
    research literature,
    with a single,
    comparable measure.


© 2012, Richard P                                      2
                    International Test Commission, 8th Conference, Amsterdam,
PHELPS
The effect of testing on student
                             achievement

                    • 12-year long study

                    • analyzed close to 700 separate studies,
                      and more than 1,600 separate effects

                    • 2,000 other studies were reviewed and
                      found incomplete or inappropriate

                    • lacking sufficient time and money,
                      hundreds of other studies will not be
                      reviewed

© 2012, Richard P                                        3
                      International Test Commission, 8th Conference, Amsterdam,
PHELPS
Looking for studies to include in the
                meta-analyses


1. Included only those studies that found an effect from
   testing on student achievement or on teacher
   instruction…

© 2012, Richard P                                      4
                    International Test Commission, 8th Conference, Amsterdam,
PHELPS
Studies included in the meta-analyses


2. …when:
  • a test is newly introduced, or newly removed
  • quantity of testing is increased or reduced
  • test stakes are introduced or increased, or removed or
    reduced
© 2012, Richard P                                      5
                    International Test Commission, 8th Conference, Amsterdam,
PHELPS
Studies included in the meta-analyses

   3. …plus previous research summaries (e.g.)

                           • Kulik, Kulik, Bangert-Drowns, &
                             Schwalb (1983-1991) on:
                                – mastery testing,
                                – frequency of testing, and
                                – programs for high-risk university
                                  students
                           • Basol & Johanson (2009) on testing
                             frequency
                           • Jaekyung Lee (2007) on cross-state
                             studies
                           • W.J. Haynie (2007) in career-tech ed

© 2012, Richard P                                      6
                    International Test Commission, 8th Conference, Amsterdam,
PHELPS
Number of studies of effects,
               by methodology type

                                   Number of           Number of
 Methodology type                   studies             effects
 Quantitative                          177                  640

 Surveys and public
                                       247                  813
 opinion polls (US & Canada)

 Qualitative                           245                  245

 TOTAL                                 669                 1698


© 2012, Richard P                                      7
                    International Test Commission, 8th Conference, Amsterdam,
PHELPS
Effect size: Cohen’s d


          d = (YE - YC) / Spool


      YE = mean, experimental group
      YC = mean, control group
      Spooled = standard deviation

© 2012, Richard P                                      8
                    International Test Commission, 8th Conference, Amsterdam,
PHELPS
Effect size: Other formulae


                         d = t*((n1+n2/n1*n2)^0.5
                         d = 2r/(1-r²)^0.5
                         d = (YE pre-YE post-YC pre+
                                      YC post)/Spooled post


© 2012, Richard P                                      9
                    International Test Commission, 8th Conference, Amsterdam,
PHELPS
Effect size: Interpretation


     • d between 0.25 & 0.50  weak effect
     • d between 0.50 et 0.75  medium effect
     • d more than 0.75               strong effect


© 2012, Richard P                                      10
                    International Test Commission, 8th Conference, Amsterdam,
PHELPS
Quantitative studies
  (population coverage ≈ 7 million persons)


© 2012, Richard P                                       11
                     International Test Commission, 8th Conference, Amsterdam,
PHELPS
Quantitative studies: Effect size

•   “Bare bones” calculation:

                 d ≈ +0.55      …a medium effect

•   Bare bones effect size adjusted for measurement error

                 d ≈ +0.71      …a stronger effect

•   Using same-study-author aggregation

                 d ≈ +0.88      …a strong effect


© 2012, Richard P                                        12
                      International Test Commission, 8th Conference, Amsterdam,
PHELPS
Which predictors matter?


                                                              Mean Effect
 Treatment Group…                                                Size
 …is made aware of performance, and control group is not         +0.98

 …receives targeted instruction (e.g., remediation)              +0.96

 …is tested with higher stakes than control group                +0.87

 …is tested more frequently than control group                   +0.85


© 2012, Richard P                                         13
                       International Test Commission, 8th Conference, Amsterdam,
PHELPS
More Moderators – Source of Test


                                     Number of         Mean
                                      Studies        Effect Size
     Researcher or Teacher              87              0.93
     National                             24             0.87
     Commercial                           38             0.82
     State or District                    11             0.72
     Total                                160


© 2012, Richard P                                       14
                     International Test Commission, 8th Conference, Amsterdam,
PHELPS
More Moderators – Sponsor of Test


                                  Number of   Mean
                                   Studies  Effect Size
          International               5        1.02
          Local                        99           0.93
          National                     45           0.81
          State                        11           0.64
          Total                       160


© 2012, Richard P                                       15
                     International Test Commission, 8th Conference, Amsterdam,
PHELPS
More Moderators - Study Design

                                       Number of          Mean
                                        Studies         Effect Size
  Pre-post                                12               0.97
  Experiment, Quasi-experiment             107             0.94
  Multivariate                              26             0.80
  Experiment, posttest only                  7             0.60
  Pre-post (with shadow test)                8             0.58
  Total                                    160


© 2012, Richard P                                      16
                    International Test Commission, 8th Conference, Amsterdam,
PHELPS
More Moderators – Scale of Analysis


                                       Number of   Mean
                                        Studies  Effect Size
        Aggregated                         9        1.60
        Small-scale                        118           0.91
        Large-scale                        33            0.57
        Total                              160


© 2012, Richard P                                        17
                      International Test Commission, 8th Conference, Amsterdam,
PHELPS
More Moderators – Scale of Administration


                                       Number      Mean
                                      of Studies Effect Size
        Classroom                        115        0.95
        Mid-scale                          6           0.72
        Large-scale                       39           0.71

        Total                             160


© 2012, Richard P                                        18
                      International Test Commission, 8th Conference, Amsterdam,
PHELPS
Surveys and opinion polls


© 2012, Richard P                                      19
                    International Test Commission, 8th Conference, Amsterdam,
PHELPS
Percentage of survey items,
    by respondent group and type of survey

                 50
                 45
                 40
                 35
                 30                                               Education
       Percent


                 25                                               Providers
                 20
                 15                                               Education
                 10                                               Consumers
                  5
                  0
                      Public opinion polls   Program evaluation
                                                  surveys*


© 2012, Richard P                                                 20
                               International Test Commission, 8th Conference, Amsterdam,
PHELPS
Number and percent of survey items,
        by test stakes and target group


       Test stakes   Number   %            Target group   Number   %

       High             507   62           Students          393   46

       Medium           184   23           Schools           281   33

       Low               33    4           Teachers          116   14

       Unknown           89   11           No stakes          64   7

       TOTAL            813                TOTAL             854


© 2012, Richard P                                        21
                      International Test Commission, 8th Conference, Amsterdam,
PHELPS
Opinion polls, by year

              • 244 between 1958--2008, in the U.S. & Canada
              • 813 unique question-response combinations
              • close to 700,000 individual respondents
 120


 100


  80


  60


  40


  20


   0
       1960    1965   1970       1975   1980          1985   1990   1995   2000   2005
                                               Year


© 2012, Richard P                                               22
                             International Test Commission, 8th Conference, Amsterdam,
PHELPS
Surveys and opinion polls:
     Regular standardized tests, performance tests


                                             Regular tests   Performance tests
                                               (N ≈125)           (N ≈ 50)

    Respondent opinion                            d                  d
    Achievement is increased                      1.2               1.0

    …weighted by size of study population         1.9               0.5

    Instruction is improved                       1.0               1.4

    …weighted by size of study population         0.9               0.9

    Tests help align instruction                  1.0               1.0

    …weighted by size of study population         0.5               0.9


© 2012, Richard P                                                23
                              International Test Commission, 8th Conference, Amsterdam,
PHELPS
Qualitative studies: Summary

             (One cannot calculate an effect size.)


© 2012, Richard P                                      24
                    International Test Commission, 8th Conference, Amsterdam,
PHELPS
Qualitative studies, by methodology type


                                                      Number of
     Methodology                                       studies    %

     Case study                                          120      43

     Experiment or pre-post study                        21        7

     Interviews (individual or group)                    75       27

     Journal                                              2        1

     Review of official records, documents, reports      33       12

     Research review                                      8        3

     Survey                                              22        8

     TOTAL                                               281      100


© 2012, Richard P                                               25
                             International Test Commission, 8th Conference, Amsterdam,
PHELPS
Qualitative studies:
                          Effect on student achievement

        244 studies conducted in the past century in over 30 countries

                               Number of                         Percent without
    Direction of effect         studies     Percent of studies     the inferred

    Positive                      204              84                  93

    Positive inferred             24               10


    Mixed                          5                2                  2


    No change                      8                3                  4


    Negative                       3                1                  1

    TOTAL                         244              100                100


© 2012, Richard P                                               26
                             International Test Commission, 8th Conference, Amsterdam,
PHELPS
Qualitative studies: Testing improves student achievement
                  and teacher instruction

                                      Number of
      Achievement is improved          studies           %

      Yes                                200             95

      Mixed results                       1              <1

      No                                 10              5

      TOTAL                              211            100


                                      Number of
      Instruction is improved          studies           %
      Yes                                158             96
      No                                  7              4
      TOTAL                              165            100


© 2012, Richard P                                           27
                         International Test Commission, 8th Conference, Amsterdam,
PHELPS
Qualitative studies:
                       Variation by rigor and test stakes
                                                Level of rigor
Direction of effect                   high            medium             low           Total
Positive                               95                 67             42            204
Positive inferred                      10                 8               6             24
Mixed                                  3                  1               1             5
No change                              4                  3               1             8
Negative                               1                  1               1             3
TOTAL                                 113                 80             51            244

                                             Stakes
        Direction of effect   high    medium      low          unknown         Total
        Positive              133       27        38              6            204
        Positive inferred      12       5             7                         24
        Mixed                  4                      1                         5
        No change              2        1             5                         8
        Negative               3                                                3
        TOTAL                 154       33        51              6            244
© 2012, Richard P                                                28
                              International Test Commission, 8th Conference, Amsterdam,
PHELPS
Qualitative studies:
     Regular standardized tests and performance tests


                                               Regular tests   Performance tests
                                                 (N =176)           (N = 69)

    Study results                                   %                 %
    Generally positive                              93                95

    High-stakes tests                               71                42

    High level of study rigor                       46                48

    Student attitudes toward test positive          60                71

    Teacher attitudes toward test positive          55                80

    Student achievement improved                    95                95

    Instruction improved                            92                100

    Large-scale testing                             86                68


© 2012, Richard P                                                  29
                                International Test Commission, 8th Conference, Amsterdam,
PHELPS
An enormous research literature


• But, assertions that it does not
  exist at all are common

    – Some claims are made by
      those who oppose standardized
      testing, and may be wishful
      thinking

    – Others are “firstness” claims


© 2012, Richard P                                      30
                    International Test Commission, 8th Conference, Amsterdam,
PHELPS
Dismissive research reviews


                        •    With a dismissive research
                             literature review, a
                             researcher assures all that
                             no other researcher has
                             studied the same topic


© 2012, Richard P                                      31
                    International Test Commission, 8th Conference, Amsterdam,
PHELPS
Firstness claims


  • With a firstness
    claim, a researcher
    insists that he or
    she is the first to
    ever study a topic


© 2012, Richard P                                      32
                    International Test Commission, 8th Conference, Amsterdam,
PHELPS
Social costs are
   enormous

  • Research conducted by those
    without power or celebrity is
    dismissed -- ignored and lost
  • Public policies are skewed, based
    exclusively on the research results of
    those with power or celebrity
  • Society pays again and again for
    research that has already been done

© 2012, Richard P                                      33
                    International Test Commission, 8th Conference, Amsterdam,
PHELPS
The effect of testing on student
                   achievement:
                     1910-2010


                    Richard P. PHELPS
© 2012, Richard P                                       34
                     International Test Commission, 8th Conference, Amsterdam,
PHELPS

The effect of testing on student achievement: 1910-2010

  • 1.
    The effect oftesting on student achievement: 1910-2010 Richard P. PHELPS © 2012, Richard P 1 International Test Commission, 8th Conference, Amsterdam, PHELPS
  • 2.
    Meta-analysis •A method for summarizing a large research literature, with a single, comparable measure. © 2012, Richard P 2 International Test Commission, 8th Conference, Amsterdam, PHELPS
  • 3.
    The effect oftesting on student achievement • 12-year long study • analyzed close to 700 separate studies, and more than 1,600 separate effects • 2,000 other studies were reviewed and found incomplete or inappropriate • lacking sufficient time and money, hundreds of other studies will not be reviewed © 2012, Richard P 3 International Test Commission, 8th Conference, Amsterdam, PHELPS
  • 4.
    Looking for studiesto include in the meta-analyses 1. Included only those studies that found an effect from testing on student achievement or on teacher instruction… © 2012, Richard P 4 International Test Commission, 8th Conference, Amsterdam, PHELPS
  • 5.
    Studies included inthe meta-analyses 2. …when: • a test is newly introduced, or newly removed • quantity of testing is increased or reduced • test stakes are introduced or increased, or removed or reduced © 2012, Richard P 5 International Test Commission, 8th Conference, Amsterdam, PHELPS
  • 6.
    Studies included inthe meta-analyses 3. …plus previous research summaries (e.g.) • Kulik, Kulik, Bangert-Drowns, & Schwalb (1983-1991) on: – mastery testing, – frequency of testing, and – programs for high-risk university students • Basol & Johanson (2009) on testing frequency • Jaekyung Lee (2007) on cross-state studies • W.J. Haynie (2007) in career-tech ed © 2012, Richard P 6 International Test Commission, 8th Conference, Amsterdam, PHELPS
  • 7.
    Number of studiesof effects, by methodology type Number of Number of Methodology type studies effects Quantitative 177 640 Surveys and public 247 813 opinion polls (US & Canada) Qualitative 245 245 TOTAL 669 1698 © 2012, Richard P 7 International Test Commission, 8th Conference, Amsterdam, PHELPS
  • 8.
    Effect size: Cohen’sd d = (YE - YC) / Spool YE = mean, experimental group YC = mean, control group Spooled = standard deviation © 2012, Richard P 8 International Test Commission, 8th Conference, Amsterdam, PHELPS
  • 9.
    Effect size: Otherformulae d = t*((n1+n2/n1*n2)^0.5 d = 2r/(1-r²)^0.5 d = (YE pre-YE post-YC pre+ YC post)/Spooled post © 2012, Richard P 9 International Test Commission, 8th Conference, Amsterdam, PHELPS
  • 10.
    Effect size: Interpretation • d between 0.25 & 0.50  weak effect • d between 0.50 et 0.75  medium effect • d more than 0.75  strong effect © 2012, Richard P 10 International Test Commission, 8th Conference, Amsterdam, PHELPS
  • 11.
    Quantitative studies (population coverage ≈ 7 million persons) © 2012, Richard P 11 International Test Commission, 8th Conference, Amsterdam, PHELPS
  • 12.
    Quantitative studies: Effectsize • “Bare bones” calculation: d ≈ +0.55 …a medium effect • Bare bones effect size adjusted for measurement error d ≈ +0.71 …a stronger effect • Using same-study-author aggregation d ≈ +0.88 …a strong effect © 2012, Richard P 12 International Test Commission, 8th Conference, Amsterdam, PHELPS
  • 13.
    Which predictors matter? Mean Effect Treatment Group… Size …is made aware of performance, and control group is not +0.98 …receives targeted instruction (e.g., remediation) +0.96 …is tested with higher stakes than control group +0.87 …is tested more frequently than control group +0.85 © 2012, Richard P 13 International Test Commission, 8th Conference, Amsterdam, PHELPS
  • 14.
    More Moderators –Source of Test Number of Mean Studies Effect Size Researcher or Teacher 87 0.93 National 24 0.87 Commercial 38 0.82 State or District 11 0.72 Total 160 © 2012, Richard P 14 International Test Commission, 8th Conference, Amsterdam, PHELPS
  • 15.
    More Moderators –Sponsor of Test Number of Mean Studies Effect Size International 5 1.02 Local 99 0.93 National 45 0.81 State 11 0.64 Total 160 © 2012, Richard P 15 International Test Commission, 8th Conference, Amsterdam, PHELPS
  • 16.
    More Moderators -Study Design Number of Mean Studies Effect Size Pre-post 12 0.97 Experiment, Quasi-experiment 107 0.94 Multivariate 26 0.80 Experiment, posttest only 7 0.60 Pre-post (with shadow test) 8 0.58 Total 160 © 2012, Richard P 16 International Test Commission, 8th Conference, Amsterdam, PHELPS
  • 17.
    More Moderators –Scale of Analysis Number of Mean Studies Effect Size Aggregated 9 1.60 Small-scale 118 0.91 Large-scale 33 0.57 Total 160 © 2012, Richard P 17 International Test Commission, 8th Conference, Amsterdam, PHELPS
  • 18.
    More Moderators –Scale of Administration Number Mean of Studies Effect Size Classroom 115 0.95 Mid-scale 6 0.72 Large-scale 39 0.71 Total 160 © 2012, Richard P 18 International Test Commission, 8th Conference, Amsterdam, PHELPS
  • 19.
    Surveys and opinionpolls © 2012, Richard P 19 International Test Commission, 8th Conference, Amsterdam, PHELPS
  • 20.
    Percentage of surveyitems, by respondent group and type of survey 50 45 40 35 30 Education Percent 25 Providers 20 15 Education 10 Consumers 5 0 Public opinion polls Program evaluation surveys* © 2012, Richard P 20 International Test Commission, 8th Conference, Amsterdam, PHELPS
  • 21.
    Number and percentof survey items, by test stakes and target group Test stakes Number % Target group Number % High 507 62 Students 393 46 Medium 184 23 Schools 281 33 Low 33 4 Teachers 116 14 Unknown 89 11 No stakes 64 7 TOTAL 813 TOTAL 854 © 2012, Richard P 21 International Test Commission, 8th Conference, Amsterdam, PHELPS
  • 22.
    Opinion polls, byyear • 244 between 1958--2008, in the U.S. & Canada • 813 unique question-response combinations • close to 700,000 individual respondents 120 100 80 60 40 20 0 1960 1965 1970 1975 1980 1985 1990 1995 2000 2005 Year © 2012, Richard P 22 International Test Commission, 8th Conference, Amsterdam, PHELPS
  • 23.
    Surveys and opinionpolls: Regular standardized tests, performance tests Regular tests Performance tests (N ≈125) (N ≈ 50) Respondent opinion d d Achievement is increased 1.2 1.0 …weighted by size of study population 1.9 0.5 Instruction is improved 1.0 1.4 …weighted by size of study population 0.9 0.9 Tests help align instruction 1.0 1.0 …weighted by size of study population 0.5 0.9 © 2012, Richard P 23 International Test Commission, 8th Conference, Amsterdam, PHELPS
  • 24.
    Qualitative studies: Summary (One cannot calculate an effect size.) © 2012, Richard P 24 International Test Commission, 8th Conference, Amsterdam, PHELPS
  • 25.
    Qualitative studies, bymethodology type Number of Methodology studies % Case study 120 43 Experiment or pre-post study 21 7 Interviews (individual or group) 75 27 Journal 2 1 Review of official records, documents, reports 33 12 Research review 8 3 Survey 22 8 TOTAL 281 100 © 2012, Richard P 25 International Test Commission, 8th Conference, Amsterdam, PHELPS
  • 26.
    Qualitative studies: Effect on student achievement 244 studies conducted in the past century in over 30 countries Number of Percent without Direction of effect studies Percent of studies the inferred Positive 204 84 93 Positive inferred 24 10 Mixed 5 2 2 No change 8 3 4 Negative 3 1 1 TOTAL 244 100 100 © 2012, Richard P 26 International Test Commission, 8th Conference, Amsterdam, PHELPS
  • 27.
    Qualitative studies: Testingimproves student achievement and teacher instruction Number of Achievement is improved studies % Yes 200 95 Mixed results 1 <1 No 10 5 TOTAL 211 100 Number of Instruction is improved studies % Yes 158 96 No 7 4 TOTAL 165 100 © 2012, Richard P 27 International Test Commission, 8th Conference, Amsterdam, PHELPS
  • 28.
    Qualitative studies: Variation by rigor and test stakes Level of rigor Direction of effect high medium low Total Positive 95 67 42 204 Positive inferred 10 8 6 24 Mixed 3 1 1 5 No change 4 3 1 8 Negative 1 1 1 3 TOTAL 113 80 51 244 Stakes Direction of effect high medium low unknown Total Positive 133 27 38 6 204 Positive inferred 12 5 7 24 Mixed 4 1 5 No change 2 1 5 8 Negative 3 3 TOTAL 154 33 51 6 244 © 2012, Richard P 28 International Test Commission, 8th Conference, Amsterdam, PHELPS
  • 29.
    Qualitative studies: Regular standardized tests and performance tests Regular tests Performance tests (N =176) (N = 69) Study results % % Generally positive 93 95 High-stakes tests 71 42 High level of study rigor 46 48 Student attitudes toward test positive 60 71 Teacher attitudes toward test positive 55 80 Student achievement improved 95 95 Instruction improved 92 100 Large-scale testing 86 68 © 2012, Richard P 29 International Test Commission, 8th Conference, Amsterdam, PHELPS
  • 30.
    An enormous researchliterature • But, assertions that it does not exist at all are common – Some claims are made by those who oppose standardized testing, and may be wishful thinking – Others are “firstness” claims © 2012, Richard P 30 International Test Commission, 8th Conference, Amsterdam, PHELPS
  • 31.
    Dismissive research reviews • With a dismissive research literature review, a researcher assures all that no other researcher has studied the same topic © 2012, Richard P 31 International Test Commission, 8th Conference, Amsterdam, PHELPS
  • 32.
    Firstness claims • With a firstness claim, a researcher insists that he or she is the first to ever study a topic © 2012, Richard P 32 International Test Commission, 8th Conference, Amsterdam, PHELPS
  • 33.
    Social costs are enormous • Research conducted by those without power or celebrity is dismissed -- ignored and lost • Public policies are skewed, based exclusively on the research results of those with power or celebrity • Society pays again and again for research that has already been done © 2012, Richard P 33 International Test Commission, 8th Conference, Amsterdam, PHELPS
  • 34.
    The effect oftesting on student achievement: 1910-2010 Richard P. PHELPS © 2012, Richard P 34 International Test Commission, 8th Conference, Amsterdam, PHELPS