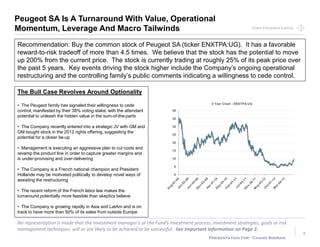
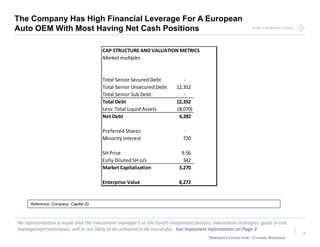
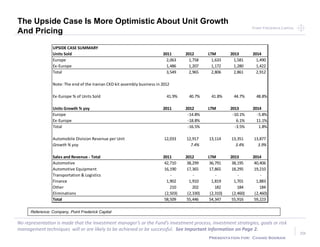
Peugeot SA is undergoing a turnaround that presents an attractive investment opportunity. The company is executing an aggressive restructuring plan to cut costs and improve margins. Management is delivering on its goals and the company benefits from macroeconomic tailwinds. Additionally, the controlling Peugeot family has signaled willingness to cede control, which could unlock hidden value in the company. At its current price, Peugeot stock has the potential for 200% upside as the turnaround progresses. However, the company does have significant debt from its automotive division that adds risk.
PFCapital Just Energy 062314 FINAL AMENDEDChand Sooran
- Just Energy Group Inc. (JE) stock presents an opportunity as factors that have weighed it down recently appear temporary. The stock could increase almost 80% from current levels.
- JE sells natural gas and electricity to residential and business customers in deregulated markets in Canada, US, and UK. It locks in fixed or variable prices for customers and hedges its own commodity exposure.
- Recent poor weather drove missed guidance and dividend cut, but normalization is expected. Debt reduction from asset sales also provides upside optionality from a potential solar JV or improved leverage.
The document summarizes an investment strategy called Bay Point Capital Partners LP. The fund allocates capital to niche credit markets that are underserved and less efficient to generate high returns with low correlation to interest rates. It focuses on preserving capital and providing liquidity. The strategy advantages include high current income yields, an experienced management team, access to a broader opportunity set, investments secured by valuable collateral, and an ability to value collateral and close deals quickly. Performance data shows the fund has outperformed peers and benchmarks since inception, with positive returns in most months and low volatility.
This document provides an overview and disclaimer for a presentation by SG Fleet Group. It notes that the information is general in nature and not complete or guaranteed to be accurate. It also states that the presentation does not constitute financial product advice or an offer of securities. Several key points about the company's financial data and future projections are outlined, including that past performance may not be indicative of future results. The disclaimer concludes by limiting the liability of the company and related parties regarding any forward-looking statements made in the presentation.
The Bulls Eye Strategy aims to deliver short to medium term returns through investing in fundamentally sound stocks and active profit booking. Stock selection is based on positive corporate developments and relative valuation compared to peers. The strategy buys stocks ahead of positive events and when valuations gaps appear, and sells when price targets are reached. It is a low to medium risk strategy for investors with 1 year horizon, and aims to outperform the BSE 200 benchmark. The portfolio will be diversified across large, mid, and small cap stocks from various sectors within allocation limits. The strategy is managed by Mr. Manish Sonthalia with 15 years of experience.
Alexander_Special Situations Tear Sheet_May 2016Dara Capital AG
Alexander Alternative Capital uses a macro top-down approach to identify growth drivers and risk factors across sectors, industries and the macroeconomy. The investment team then uses bottom-up analysis to select securities for the concentrated portfolio, which is constructed both long and short positions. The strategy aims to deliver asymmetric returns with $3 of profit for every $1 of potential loss by aligning the portfolio with macro themes, drivers, and security selection. Performance statistics from January 2014 to April 2016 show annualized returns of 23.79% and an average monthly return of 1.85% with 86% of months positive.
Marketing materials presentation material kb value focus korea equity_20151211kbasset
This document provides information about the KB Value Focus Korea Equity Fund managed by KB Asset Management. It notes that the marketing materials are for general information only and do not constitute authorized materials unless approved by KBAM Compliance. The document contains several disclaimers about past performance not guaranteeing future results and risks not being fully described. It also provides contact information for KBAM and the approval code granted by Compliance.
The Fairfield Sentry Limited fund declined slightly in October 2008, returning -0.06% compared to a -14.6% decline in the S&P 100 index. Since mid-September, the fund has held a "cash" position in U.S. Treasury bills to avoid exposure to declining markets, allowing it to protect investors' capital as the S&P 100 fell over 16% in that period. A small portion invested in non-split-strike conversion investments contributed to the modest negative return. Overall, the fund has pursued a risk-management strategy since inception through active timing and use of cash positions during difficult markets.
The document describes the investment objective and strategy of the "SIN" portfolio. The portfolio aims to achieve long-term capital appreciation through a diversified portfolio of large-cap international stocks selected using a proprietary quantitative model. The model evaluates stocks in the capital goods, consumer non-cyclical, and services sectors based on factors like P/E ratio, earnings growth, revenue growth, and debt-to-equity. The portfolio seeks to minimize risks by limiting single position size and maintaining sector diversification while allowing for up to 10% in hedging instruments. The portfolio charges shareholders fees and has an annual expense ratio of 1.25%.
The insurance sector in Pakistan is expected to become more attractive to investors due to its correlation with economic growth. Analysis of 9-month 2015 performance for five major insurance companies shows a 54% rise in profits, with underwriting contributing more to total income. Improving economic conditions and security are lowering claims ratios. As the economy grows further in coming years, the insurance sector may see sustained growth in premiums and profitability, making it a potential opportunity for portfolio diversification.
This document provides key information about the KB Star Funds - KB Value Focus Korea Equity Sub-Fund (the Sub-Fund), including its objective to achieve long-term capital appreciation primarily through investing in Korean companies. The Sub-Fund seeks capital appreciation using a value-oriented strategy focusing on companies with sound fundamentals and growth potential. The Sub-Fund is classified in a high risk category and carries risks including emerging market, liquidity, currency, and those outlined in the prospectus. Charges include ongoing charges of 1.25% taken from the Sub-Fund annually. Past performance information is not available as the Share Class has not been priced for a full financial year.
A thorough analysis of company , industry and economy goes behind our stock ideas for you. With these picks, you may earn superior returns over a medium to long term period. Visit https://simplehai.axisdirect.in/share-stock-prices/nse/Tata-Motors-Ltd-560 for more
This document provides an overview of the IDFC Focused Equity Fund. The fund is an open-ended equity scheme that invests in a concentrated portfolio of a maximum of 30 stocks with a multi-cap focus. It aims to invest in companies with superior quality and growth characteristics. The fund manager believes returns are driven by identifying the right stocks and allocating sufficiently to them. Currently, the fund is overweight in sectors such as information technology, telecom, and healthcare.
This document summarizes the Fundsupermart.com Recommended Unit Trust Awards 2015. It lists the winning funds in various categories including core equity, bond, and balanced funds. Core equity funds were awarded for global, developed markets, emerging markets, Asia ex-Japan, and Malaysia equity exposures. Bond funds were awarded for short duration Malaysia, Malaysia, and Islamic bond funds. Balanced funds were awarded for Asia ex-Japan, Malaysia, and Islamic balanced funds. Supplementary awards included funds focused on Greater China, Europe, US, global resources, Asia ex-Japan small-mid cap, and bond funds focused on Asia ex-Japan, emerging markets, and global bonds. The event highlights top performing funds based on both quantitative and
This document provides an overview of the Anchor BCI Equity Fund, a South African equity portfolio managed by Anchor Capital. It seeks long-term capital growth through a bottom-up stock selection process that favors quality stocks. The fund constructs its portfolio based on fundamental research, focusing on stocks with strong returns on capital and cash flows. While it considers valuation, the fund's style is not strictly 'value'. It can invest in offshore instruments for efficient portfolio management. The minimum investment is R25,000 and the fund aims to maintain over 80% equity exposure.
Axis Direct presents daily derivatives report presenting recommendations based on technical analysis. For trading in derivatives visit https://simplehai.axisdirect.in/offerings/products/derivatives
A thorough analysis of company , industry and economy goes behind our stock ideas for you. With these picks, you may earn superior returns over a medium to long term period. Visit https://simplehai.axisdirect.in/share-stock-prices/nse/Housing-Development-Finance-Corporation-Ltd-230 for more
A thorough analysis of company , industry and economy goes behind our stock ideas for you. With these picks, you may earn superior returns over a medium to long term period. Visit https://simplehai.axisdirect.in/share-stock-prices/nse/Astral-Poly-Technik-Ltd-27655 for more
The document provides an overview of ASG Group's financial results for FY16, highlighting record revenue of $188.7 million (up 16%) and record EBITDA of $26.7 million (up 32%). Key points include strong operating cashflow at 100% of EBITDA, $185 million in revenue already locked in for FY17 through multi-year contracts, and continued growth expected through transitioning more customers to the new utility-style "New World" services.
Wintop Capital in a healthcare fund in Singapore with an objective is to achieve long-term capital appreciation through investments in healthcare sector.
This document provides a quarterly market outlook and analysis from Anchor Fixed Income for Q1 and Q2 of 2018. It summarizes recent events impacting South African markets, analyzes inflation and interest rate trends, and outlines key risks and opportunities for fixed income investments locally and offshore. The document recommends positioning for potential interest rate cuts in South Africa, notes there is still value in local bonds, and advises patience as volatility is expected from political and external factors.
Daily Technical Report:13 February 2020Axis Direct
Axis Direct presents daily derivatives report presenting recommendations based on technical analysis. For trading in derivatives visit https://simplehai.axisdirect.in/offerings/products/derivatives
Check our Quantic Asset Management Tirthas X1 Retail Factsheet for the month of May 2019. Find out more about our services https://www.quantic-am.com/en/
Walter Aylett presented to the Senate Group on Aylett & Co, an independent investment management firm founded in 2005. He provided an overview of the firm's capabilities, investment philosophy, process and team. Aylett & Co aims to invest in quality businesses and takes a long-term view. The presentation included discussion of the firm's funds and stock selection approach, as well as their current market view and concerns around short-termism in the market.
The document discusses investing for retirement during the "Retirement Red Zone", which refers to the period in retirement when investments are most vulnerable due to challenges like longevity, healthcare costs, pensions, and market volatility. It introduces a variable annuity product that offers lifetime guaranteed income as a solution to address these risks and help preserve savings. Key features highlighted include downside protection, upside potential, and guaranteed lifetime income without giving up control of savings.
This document provides information on the MainStay International Equity Fund, including its investment philosophy, process, portfolio construction, risk management and performance. The fund aims to generate excess returns by investing in attractively valued, sustainable growth companies across various industries and countries. It takes a high-conviction, long-term approach seeking to provide investors with a well-managed, lower volatility portfolio.
Stanlib multi manager-shari'ah_balanced_fund_201508__smmsbf_retailNaweed Hoosenmia
This document provides information on the STANLIB Multi-Manager Shari'ah Balanced Fund portfolio. It includes details such as:
- The portfolio size is R31.01 million
- Income is declared daily and distributed bi-annually
- The portfolio's benchmark allocation includes the FTSE/JSE Shari'ah ALSI 45%, STeFI Composite Index 35%, and Dow Jones Islamic World Index 15%
- Minimum lump sum investment is R5,000 and minimum debit order per month is R500
- The total expense ratio is 0.00% for Class A
- Top holdings include MTN Group, Sasol, Mondi, Vodacom Group, and Life Healthcare
- Air Canada has completed a turnaround after exiting creditor protection in 2004 by resolving labor issues, introducing a lower-cost carrier (Air Canada rouge), and implementing cost controls.
- The company has opportunities for further cost reductions through fleet modernization and lower maintenance costs on new aircraft. Its underfunded pension is also positively leveraged to rising interest rates.
- The presentation recommends buying Air Canada stock, arguing the company's recent labor agreements, fleet plan with associated cost savings, pension leverage to higher rates, and potential for additional cost cuts could drive the stock price up approximately 150% from current levels.
PF Capital Asbury Automotive 092214 FinalChand Sooran
Asbury Automotive Group is one of the largest auto dealers in the US, concentrated in the Southeast and New Jersey. The document asserts that Asbury Automotive faces several cyclical challenges as the North American new and used car cycles peak, and relies heavily on ancillary revenue from financial services which may be restricted by new regulations. Specifically, Asbury derives a large and growing portion of its gross margin from arranging third-party financing and insurance for customers, which could be impacted by proposals to cap marketing fees. The author recommends shorting Asbury Automotive stock due to these cyclical and regulatory risks facing the company's business model.
The Highwater Capital Fund employs a strategy of researching and trading equities, currencies, bonds and other investments to achieve superior risk-adjusted returns. The Fund uses both macroeconomic top-down analysis and bottom-up fundamental analysis of individual investments to identify opportunities. The Fund's manager, Christopher von Dahm, has over 20 years of experience in finance and seeks investments that exhibit characteristics like strong balance sheets, profitability, and management quality. The Fund aims to balance performance with risk management techniques like position limits and diversification. Past performance includes returns of over 140% since inception but past results do not guarantee future performance.
ICICI Prudential Business Cycle Fund_1 pagericiciprumf
Now get the opportunity to Invest in ICICI Prudential Business Cycle Fund and aim to stay on the course and ride out the business cycles.
NFO Open: 29th December, 2020 - 12th January, 2021.
Know More: http://bit.ly/IpruBusinessCycleFund
#NFOLaunch #BusinessCycleFund
Exide Industries is a leading manufacturer of lead acid batteries for automotive, telecom, traction, UPS, naval and motive power markets. The Company sells its products under EXIDE, SF, SONIC and Standard Furukawa Brands. In the international market, the products are sold under DYNEX, INDEX and SONIC brands.
Summary of financial results for the 1H2020InterCars
Inter Cars is a leading auto parts distributor in Europe presenting its business to investors. The presentation discusses Inter Cars' leadership position in Europe as the #2 auto parts distributor, its attractive financial profile with a focus on profitability, and its unique distribution network supported by over 1,600 branches across 17 countries.
Capital Markets Review for Financial AdvisorsCraig Wesley
Many Financial Advisors are looked to by their clients to explain market conditions. Here is a slideshare that may be useful to distill into a high level explanation for your clients.
www.optimalcapital.com
This investor presentation provides an overview of Inter Cars S.A., a leading automotive parts distributor in Europe. Inter Cars has achieved consistent double-digit sales growth through expanding its product portfolio and geographic footprint. Recently, the company shifted its focus to improving profitability by optimizing inventory, supply chain, and purchasing. The presentation highlights Inter Cars' leadership position in the industry, protected business model, strong financial track record, and experienced management team as key credit strengths.
HSBC is pursuing a strategy to return to profitable growth while maintaining its signature balance sheet strength. Key points of the strategy include accelerating growth in Asia, improving capital efficiency, completing the turnaround of its US business, simplifying operations, and investing in technology. HSBC aims to achieve a return on tangible equity above 11% by 2020 while delivering positive annual jaws and sustaining its dividend. This strategy will leverage HSBC's position as a leading international bank with access to high growth markets and a strong capital and liquidity position.
Summary of financial results for the 3Q2020 InterCars
Inter Cars presented an investor presentation in November 2020. The presentation outlined Inter Cars' position as the largest European listed auto parts distributor, with a focus on Central and Eastern Europe. It discussed Inter Cars' strategic shift in recent years toward improving profitability, through initiatives like optimizing stock rotation, utilizing third-party logistics, and direct purchases from factories. The presentation also highlighted Inter Cars' integrated business model and large distribution network across 17 countries as competitive advantages.
Andy Hallett - Sthree - Recruitment A Game Of ThronesJayne Corbett
SThree's recruitment business faces disruption from new competitors using different business models like online job boards, freelancing platforms, and automation. However, not all disruption is equal and the "wars will be about UX and brand". SThree has invested approximately 1% of gross profit in SThree Ventures to develop new revenue streams and stay ahead of changes through innovation. Examples include building a video platform and messaging bot. The presentation emphasizes continuously scanning the competitive landscape and supporting innovation from the top to future-proof the business long-term.
Sargon was a high-growth fintech company based in Australia, New Zealand and Hong Kong founded by Phillip Kingston.
It grew to A$60+ billion in assets and A$55+ million in annual recurring revenue (ARR) within 4 years and was backed by Peter Thiel.
This presentation is titled "1HFY20 Preliminary Results & Analysis" and is the last management presentation from the company covering the period of July 1, 2019 to December 31, 2019 with a forecast out to June 30, 2020 (FY20 = Australian 2020 financial year).
Inter Cars is the largest auto parts distributor in Europe with a presence in 17 countries. It has a unique distribution model supported by 535 daily deliveries from its network of 11 warehouses in Poland and 6 warehouses abroad. This allows Inter Cars to provide timely delivery of its extensive catalog of over 350,000 SKUs to its network of over 1,600 affiliated garages and 100,000 regular customers. Going forward, Inter Cars aims to increase profitability through initiatives like optimizing stock rotation, purchasing directly from suppliers, and utilizing third-party logistics.
This presentation provides an overview of Anumara Capital, a private equity firm focused on investing in small and medium companies in Brazil. Anumara aims to generate recurring returns through dividends rather than exits, focusing on healthcare, education, and retail sectors. It seeks to actively manage portfolio companies through operational improvements and shared service providers. Anumara also emphasizes ESG and responsible investing practices to have a positive impact and multiplier effect in the local economy. The presentation outlines Anumara's investment strategy, targets, differentials, pipeline, and team.
Third Point Re provides an investor presentation summarizing its business as a specialty property and casualty reinsurer. It has a profitable first two years of operations with a 23.4% return on equity in 2013. Third Point Re has a total return business model combining reinsurance underwriting with superior investment returns from its portfolio managed by Third Point LLC, which has achieved a 21.0% net annualized return since inception. It takes a disciplined and opportunistic approach to reinsurance underwriting and has rigorous risk management practices.
Presentation by LafargeHolcim management, Miljan Gutovic and Jamie Gentoso to members of the financial community at LafargeHolcim Capital Markets Day 2018
Ashok Leyland: Reports sales volume growth of 16.7% in Aug'14 - Motilal OswalIndiaNotes.com
- Ashok Leyland reported sales growth of 16.7% YoY in August 2014 to 8,331 units, above estimates of 7,413 units.
- Medium and heavy commercial vehicle (MHCV) volumes grew 18% YoY to 5,830 units, while light commercial vehicle (LCV) volumes returned to growth with a 14% YoY increase.
- The analyst maintains a "Buy" rating on Ashok Leyland with a target price of INR45, citing improved demand outlook for the second half of the year and valuation ratios that remain attractive.
Tpre investor presentation february 2014 v1 v001-v7uxeiirthirdpointre
Third Point Re provides concise summaries of key information from investor presentations in 3 sentences or less. The document summarizes Third Point Re's business model, financial profile, and relationship with investment manager Third Point LLC. It highlights profitable reinsurance underwriting combined with superior investment returns, an experienced management team, and a history of strong financial performance driving opportunities for equity returns.
Tpre investor presentation september 2013 v5 v001-r6sx3eirthirdpointre
Third Point Re provides a presentation summarizing their business. They operate as a specialty property and casualty reinsurer with an A- rating. Their reinsurance subsidiary commenced underwriting in 2012 after raising $784 million. They have a total return business model combining profitable reinsurance underwriting with superior investment returns from their investment manager Third Point LLC. Their experienced management team and disciplined underwriting strategy aim to deliver attractive equity returns over time from underwriting profits and positive asset leverage.
Barry Ritholtz Presentation on Behavioral Economics (CFA Toronto 2013)Chand Sooran
A good introduction to key issues in behavioral economics from Barry Ritholtz in a presentation made to the CFA Toronto Group. Pithy, entertaining and informative.
FT Alphaville - Izabella Kaminska on the Collateralization of CommoditiesChand Sooran
Excellent presentation from @ftalphaville, highlighting the #collateralization of #commodities by @izakaminska with charts on inventories and a conclusion as to the turn in #metals markets, potentially.
The document summarizes global economic data for May 2013. It found that global economic growth slowed in the second quarter, with manufacturing and service sector growth weakening. The US saw the strongest growth among developed economies while the eurozone continued to contract. Growth also slowed in major emerging markets like China, India, and Russia. Central banks maintained accommodative monetary policies despite some signs of improvement in certain economies.
1) A small eurozone country exiting in a "hard money" way, by maintaining a fixed exchange rate with the euro for a period, could have limited impacts initially but risks encouraging others to follow suit.
2) The exit of a high-debt country like Spain or Italy would likely trigger deposit flights throughout other high-debt countries, testing the ECB's willingness to fully back banking systems and risking the end of the euro project.
3) While most politicians discuss exits as manageable, the design flaws and political tensions of the eurozone make fixes difficult, and unforeseen events could start a process leading to a full break-up with severe economic and legal consequences.
Arnold & Porter on Fraudulent ConveyanceChand Sooran
The document discusses fraudulent conveyance principles used to overturn leveraged buyout (LBO) transactions. It notes that fraudulent conveyance laws exist to protect companies and creditors from transactions that extract value without providing reasonable value in return. When an LBO fails, parties may initiate litigation to avoid liens granted to lenders that financed the LBO and recover payments made to former shareholders. There are two types of fraudulent transfers - actual fraud which requires proving intent to defraud, and constructive fraud which looks at the underlying economics without requiring intent. Potential defendants in such cases include officers, directors, lenders, financial advisors, and former shareholders.
Howard marks investing in uncertain times 021313Chand Sooran
Howard Marks discusses investing in an uncertain global economic environment. He notes that the world seems more uncertain than ever before. Specifically, the US economy is sluggish and uncertain, Europe's future is unclear, and officials have been unable to solve major problems. However, asset prices are reasonable and investor psychology is cautious. Marks recommends a balanced approach of moving forward carefully, emphasizing high-quality investments and active management during this period of uncertainty.
Barclays Capital Minority Investor Report Summer 2011Chand Sooran
This document discusses women and minority owned hedge funds, including the rationale for investing in them, potential growth, and performance. Key findings include:
- Demand for women and minority owned funds is growing and could reach $378 billion in assets. However, they currently represent only 3% of hedge funds.
- Launches increased from 2006-2008 but declined in 2009-2010 due to the economic downturn. Qualifying as a women or minority owned fund is precise.
- Women and minority owned funds tend to be smaller and younger but have outperformed other hedge funds, especially during downturns. They face barriers to entry but see opportunities. Some controversy exists around affirmative investing policies.
Cal pers emerging manager program 022613Chand Sooran
CalPERS outlined plans to increase investments with emerging and diverse managers over the next five years. The plan focuses on six work streams around portfolio management and four around external outreach. Currently, CalPERS has $10 billion invested with over 300 emerging managers, representing 12% of externally managed assets. Another $3 billion is invested with over 80 diverse managers. The plan aims to improve performance tracking, increase commitments to emerging manager programs, and strengthen relationships with stakeholder organizations.
This document discusses approaches for teaching behavioral finance at the undergraduate level. It addresses four key topics:
1) Core topics to cover include behavioral concepts, investor behavior, market behavior, and financial psychology. Topics range from biases and heuristics to anomalies, emotions, and group dynamics.
2) Unique teaching methods include qualitative analyses of personality surveys rather than quantitative analyses. Class discussions focus on applying concepts to individual decisions.
3) Assessments include exams, a research paper, and a journal summarizing personality surveys. This helps students understand how biases influence their own decisions.
4) Interactive exercises demonstrate concepts like risky shift and inertia. Students anonymously answer scenarios, then discuss in groups to see if
This document discusses volatility in financial markets. It begins by stating that we currently live in uncertain times, which has led to a "bull market in fear". It defines volatility as the market price of uncertainty. It then uses metaphors of ships navigating a dangerous strait to represent the economy avoiding deflation or inflation. Historical charts are presented showing how volatility spikes during deflationary crashes. Another chart shows how German stock market volatility drastically increased during the hyperinflation of the Weimar Republic. The document examines volatility in both deflation and inflation scenarios.
1. Strictly Confidential August 2013
Point Frederick CapitalPoint Frederick Capital
Point Frederick Capital
Management, LLC
Presentation for: Chand Sooran
Peugeot SA: This Turnaround Train Is Leaving The Station
2. Point Frederick CapitalPoint Frederick Capital
No representation is made that the Investment manager’s or the Fund’s investment process, investment strategies, goals or risk
management techniques will or are likely to be achieved or be successful. See Important Information on Page 2.
Presentation for: Chand Sooran
Important Information
2
This material has been prepared by Point Frederick Capital Management, LLC (the “Investment Manager” or “Point Frederick”). The information in this material is for illustration and
discussion purposes only. It is not intended to be, nor should it be construed or used as, investment, tax or legal advice, any recommendation or opinion regarding the
appropriateness or suitability of any investment or strategy, or an offer to sell, or a solicitation of an offer to buy, an interest in any security, including an interest in the private fund
described herein (the “Fund”) or any other private fund or pool advised by the Investment Manager or any of its affiliates. This information is qualified in its entirety by the
information contained in the Fund’s confidential offering documents (the “Offering Memorandum”). Any offer or solicitation of an investment in the Fund may be made only by
delivery of the Offering Memorandum to qualified investors. Prospective investors should rely solely on the Offering Memorandum in making any investment decision. The Offering
Memorandum contains important information, including, among other information, a description of the Fund’s risks, investment program, fees and expenses, and should be read
carefully before any investment decision is made. This material does not take into account the particular investment objectives, restrictions, or financial, legal or tax situation of any
specific investor. An investment in the Fund is not suitable for all investors.
No representation is made that the Investment Manager’s or the Fund’s investment process, investment objectives, goals or risk management techniques will or are likely to be
achieved or successful or that the Fund or any underlying investment will make any profit or will not sustain losses. An investment in the Fund involves risk, as disclosed in the
Offering Memorandum. The Investment Manager may engage in investment practices or trading strategies that may increase the risk of investment loss and a loss of principal may
occur. The risk management techniques which may be utilized by the Investment Manager cannot provide any assurance that the Fund will not be exposed to risks of significant
trading losses.
Any descriptions involving investment process, investment examples, statistical analysis, investment strategies or risk management techniques are provided for illustration purposes
only, will not apply in all situations, may not be fully indicative of any present or future investments, may be changed in the discretion of the Investment Manager and are not
intended to reflect performance.
Any opinions, assumptions, assessments, statements or the like (collectively, “Statements”) regarding future events or which are forward-looking, including regarding portfolio
characteristics and limits, constitute only subjective views, beliefs, outlooks, estimations or intentions of the Investment Manager, should not be relied on, are subject to change due
to a variety of factors, including fluctuating market conditions and economic factors, and involve inherent risks and uncertainties, both general and specific, many of which cannot be
predicted or quantified and are beyond the Investment Manager’s or the Fund’s control. Future evidence and actual results (including actual composition and investment
characteristics of a portfolio) could differ materially from those set forth in, contemplated by, or underlying these Statements, which are subject to change without notice. In light of
these risks and uncertainties, there can be no assurance and no representation is given that these Statements are now, or will prove to be accurate, or complete in any way. The
Investment Manager undertakes no responsibility or obligation to revise or update such Statements. Statements expressed herein may not necessarily be shared by all personnel
of the Investment Manager and its affiliates.
This material is not complete, is subject to change and does not contain material information regarding the Fund, including specific information relating to an investment in the Fund
and related risks factors. Certain information has been provided by and/or is based on third party sources and, although believed to be reliable, has not been independently
verified. The Investment Manager is not responsible for errors or omissions from these sources. No representation is made with respect to the accuracy, completeness or
timeliness of information and the Investment Manager assumes no obligation to update or otherwise revise such information.
This information is confidential, is the property of the Investment Manager, is intended only for intended recipients and their authorized agents and representatives and may not be
reproduced or distributed to any other person without prior written consent.
2
3. Point Frederick CapitalPoint Frederick Capital
No representation is made that the Investment manager’s or the Fund’s investment process, investment strategies, goals or risk
management techniques will or are likely to be achieved or be successful. See Important Information on Page 2.
Presentation for: Chand Sooran
3
Peugeot SA Is A Turnaround With Value, Operational
Momentum, Leverage And Macro Tailwinds
Recommendation: Buy the common stock of Peugeot SA (ticker ENXTPA:UG). It has a favorable
reward-to-risk tradeoff of more than 4.5 times. We believe that the stock has the potential to move
up 200% from the current price. The stock is currently trading at roughly 25% of its peak price over
the past 5 years. Key events driving the stock higher include the Company’s ongoing operational
restructuring and the controlling family’s public comments indicating a willingness to cede control.
The Bull Case Revolves Around Optionality
• The Peugeot family has signaled their willingness to cede
control, manifested by their 38% voting stake, with the attendant
potential to unleash the hidden value in the sum-of-the-parts
• The Company recently entered into a strategic JV with GM and
GM bought stock in the 2012 rights offering, suggesting the
potential for a closer tie-up
• Management is executing an aggressive plan to cut costs and
revamp the product line in order to capture greater margins and
is under-promising and over-delivering
• The Company is a French national champion and President
Hollande may be motivated politically to develop novel ways of
assisting the restructuring
• The recent reform of the French labor law makes the
turnaround potentially more feasible than skeptics believe
• The Company is growing rapidly in Asia and LatAm and is on
track to have more than 50% of its sales from outside Europe
0
5
10
15
20
25
30
35
40
5 Year Chart - ENXTPA:UG
4. Point Frederick CapitalPoint Frederick Capital
No representation is made that the Investment manager’s or the Fund’s investment process, investment strategies, goals or risk
management techniques will or are likely to be achieved or be successful. See Important Information on Page 2.
Presentation for: Chand Sooran
4
The Company Has High Financial Leverage For A European
Auto OEM With Most Having Net Cash Positions
Reference: Company, Capital IQ.
CAP STRUCTURE AND VALUATION METRICS
Market multiples
Total Senior Secured Debt -
Total Senior Unsecured Debt 12,352
Total Senior Sub Debt -
Total Debt 12,352
Less: Total Liquid Assets (8,070)
Net Debt 4,282
Preferred Shares -
Minority Interest 720
SH Price 9.56
Fully Diluted SH o/s 342
Market Capitalization 3,270
Enterprise Value 8,272
5. Point Frederick CapitalPoint Frederick Capital
No representation is made that the Investment manager’s or the Fund’s investment process, investment strategies, goals or risk
management techniques will or are likely to be achieved or be successful. See Important Information on Page 2.
Presentation for: Chand Sooran
5
Peugeot Is The Second Largest Auto OEM In Europe With
Significant Ancillary Business In Parts And Financing
The Company is engaged in the design, production and distribution of passenger automobiles and light
commercial vehicles in Europe, China and Latin America. In addition, Peugeot owns a 57% stake in European
auto parts company Faurecia (ENXTPA:EO), as well having a captive bank, Banque PSA, that provides retail and
dealer financing for its automotive division. The Company has a number of joint ventures, including notably with
GM, Dongfeng Motors, Changan Autombile, Toyota and Mitsbushi variously for auto design, purchasing and
production. It is a French national industrial champion with an extensive intellectual property portfolio.
Last Twelve Months Rev Mix % OpInc Margin
Automotive 36,791 67.7% (1,349) -3.7%
Automotive Equipment 17,865 32.9% 468 2.6%
Finance 1,819 3.3% 325 17.9%
Other 182 0.3% (18) -9.9%
Eliminations (2,310) -4.3% 4
Total 54,347 100.0% (570) -1.0%
Turning Around Automotive Is Essential Europe Is Still The Biggest Region
Units - Last Twelve Months Share
Europe 58.2%
Russia 2.4%
LatAm 11.0%
China 18.2%
ROW 10.1%
CKD 0.1%
Total 100.0%
Management Is Connected To The French Elite
Philippe Varin has been CEO since 2009. He is the
former CEO of steelmaker Corus and he has held
various executive positions at Pechiney. He is a graduate
of the Ecole Polytechnique and the Ecole des Mines.
CFO Jean Baptiste De Chatillon has been with the
Company since 1989. Several other key executives,
including the head of Asia and the head of product
development are graduates of elite French schools.
6. Point Frederick CapitalPoint Frederick Capital
No representation is made that the Investment manager’s or the Fund’s investment process, investment strategies, goals or risk
management techniques will or are likely to be achieved or be successful. See Important Information on Page 2.
Presentation for: Chand Sooran
6
The Business Model Is Characterized By High Fixed Costs,
Requiring Strong Volumes
The Company seeks to develop a brand and to design vehicles that will command a premium in the market,
across a variety of segments, including compact cars (the A&B segment as classified by the European
Commission), mid-size cars (C&D), premium cars and light commercial vehicles. Given the high fixed cost of
owning and operating manufacturing plants all over the world, the Company seeks to maximize capacity utilization
across its system. Common platforms and volume purchasing agreements are further sources of efficiency.
When capacity utilization falls below 75%, gross margins collapse. Furthermore, margins are lower for smaller,
lower priced cars. Therefore, the Company is working on both “upbranding” its product offering, as well as
rationalizing capacity for a structurally weaker European auto market, even as it seeks to increase its geographic
mix of sales outside of Europe to more than 50%. Peugeot targets 100% capacity utilization within 3 years.
2009 2011 2012 H113
Utilization Rate - Total 80% 86% 75% 74%
Utilization Rate - France 61%
Utilization Rate - A&B 87% 76% 72% 65%
Capacity Utilization Is Currently Weak The Company Is De-Emphasizing Commodity Cars
% of Total Sales 2009 2010 2011 2012 H113
C&D Segments 38% 40% 43% 45% 47%
A&B Segments 46% 43% 38% 38% 36%
Premium Vehicles 9% 13% 18% 18% 19%
# of Units
Top 5 Growth Regions H112 H113 % yoy
China 200 278 39%
Argentina 47 68 45%
Brazil 62 61 -2%
Algeria 36 58 61%
Russia 41 32 -22%
They Have Strong Growth Ex-Europe
Reference: Company, Point Frederick Capital
7. Point Frederick CapitalPoint Frederick Capital
No representation is made that the Investment manager’s or the Fund’s investment process, investment strategies, goals or risk
management techniques will or are likely to be achieved or be successful. See Important Information on Page 2.
Presentation for: Chand Sooran
7
What Went Wrong? And How Can It Be Fixed?
The Company Made Critical Strategic
Miscalculations
• Driven by the Peugeot family, the Company elected to focus on the
return of capital (E6.6B in dividends and buybacks between 1995 and
2012) over geographic diversification and moving into higher margin
segments of the automotive market, reinforcing the perception of a
commoditized brand with poor design
• The Company has a concentrated exposure to Southern Europe,
particularly France, Spain and Italy, countries with especially elevated
unemployment rates and considerable economic uncertainty, leading to
dramatically lower volume
• The Company has suffered market share losses in Europe as a
consequence of its exposure to Southern Europe, reinforcing concerns
about its longevity
• Lower volumes in Europe led to lower utilization rates with concomitant
reductions in gross margin
• The Company has burned through significant amounts of cash
• The stock has been hurt by the perception that restructuring in France
is difficult, if not impossible
• Banque PSA was downgraded in 2012 because of rating agency
concerns about the parent and Banque PSA’s wholesale funding
• All of this disruption is taking place as the Company is refreshing its
portfolio globally at the fastest pace in its history
Management Is Exploiting The Sense Of
Urgency To Move Boldly
• The Peugeot family has signaled its willingness to cede control,
enabling a sale of several key non-core businesses
• The 57% stake in Faurecia
• Banque PSA
• The remaining 25% stake in the logistics business
• The Company is engaged in a massive push to refresh its
product portfolio, coinciding with their move to shift its mix into the
higher-priced, higher margin portions of the market and its target
of having more than 50% of units sold ex-Europe
• They Company is right-sizing production in Europe with the
elimination of the manufacturing facility at Aulnay and significant
cuts at the facility at Rennes, with a goal of obtaining 100%
utilization in 3 years
• The Company obtained an EC-sanctioned guarantee from the
French government for E7B of bonds to be issued by Banque
PSA, which guarantee then enabled the refinancing of a further
E11.5B of credit lines
• The Company is ahead of target for the first of its restructuring
programs delivering E1.2B of cost savings vs. a targeted E1B
and it is on track for a further E1.5B improvement in free cash
flow with its second program, targeting free cash flow breakeven
by YE14
• There are signs that European demand may be stabilizing
8. Point Frederick CapitalPoint Frederick Capital
No representation is made that the Investment manager’s or the Fund’s investment process, investment strategies, goals or risk
management techniques will or are likely to be achieved or be successful. See Important Information on Page 2.
Presentation for: Chand Sooran
8
When Does This Play Out?
A Number Of Key Catalysts Could Boost The Stock In The Next Six Months
• On 7/30/13, the EC approved the French government guarantee program for Banque PSA
• The WSJ reported on the possibility of a sale of the Russian assets on 7/30/13 to Dongfeng, one
of Peugeot’s Chinese partners (http://on.wsj.com/162Cmo0)
• The company released better than expected earnings and made more constructive comments in
its earnings release of 7/31/13
• There has been persistent talk of potential interest in Banque PSA from European banks looking
to ramp up their consumer credit businesses, including notably Banco Santander
(http://reut.rs/14y2YjA)
• A sale or spinoff of the Faurecia stake would be a natural step that would provide cash, in
addition to de-consolidating Faurecia’s net debt
• The stock is one of the most heavily shorted in Europe suggesting that the rising possibility of any
of these events might lead to a steady supporting bid from speculators covering shorts
(http://bit.ly/17WA8aV)
• The Company may announce further moves to rationalize capacity in Europe, accelerating the
move to 100% capacity utilization, or offsetting persistent European weakness
(http://reut.rs/15bcedQ)
• The German election in September 2013 may be the trigger for a German softening on austerity
in the Eurozone, with direct benefit to France, Spain and Italy
9. Point Frederick CapitalPoint Frederick Capital
No representation is made that the Investment manager’s or the Fund’s investment process, investment strategies, goals or risk
management techniques will or are likely to be achieved or be successful. See Important Information on Page 2.
Presentation for: Chand Sooran
9
What Does The Red Team Analysis Suggest How This Could
Go Wrong?
Europe takes a fresh leg down, leading to a drop in
utilization rates faster than the Company can
rationalize capacity, in turn creating a massive cash
burn that requires a fresh rights offering or risks a
liquidity crisis
There is an outbreak of widespread, disruptive labor
strife in Europe, particularly in France and Spain,
cutting sales drastically and provoking a cash crisis
Peugeot’s new products fail to gain traction in the
market and the Company endures fresh market share
losses, imperiling the target for capacity utilization and
“upscaling” of the brand and leading to permanent
brand damage
Chinese demand collapses as the new Chinese
government is unable to navigate the transition from
infrastructure-led growth to consumer-led growth
10. Point Frederick CapitalPoint Frederick Capital
No representation is made that the Investment manager’s or the Fund’s investment process, investment strategies, goals or risk
management techniques will or are likely to be achieved or be successful. See Important Information on Page 2.
Presentation for: Chand Sooran
10
What Is The Market Missing?
The market is too pessimistic about the potential for
labor restructuring in France. Renault has already
exploited French labor reform laws enacted at the
beginning of 2013, forced upon the government as a
concession in negotiations on extending French
sovereign deficit compliance.
The market ignores the value of the JVs because they
are equity investments, overly discounting the higher
margin growth particularly from the Dongfeng and
CAPSA JVs in China.
Investors (especially American investors) are
remarkably pessimistic about the potential for a turn in
Southern European auto demand. The Company
does not require a turn, only a stabilization. However,
should Europe improve, Peugeot is the most
leveraged to exploit any nascent recovery.
Management may be much more effective, in the
French context, than investors understand. The C-
suite can exploit the French political context as
Hollande is forced to accommodate industry.
11. Point Frederick CapitalPoint Frederick Capital
No representation is made that the Investment manager’s or the Fund’s investment process, investment strategies, goals or risk
management techniques will or are likely to be achieved or be successful. See Important Information on Page 2.
Presentation for: Chand Sooran
11
Upside Is Predicated On Meeting Current Restructuring
Targets And Continued Emerging Markets Growth
Metric Multiple Discount EV
Automotive 2014E Rev 40,406 0.20x 8,081
Faurecia 57.18% Stake Mkt Cap 2,260 57.18% 0% 1,292
Banque PSA BV 3,240 0.9x 2,916
Equity Investments (ex-Faurecia) BV 1,449 1.0x 1,449
Other Financial Assets BV 760 0.9x 684
Total 14,422
Less: Industrials Debt (ex-Faurecia) (9,871)
Plus: Industrials Cash (ex-Faurecia) 7,442
Less: Minority Interest (720)
Less: Tax-effected Unfunded Pension Liability (566)
Less: Assumed Remaining Cash Restructuring Costs (773)
Peugeot SA Equity Value 9,934
# of SH 342.1
Peugeot SA Equity Value per SH € 29.04
Last Price € 9.57
Upside 203%
12. Point Frederick CapitalPoint Frederick Capital
No representation is made that the Investment manager’s or the Fund’s investment process, investment strategies, goals or risk
management techniques will or are likely to be achieved or be successful. See Important Information on Page 2.
Presentation for: Chand Sooran
12
The Downside Conservatively Values The Automotive
Business To Create A 4.6x Reward/Risk Ratio
Segment Metric Multiple Discount EV
Automotive 2014E Rev 38,694 0.05x 1,935
Faurecia 57.18% Stake Mkt Cap 2,260 57.18% 20% 1,034
Banque PSA BV 3,240 0.6x 1,944
Equity Investments (ex-Faurecia) BV 1,449 0.7x 1,014
Other Financial Assets BV 760 0.5x 380
Total 6,307
Less: Industrials Debt (ex-Faurecia) (9,871)
Plus: Industrials Cash (ex-Faurecia) 7,442
Less: Minority Interest (720)
Less: Tax-effected Unfunded Pension Liability (566)
Less: Assumed Remaining Cash Restructuring Costs (773)
Peugeot SA Equity Value 1,819
# of SH 342.1
Peugeot SA Equity Value per SH € 5.32
Last Price € 9.57
Downside -44%
13. Point Frederick CapitalPoint Frederick Capital
No representation is made that the Investment manager’s or the Fund’s investment process, investment strategies, goals or risk
management techniques will or are likely to be achieved or be successful. See Important Information on Page 2.
Presentation for: Chand Sooran
13
After The Rights Offering And Refinancing Activity Of 2012,
Liquidity Is Healthy
LIQUIDITY 2010 2011 2012 H113
Cash and Cash Equivalents 9,278 5,190 5,421 8,070
Current & Non-current Financial Assets 1,102 1,052 1,903 489
Total Cash-like Assets 10,380 6,242 7,324 8,559
Back-up Facility (undrawn) - Excluding Faurecia 2,400 2,400 2,400 2,400
Back-up Facility (undrawn) - Faurecia 505 660 850 800
Total Back-up Facilities (undrawn) 2,905 3,060 3,250 3,200
Total "Financial Security" 13,285 9,302 10,574 11,759
Net Debt 1,236 3,359 3,158 3,321
Total Equity 14,303 14,494 10,557 9,559
Gearing (Net Debt/Equity) 8.6% 23.2% 29.9% 16.5%
Reference: Company
14. Point Frederick CapitalPoint Frederick Capital
No representation is made that the Investment manager’s or the Fund’s investment process, investment strategies, goals or risk
management techniques will or are likely to be achieved or be successful. See Important Information on Page 2.
Presentation for: Chand Sooran
14
Management Has Managed The Industrial Debt Maturity
Profile Actively
Reference: Company
16. Strictly Confidential August 2013
Point Frederick CapitalPoint Frederick Capital
Appendix A: Additional Business Information
17. Point Frederick CapitalPoint Frederick Capital
No representation is made that the Investment manager’s or the Fund’s investment process, investment strategies, goals or risk
management techniques will or are likely to be achieved or be successful. See Important Information on Page 2.
Presentation for: Chand Sooran
Conservative Projections Of Growth Shows The Majority Of
Units Being Sold Ex-Europe By Year End 2014
-
200
400
600
800
1,000
1,200
Quarterly Units Sold Have Stabilized Because
Of Growth Ex-Europe
Europe
Ex-Europe
Total
Reference: Company, Point Frederick Capital
18. Point Frederick CapitalPoint Frederick Capital
No representation is made that the Investment manager’s or the Fund’s investment process, investment strategies, goals or risk
management techniques will or are likely to be achieved or be successful. See Important Information on Page 2.
Presentation for: Chand Sooran
18
Market Share Has Been Hit By The Company’s
Disproportionate Exposure To Southern Europe
Market Share by Region 2007 2008 2009 2010 2011 2012 H113
Europe 13.6% 13.6% 13.8% 14.2% 13.3% 12.7% 12.2%
China 3.4% 3.5% 3.8%
LatAm 5.5% 4.8% 5.1%
Russia 2.7% 2.6% 2.4%
The Market In Southern Europe Is Improving
If Southern Europe Turns Up, So Will Peugeot’s European Market Share
Reference: Company, Point Frederick Capital
Market for Cars and LCV - Change % yoy 2011 2012 H111 H211 H112 H113
Europe 30 0% -9% -1% 0% -7% -7%
Italy -10% -21% -12% -8% -21% -11%
France -1% -13% 2% -5% -13% -11%
Spain -17% -15% -25% -4% -10% -5%
UK -2% 4% -4% 0% 1% 10%
Germany 9% -3% 11% 8% 1% -8%
China 7% 7% 10% 2% 7% 16%
LatAm 8% 6% 13% 3% 2% 6%
Russia 39% 11% 57% 25% 14% -6%
19. Point Frederick CapitalPoint Frederick Capital
No representation is made that the Investment manager’s or the Fund’s investment process, investment strategies, goals or risk
management techniques will or are likely to be achieved or be successful. See Important Information on Page 2.
Presentation for: Chand Sooran
19
Reference: Company, Point Frederick Capital
The Rights Offering And Asset Sales Have Helped Keep Net
Debt In Check Despite Poor (But Improving) Free Cash Flow
Free Cash Flow,
as defined by the
Company,
improved
significantly in
H113
Note the cash
restructuring
costs incurred to
date for the two
restructuring
programs (“2012”
and “Rebound
2015”).
Industrial & Commercial Net Debt 2011 2012 H113
Industrial & Commercial Net Debt - BoP (1,236) (3,359) (3,148)
Cash Flow (A) 2,596 1,235 894
Restructuring (B) - (202) (177)
Inventories (661) 339 (165)
Trade Receivables (319) (9) (727)
Trade Payables 97 (835) 986
Other Change in W/C 199 (97) 159
Total Change in W/C (684) (602) 253
CapEx & Capitalized R&D (3,713) (3,814) (1,230)
Financial Investments & Others (CAPSA) 9 (67) (77)
Net Dividends Received (132) 532 286
Real Estate - 634 -
Buyback (199) - -
GefCo - 897 -
Cash Flow from Investing (D) (4,035) (1,818) (1,021)
Free Cash Flow (A+B+C+D) (2,123) (1,387) (51)
CITER - 448 -
Capital Increase - 1,056 -
Others - 94 (122)
Total Change in Cash (2,123) 211 (173)
Industrial & Commercial Net Debt - EoP (3,359) (3,148) (3,321)
20. Point Frederick CapitalPoint Frederick Capital
No representation is made that the Investment manager’s or the Fund’s investment process, investment strategies, goals or risk
management techniques will or are likely to be achieved or be successful. See Important Information on Page 2.
Presentation for: Chand Sooran
20
Faurecia Is A Profitable, Globally Diversified Auto Parts
Supplier
FAURECIA - KEY METRICS 2011 2012 LTM
Revenues 16,190 17,365 17,865
Growth % yoy 7.3%
Recurring Operating Income 651 514 467
% of Revenues 4.0% 3.0% 2.6%
Growth % yoy -21.0%
Non-recurring Operating Income (58) (88) (92)
Operating Income 593 426 375
Net Financial Income (Expenses) (118) (196) (72)
Consolidated Net Income 413 184 102
% of Revenues 2.6% 1.1% 0.6%
Free Cash Flow 19 (539) (261)
Net Financial Position - EOP (1,391) (1,892) (1,853)
Reference: Company, Point Frederick Capital
21. Point Frederick CapitalPoint Frederick Capital
No representation is made that the Investment manager’s or the Fund’s investment process, investment strategies, goals or risk
management techniques will or are likely to be achieved or be successful. See Important Information on Page 2.
Presentation for: Chand Sooran
21
Reference: Company, Point Frederick Capital
Banque PSA Is A Well Capitalized Financing Company
Making Efforts To Diversify Its Sources Of Funding
BANQUE PSA - KEY METRICS 2011 2012 LTM
Net Banking Revenue 1,032 1,075 991
Revenues 1,902 1,910 1,819
Cost of Risk (in % of average loans) 0.49% 1.23% 1.21%
Recurring Operating Income 532 391 325
Recurring Operating Income w/o retail credit loss provisions adjustment 532 527 461
Penetration Rate 27.8% 29.8% 28.4%
# of New Contracts (Lease & Financing) 843,810 805,143 767,432
Total Outstanding Loans 24,300 23,100 22,300
# of Units 3,549,416 2,964,910 2,805,510
Distingo Passbook Savings Account Balances 780
Tier 1 Capital Ratio 13.0%
Securitization and Collateralization Ratio 18% 27% 24%
ECB Repo Eligible Assets 2,900 700
22. Strictly Confidential August 2013
Point Frederick CapitalPoint Frederick Capital
Appendix B: Restructuring Plans
23. Point Frederick CapitalPoint Frederick Capital
No representation is made that the Investment manager’s or the Fund’s investment process, investment strategies, goals or risk
management techniques will or are likely to be achieved or be successful. See Important Information on Page 2.
Presentation for: Chand Sooran
23
Reference: Company, Point Frederick Capital
The Latest Restructuring Plan Targets Free Cash Flow With
Cost Savings And Reduced Capital Expenditure
CapEx can be reduced because much of it was front-loaded with the buildup in recent years in
emerging markets. Now the Company is looking to harvest those earlier investments. Note that a
significant portion of the CapEx number is for capitalized R&D; the Company is an intellectual
powerhouse in France. Also, the Company sees $1B of benefits from the GM JV to be at run-rate
by year end 2015.
25. Point Frederick CapitalPoint Frederick Capital
No representation is made that the Investment manager’s or the Fund’s investment process, investment strategies, goals or risk
management techniques will or are likely to be achieved or be successful. See Important Information on Page 2.
Presentation for: Chand Sooran
25
The Company Is Moving Aggressively To Roll Out New
Launches
Reference: Company
26. Point Frederick CapitalPoint Frederick Capital
No representation is made that the Investment manager’s or the Fund’s investment process, investment strategies, goals or risk
management techniques will or are likely to be achieved or be successful. See Important Information on Page 2.
Presentation for: Chand Sooran
26
The New Launches Target Premium, Higher Margin Positions
Reference: Company
28. Point Frederick CapitalPoint Frederick Capital
No representation is made that the Investment manager’s or the Fund’s investment process, investment strategies, goals or risk
management techniques will or are likely to be achieved or be successful. See Important Information on Page 2.
Presentation for: Chand Sooran
28
Industry Comments Remain, Naturally, Cautious Despite
Green Shoots
"Regarding now the outlook for the rest of the year. Let's say that regarding, first, the market outlook
and regions by regions, we all know that European automotive production in the first half has been
better than expected initially, particularly in the second quarter. Nevertheless we remain cautious,
it could have been generated by, I would say, inventory management fluctuations in the OEM. So I'm
not sure it makes a trend. And for the moment, we keep, I would say, an assumption of markets
slightly negative in the second half, down around 1% which would make for Europe, globally for the
year, including Russia, something around minus 3%, minus 4% for the automotive production."
Faurecia H113 Sales Call 07/25/13
"Our order intake in Europe is now stabilizing against the previous year of 2012. We are 1.7 in the
month currently, which is a reasonable number, even though of course we would like it to be higher.
But it's stabilized against last year, that's I think the best way to summarize it … Yes, this is retail, what
I was answering to you was retail."
Renault H113 Sales Call 07/26/13
"We expect 2013total European light vehicle production to be approximately 18.4million units, also
in line with our March outlook. Both our March outlook and today's outlook include light vehicle
production of 11.9million units in Western Europe and 6.5million units in Eastern Europe."
Magna Q113 Call 5/10/13
Reference: Company, Capital IQ
29. Strictly Confidential August 2013
Point Frederick CapitalPoint Frederick Capital
Appendix E: Economic Indicators
30. Point Frederick CapitalPoint Frederick Capital
No representation is made that the Investment manager’s or the Fund’s investment process, investment strategies, goals or risk
management techniques will or are likely to be achieved or be successful. See Important Information on Page 2.
Presentation for: Chand Sooran
30
Economic Indicators In Europe Look Surprisingly Positive
Reference: Markit http://www.markiteconomics.com/Survey/Page.mvc/PressReleases
31. Point Frederick CapitalPoint Frederick Capital
No representation is made that the Investment manager’s or the Fund’s investment process, investment strategies, goals or risk
management techniques will or are likely to be achieved or be successful. See Important Information on Page 2.
Presentation for: Chand Sooran
31
Reference: Financial Times http://www.ft.com/intl/cms/s/0/2e0ae73e-f9c3-11e2-b8ef-00144feabdc0.html#axzz2aklrFhYZ
Could Unemployment In Europe Be Peaking, Admittedly At
Extremely High Levels?
32. Point Frederick CapitalPoint Frederick Capital
No representation is made that the Investment manager’s or the Fund’s investment process, investment strategies, goals or risk
management techniques will or are likely to be achieved or be successful. See Important Information on Page 2.
Presentation for: Chand Sooran
32
European Consumer Confidence Is Still Below Average,
But It Is Bouncing
Reference: European Commission http://ec.europa.eu/economy_finance/db_indicators/surveys/
34. Point Frederick CapitalPoint Frederick Capital
No representation is made that the Investment manager’s or the Fund’s investment process, investment strategies, goals or risk
management techniques will or are likely to be achieved or be successful. See Important Information on Page 2.
Presentation for: Chand Sooran
34
Reference: Company, Point Frederick Capital
Company Guidance Is Likely Conservative
2012G 2013G
Company Guidance For Market Assumptions Q112 H212 Q312 Q412 Q113 Q213
Europe -5% -8% -9% -3% to -5% -5% -5%
China 7% 7% 7% 8% 8% 10%
LatAm 6% 2% 5% 2% 2% 2%
Russia 5% 9% 11% 2% 0% -5%
Operational Cash Consumption vs. 2012 Performance -50% -50%
-50% or
better
Stabilization of Net Debt at June 2012 level Yes N/A N/A N/A
Breakeven in Group Operational Free Cash Flow YE2014 YE2014 YE2014 YE2014
H113 Cash Flow:
"… the Group is targeting to reduce its consumption by at least half in 2013 and confirms the announced
trend of very significant reduction throughout 2014."
35. Strictly Confidential August 2013
Point Frederick CapitalPoint Frederick Capital
Appendix G: Base Case Financial Summary
36. Point Frederick CapitalPoint Frederick Capital
No representation is made that the Investment manager’s or the Fund’s investment process, investment strategies, goals or risk
management techniques will or are likely to be achieved or be successful. See Important Information on Page 2.
Presentation for: Chand Sooran
36
Reference: Company, Point Frederick Capital
Ex-European Unit Growth Offsets European Weakness In
The Base Case
BASE CASE SUMMARY
Units Sold 2011 2012 LTM 2013 2014
Europe 2,063 1,758 1,633 1,581 1,490
Ex-Europe 1,486 1,207 1,172 1,246 1,353
Total 3,549 2,965 2,806 2,827 2,843
Note: The end of the Iranian CKD kit assembly business in 2012
Ex-Europe % of Units Sold 41.9% 40.7% 41.8% 44.1% 47.6%
Units Growth % yoy 2011 2012 LTM 2013 2014
Europe -14.8% -10.1% -5.8%
Ex-Europe -18.8% 3.2% 8.6%
Total -16.5% -4.7% 0.6%
Automobile Division Revenue per Unit 12,033 12,917 13,114 13,279 13,612
Growth % yoy 7.4% 2.8% 2.5%
Sales and Revenue - Total 2011 2012 LTM 2013 2014
Automotive 42,710 38,299 36,791 37,534 38,694
Automotive Equipment 16,190 17,365 17,865 18,295 19,210
Transportation & Logistics - - - - -
Finance 1,902 1,910 1,819 1,701 1,883
Other 210 202 182 184 184
Eliminations (2,503) (2,330) (2,310) (2,460) (2,460)
Total 58,509 55,446 54,347 55,254 57,511
37. Point Frederick CapitalPoint Frederick Capital
No representation is made that the Investment manager’s or the Fund’s investment process, investment strategies, goals or risk
management techniques will or are likely to be achieved or be successful. See Important Information on Page 2.
Presentation for: Chand Sooran
37
Reference: Company, Point Frederick Capital
The Cost Savings And Capex Cuts Make A Significant
Difference To Free Cash Flow
BASE CASE SUMMARY 2011 2012 LTM 2013 2014
Gross Profit - Manufacturing and Sales Companies 8,736 7,079 7,028 7,546 9,085
Growth % yoy -19.0% 6.6% 20.4%
Margin % 15.3% 13.1% 13.3% 14.0% 16.2%
EBITDA - Manufacturing and Sales Companies 3,452 1,935 2,022 1,733 2,969
Growth % yoy -43.9% -10.4% 71.3%
Margin % 6.1% 3.6% 3.8% 3.2% 5.3%
EBIT - Manufacturing and Sales Companies 561 (951) (899) (539) 699
Growth % yoy
Margin % 1.0% -1.8% -1.7% -1.0% 1.2%
NOPAT - Manufacturing and Sales Companies 483 (555) (463) (222) 746
Growth % yoy
Margin % 0.8% -1.0% -0.9% -0.4% 1.3%
PF FD EPS 1.49 (2.53) (2.08) (1.27) 1.55
Growth % yoy
Free Cash Flow - Manufacturing and Sales Companies (1,769) (1,387) (990) 800 912
Growth % yoy 14.0%
Margin % -3.1% -2.6% -1.9% 1.5% 1.6%
Free Cash Flow, as defined by the Company
RNOA % 2.5% -3.9% -3.4% -1.7% 5.3%
ROE % 2.4% -8.6% -8.1% -4.9% 5.5%
38. Strictly Confidential August 2013
Point Frederick CapitalPoint Frederick Capital
Appendix H: Upside Case Financial Summary
39. Point Frederick CapitalPoint Frederick Capital
No representation is made that the Investment manager’s or the Fund’s investment process, investment strategies, goals or risk
management techniques will or are likely to be achieved or be successful. See Important Information on Page 2.
Presentation for: Chand Sooran
39
UPSIDE CASE SUMMARY
Units Sold 2011 2012 LTM 2013 2014
Europe 2,063 1,758 1,633 1,581 1,490
Ex-Europe 1,486 1,207 1,172 1,280 1,422
Total 3,549 2,965 2,806 2,861 2,912
Note: The end of the Iranian CKD kit assembly business in 2012
Ex-Europe % of Units Sold 41.9% 40.7% 41.8% 44.7% 48.8%
Units Growth % yoy 2011 2012 LTM 2013 2014
Europe -14.8% -10.1% -5.8%
Ex-Europe -18.8% 6.1% 11.1%
Total -16.5% -3.5% 1.8%
Automobile Division Revenue per Unit 12,033 12,917 13,114 13,351 13,877
Growth % yoy 7.4% 3.4% 3.9%
Sales and Revenue - Total 2011 2012 LTM 2013 2014
Automotive 42,710 38,299 36,791 38,195 40,406
Automotive Equipment 16,190 17,365 17,865 18,295 19,210
Transportation & Logistics - - - - -
Finance 1,902 1,910 1,819 1,701 1,883
Other 210 202 182 184 184
Eliminations (2,503) (2,330) (2,310) (2,460) (2,460)
Total 58,509 55,446 54,347 55,916 59,223
Reference: Company, Point Frederick Capital
The Upside Case Is More Optimistic About Unit Growth
And Pricing
40. Point Frederick CapitalPoint Frederick Capital
No representation is made that the Investment manager’s or the Fund’s investment process, investment strategies, goals or risk
management techniques will or are likely to be achieved or be successful. See Important Information on Page 2.
Presentation for: Chand Sooran
40
UPSIDE CASE SUMMARY 2011 2012 LTM 2013 2014
Gross Profit - Manufacturing and Sales Companies 8,736 7,079 7,028 7,914 9,940
Growth % yoy -19.0% 11.8% 25.6%
Margin % 15.3% 13.1% 13.3% 14.5% 17.3%
EBITDA - Manufacturing and Sales Companies 3,452 1,935 2,022 2,002 3,567
Growth % yoy -43.9% 3.5% 78.2%
Margin % 6.1% 3.6% 3.8% 3.7% 6.2%
EBIT - Manufacturing and Sales Companies 561 (951) (899) (270) 1,297
Growth % yoy
Margin % 1.0% -1.8% -1.7% -0.5% 2.3%
NOPAT - Manufacturing and Sales Companies 483 (555) (463) (34) 1,164
Growth % yoy
Margin % 0.8% -1.0% -0.9% -0.1% 2.0%
PF FD EPS 1.49 (2.53) (2.08) (0.72) 2.78
Growth % yoy
Free Cash Flow - Manufacturing and Sales Companies (1,769) (1,387) (990) 1,059 1,450
Growth % yoy 37.0%
Margin % -3.1% -2.6% -1.9% 1.9% 2.5%
Free Cash Flow, as defined by the Company
RNOA % 2.5% -3.9% -3.4% -0.3% 8.4%
ROE % 2.4% -8.6% -8.1% -2.8% 9.3%
Reference: Company, Point Frederick Capital
Leverage And Improving End Markets Make For A Dazzling
Turnaround
41. Point Frederick CapitalPoint Frederick Capital
No representation is made that the Investment manager’s or the Fund’s investment process, investment strategies, goals or risk
management techniques will or are likely to be achieved or be successful. See Important Information on Page 2.
Presentation for: Chand Sooran
Contact Information
41
Chand Sooran
Chief Investment Officer, Manager & Founding Member
chand.sooran@pointfrederickcapital.com
917.414.2921
41