Download as PDF, PPTX
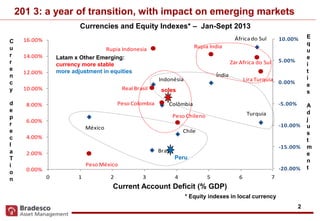
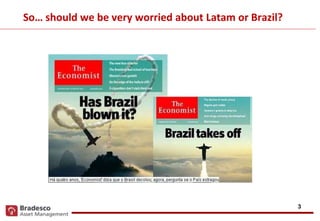

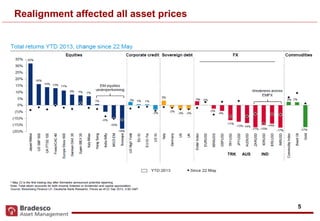
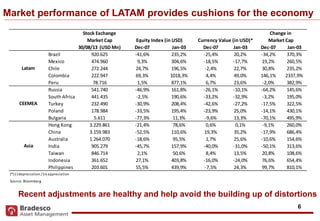
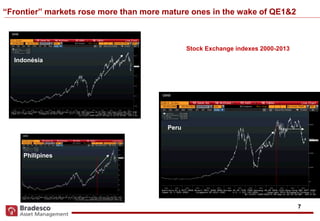
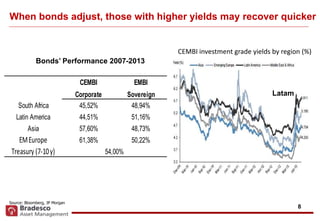
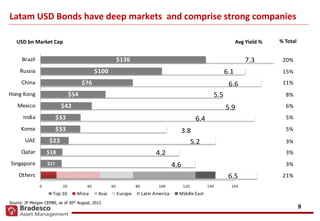
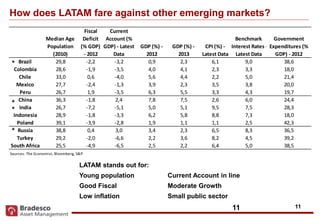
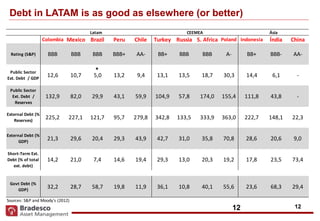
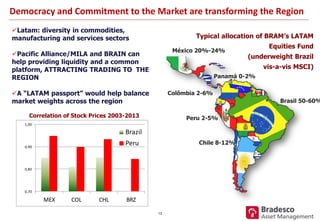
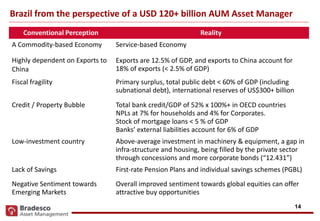
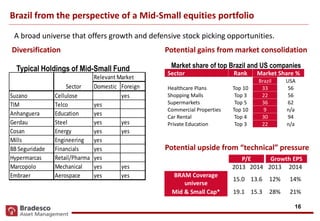


The document discusses opportunities in Latin American and emerging markets. It notes that recent adjustments in currencies and stock prices are healthy and help avoid distortions. While markets have adjusted, Latin America's economic fundamentals remain strong, with young populations, low inflation, moderate growth, and manageable debt levels. The diversity of industries in Latin America like commodities, manufacturing and services provides opportunities for investment.


