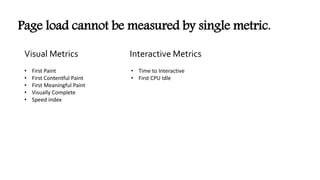
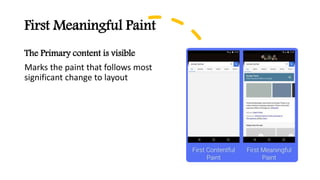
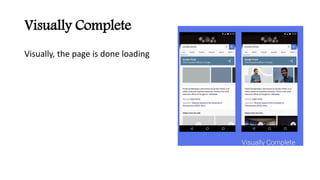
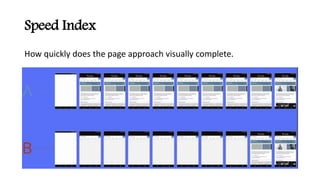
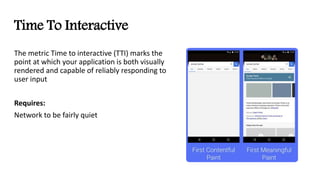
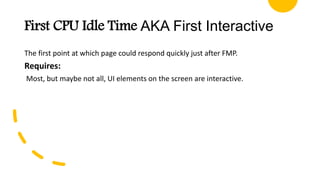
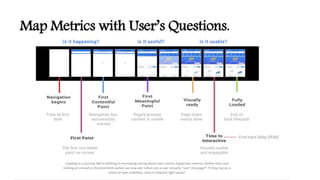
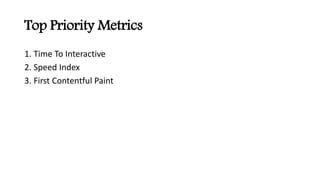
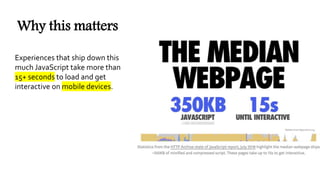
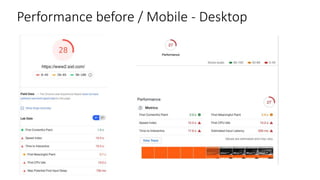
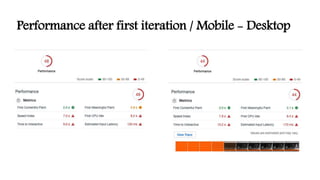
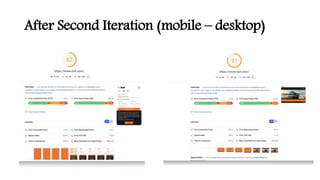
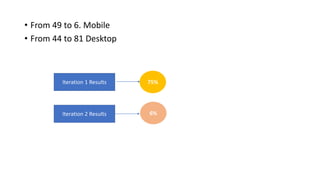
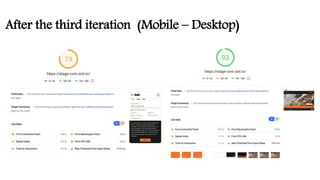
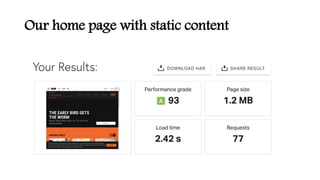
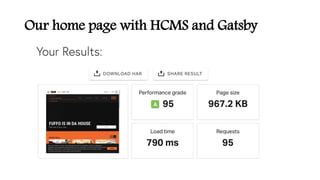
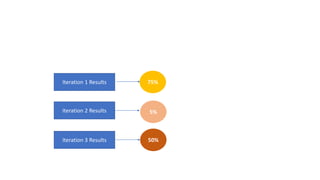
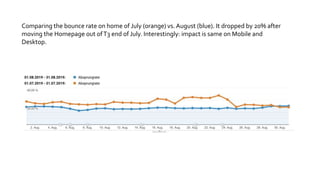
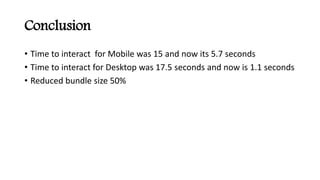
The document discusses improving the performance of a website by measuring key metrics like Time to Interactive and Speed Index. It describes optimizing the site through three iterations: reducing bundle size by 50% and eliminating duplicates; lazy loading and preloading assets; and implementing a headless CMS and static site generator. These changes reduced Time to Interactive on mobile from 15 to 5.7 seconds and desktop from 17.5 to 1.1 seconds, cutting the bounce rate by 20%. Key takeaways are measuring performance critically impacts the user experience.


![What was the ROOT Causes
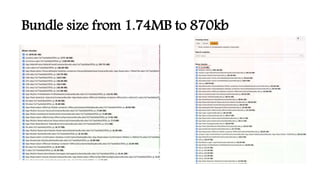
• Bundle size
• Dev bundles was shipped to production
• Dependency Duplication
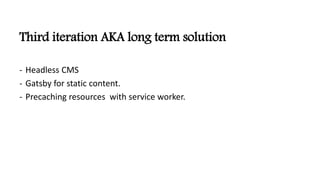
• Typo3 [ monolithic CMS] managing 40 to 50% for the performance.
- Short term solution.
- Long term solution.](https://image.slidesharecdn.com/performancepresentation-200130131729/85/Performance-presentation-22-320.jpg)


![Bundle overlaps [ Before ]
We had 228 bundles that has overlaps](https://image.slidesharecdn.com/performancepresentation-200130131729/85/Performance-presentation-26-320.jpg)
![Bundle overlaps [ After ]
From 228 to 175 overlaps. And 23 files less](https://image.slidesharecdn.com/performancepresentation-200130131729/85/Performance-presentation-27-320.jpg)

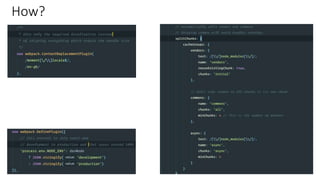
![Second Iteration AKA short term without typo3
- Rebuild the home page using vanilla JS/static html.
- Lazy loading. [IntersectionObserver]
- Preload font/styles.
- Reduce the number of requests from 259 to 71](https://image.slidesharecdn.com/performancepresentation-200130131729/85/Performance-presentation-31-320.jpg)


![[DevDay 2017] Serverless Architecture - Speaker: Trung Huynh - Software Engin...](https://cdn.slidesharecdn.com/ss_thumbnails/trunghuynh-serverless-architecture-170420104031-thumbnail.jpg?width=640&height=640&fit=bounds)


![[DevDay 2017] ReactJS Hands on - Speaker: Binh Phan - Developer at mgm techno...](https://cdn.slidesharecdn.com/ss_thumbnails/binhphanreactjs-170420085708-thumbnail.jpg?width=640&height=640&fit=bounds)


![The hunt for the unicorn performance metric [DeltaV London 2018]](https://cdn.slidesharecdn.com/ss_thumbnails/2018-deltav-unicorn-metric-180511092516-thumbnail.jpg?width=640&height=640&fit=bounds)


![Getting Started with Apache Spark: Big Data Made Simple [Free Meetup]](https://cdn.slidesharecdn.com/ss_thumbnails/apachesparkgettingstarted-260203175547-8361bcc3-thumbnail.jpg?width=640&height=640&fit=bounds)


