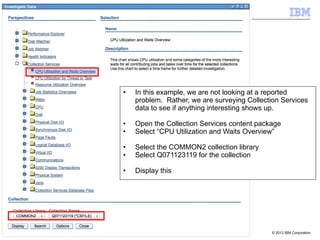
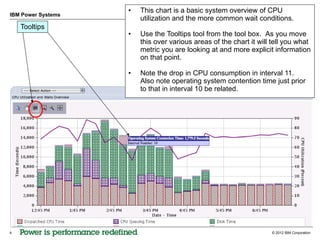
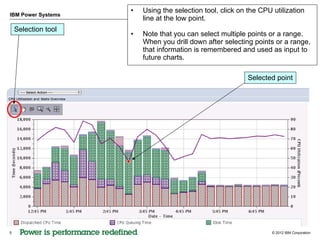
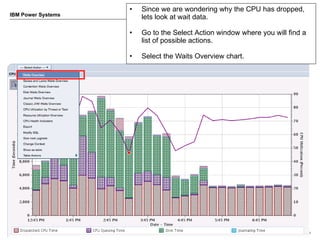
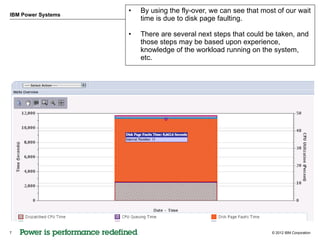
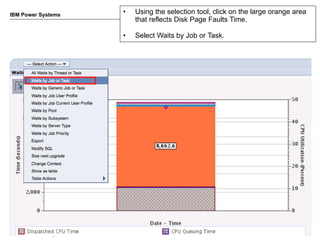
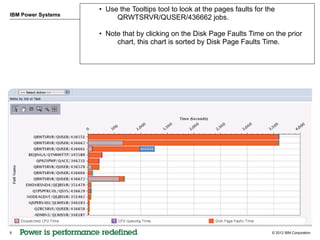
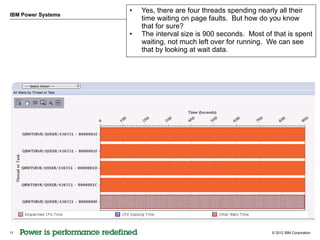
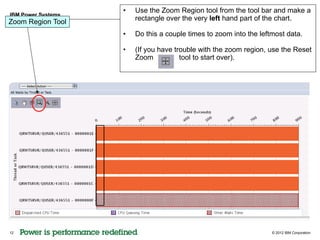
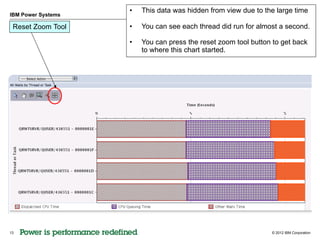
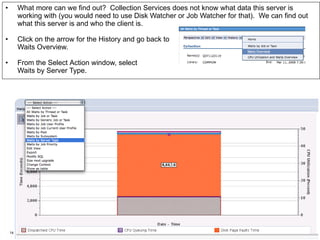
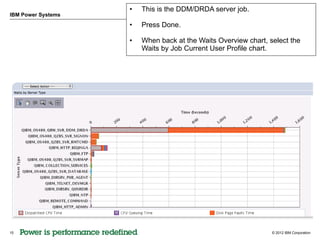
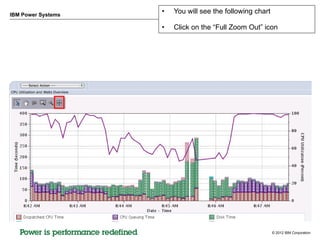
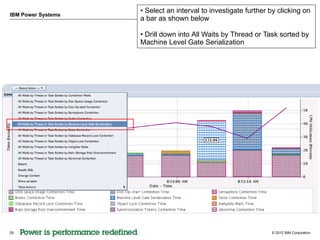
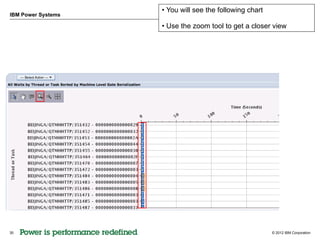
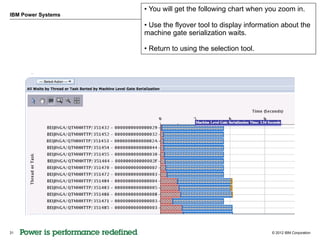
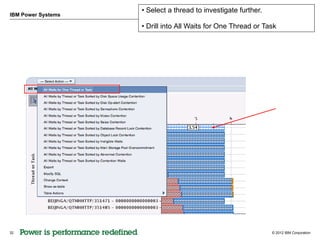
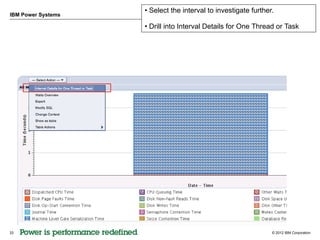
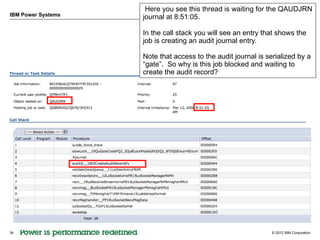
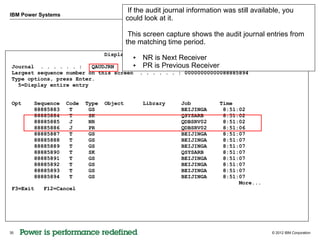
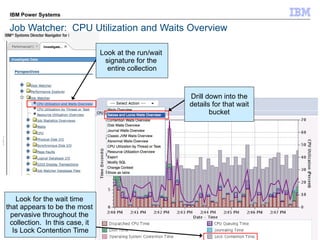
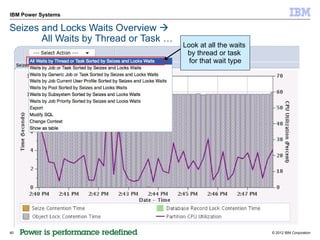
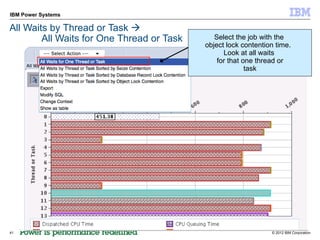
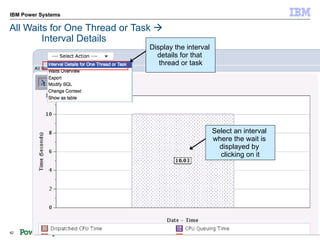
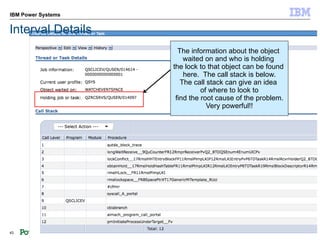
This document provides an example of using IBM's Performance Data Investigator tool to analyze collection services data from an IBM Power Systems server. The analysis identifies a period of low CPU utilization that corresponded to a rise in operating system contention. Drilling further into the wait data revealed that most wait time was due to disk page faults from a database server job. The threads of that job were each waiting over 90% of their time. The analysis then identifies the user and database that the server job was processing data for. In the end, while some issues were diagnosed, further job watcher data would be needed to fully understand the source of identified machine level gate serialization waits.