


Performance Analysis Poster
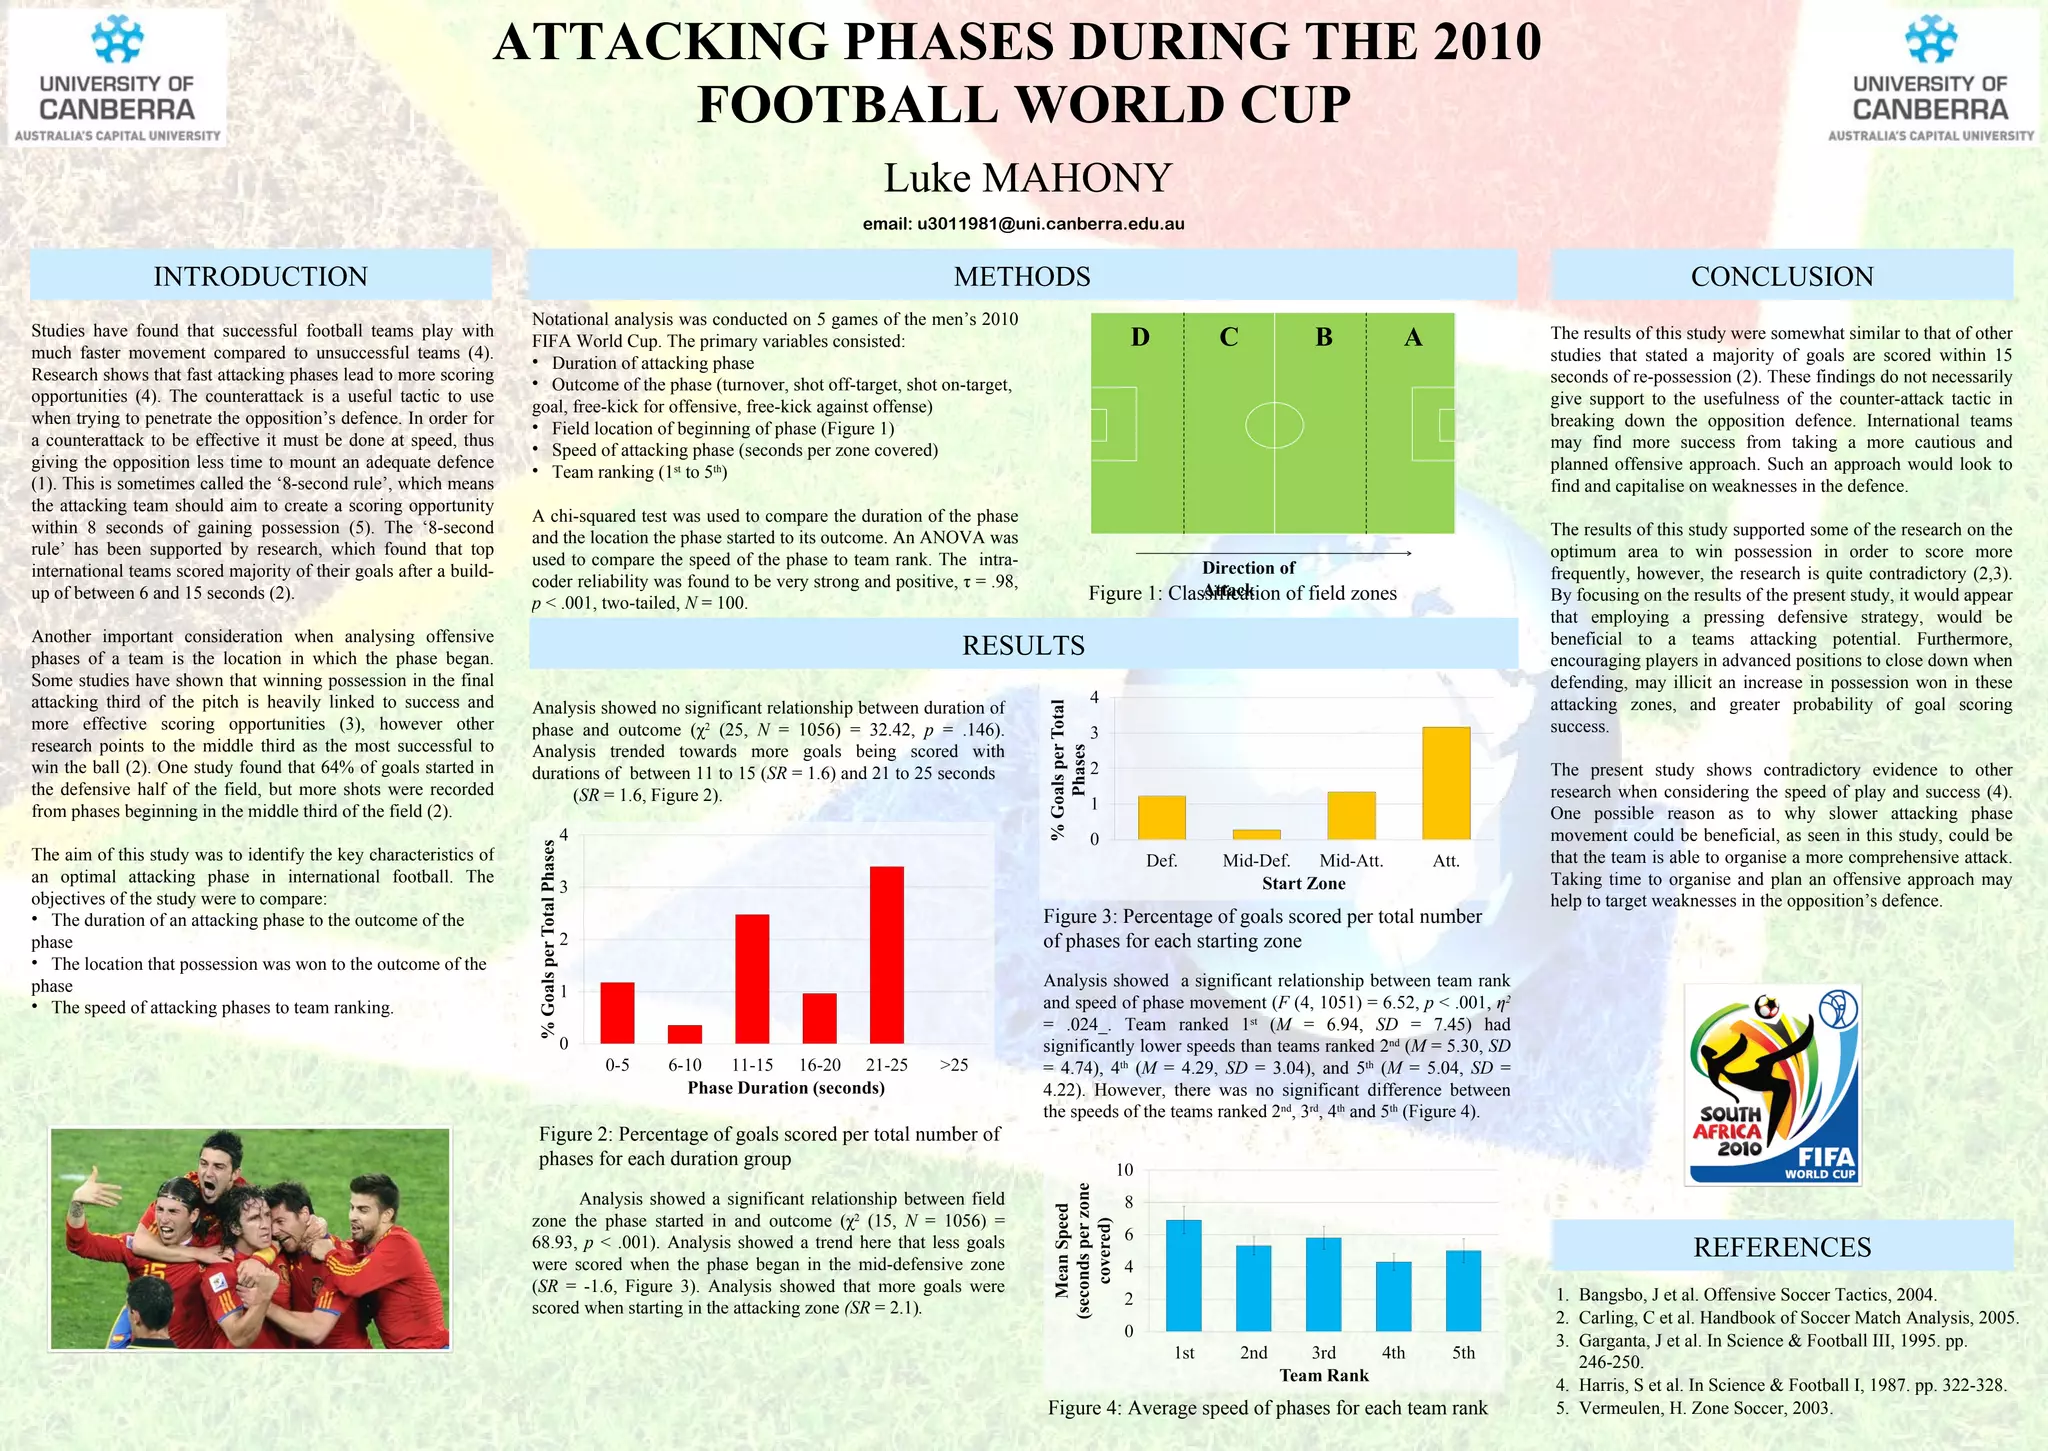
- 1. REFERENCES Bangsbo, Jet al. Offensive Soccer Tactics, 2004. Carling, C et al. Handbook of Soccer Match Analysis, 2005. Garganta, J et al. In Science & Football III, 1995. pp. 246-250. Harris, S et al. In Science & Football I, 1987. pp. 322-328. Vermeulen, H. Zone Soccer, 2003. CONCLUSION The results of this study were somewhat similar to that of other studies that stated a majority of goals are scored within 15 seconds of re-possession (2). These findings do not necessarily give support to the usefulness of the counter-attack tactic in breaking down the opposition defence. International teams may find more success from taking a more cautious and planned offensive approach. Such an approach would look to find and capitalise on weaknesses in the defence. The results of this study supported some of the research on the optimum area to win possession in order to score more frequently, however, the research is quite contradictory (2,3). By focusing on the results of the present study, it would appear that employing a pressing defensive strategy, would be beneficial to a teams attacking potential. Furthermore, encouraging players in advanced positions to close down when defending, may illicit an increase in possession won in these attacking zones, and greater probability of goal scoring success. The present study shows contradictory evidence to other research when considering the speed of play and success (4). One possible reason as to why slower attacking phase movement could be beneficial, as seen in this study, could be that the team is able to organise a more comprehensive attack. Taking time to organise and plan an offensive approach may help to target weaknesses in the opposition’s defence. METHODS INTRODUCTION Studies have found that successful football teams play with much faster movement compared to unsuccessful teams (4). Research shows that fast attacking phases lead to more scoring opportunities (4). The counterattack is a useful tactic to use when trying to penetrate the opposition’s defence. In order for a counterattack to be effective it must be done at speed, thus giving the opposition less time to mount an adequate defence (1). This is sometimes called the ‘8-second rule’, which means the attacking team should aim to create a scoring opportunity within 8 seconds of gaining possession (5). The ‘8-second rule’ has been supported by research, which found that top international teams scored majority of their goals after a build-up of between 6 and 15 seconds (2). Another important consideration when analysing offensive phases of a team is the location in which the phase began. Some studies have shown that winning possession in the final attacking third of the pitch is heavily linked to success and more effective scoring opportunities (3), however other research points to the middle third as the most successful to win the ball (2). One study found that 64% of goals started in the defensive half of the field, but more shots were recorded from phases beginning in the middle third of the field (2). The aim of this study was to identify the key characteristics of an optimal attacking phase in international football. The objectives of the study were to compare: The duration of an attacking phase to the outcome of the phase The location that possession was won to the outcome of the phase The speed of attacking phases to team ranking. Notational analysis was conducted on 5 games of the men’s 2010 FIFA World Cup. The primary variables consisted: Duration of attacking phase Outcome of the phase (turnover, shot off-target, shot on-target, goal, free-kick for offensive, free-kick against offense) Field location of beginning of phase (Figure 1) Speed of attacking phase (seconds per zone covered) Team ranking (1 st to 5 th ) A chi-squared test was used to compare the duration of the phase and the location the phase started to its outcome. An ANOVA was used to compare the speed of the phase to team rank. The intra-coder reliability was found to be very strong and positive, τ = .98, p < .001, two-tailed, N = 100. Luke MAHONY ATTACKING PHASES DURING THE 2010 FOOTBALL WORLD CUP Analysis showed no significant relationship between duration of phase and outcome (χ 2 (25, N = 1056) = 32.42, p = .146). Analysis trended towards more goals being scored with durations of between 11 to 15 ( SR = 1.6) and 21 to 25 seconds ( SR = 1.6, Figure 2). Analysis showed a significant relationship between team rank and speed of phase movement ( F (4, 1051) = 6.52, p < .001, η 2 = .024_. Team ranked 1 st ( M = 6.94, SD = 7.45) had significantly lower speeds than teams ranked 2 nd ( M = 5.30, SD = 4.74), 4 th ( M = 4.29, SD = 3.04), and 5 th ( M = 5.04, SD = 4.22). However, there was no significant difference between the speeds of the teams ranked 2 nd , 3 rd , 4 th and 5 th (Figure 4). email: u3011981@uni.canberra.edu.au Figure 3: Percentage of goals scored per total number of phases for each starting zone Figure 2: Percentage of goals scored per total number of phases for each duration group Direction of Attack Figure 1: Classification of field zones RESULTS D C B A Analysis showed a significant relationship between field zone the phase started in and outcome (χ 2 (15, N = 1056) = 68.93, p < .001). Analysis showed a trend here that less goals were scored when the phase began in the mid-defensive zone ( SR = -1.6, Figure 3). Analysis showed that more goals were scored when starting in the attacking zone (SR = 2.1) . Figure 4: Average speed of phases for each team rank