Pennsylvania County & Municipality Disbursements from 2013 Marcellus Impact Fee Revenue
•
2 likes•1,097 views

In 2012 PA passed Act 13, which updated shale drilling rules in the state and provided for a tax/fee. Revenues raised from the fee are distributed 60% to the local towns and counties where drilling occurs--where there is an impact. The other 40% goes to Harrisburg politicans as Monopoly money to distribute to their cronies as they see fit. The price to be paid in a corrupt political system.

Recommended
More Related Content
What's hot
What's hot (20)
Viewers also liked
Viewers also liked (8)
Similar to Pennsylvania County & Municipality Disbursements from 2013 Marcellus Impact Fee Revenue
Similar to Pennsylvania County & Municipality Disbursements from 2013 Marcellus Impact Fee Revenue (20)
More from Marcellus Drilling News
More from Marcellus Drilling News (20)
Recently uploaded
Recently uploaded (9)
Pennsylvania County & Municipality Disbursements from 2013 Marcellus Impact Fee Revenue
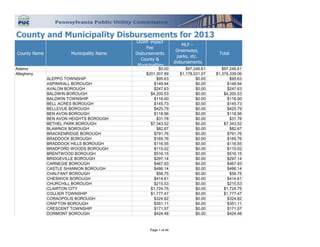
- 1. County Name Municipality Name UGWF impact Fee Disbursements County & Municipalities MLF - Greenways, parks, etc. disbursements Total Adams $0.00 $97,246.61 $97,246.61 $201,307.99 $1,178,031.07 $1,379,339.06 ALEPPO TOWNSHIP $95.63 $0.00 $95.63 ASPINWALL BOROUGH $149.94 $0.00 $149.94 AVALON BOROUGH $247.63 $0.00 $247.63 BALDWIN BOROUGH $4,200.53 $0.00 $4,200.53 BALDWIN TOWNSHIP $116.00 $0.00 $116.00 BELL ACRES BOROUGH $145.73 $0.00 $145.73 BELLEVUE BOROUGH $425.79 $0.00 $425.79 BEN AVON BOROUGH $118.56 $0.00 $118.56 BEN AVON HEIGHTS BOROUGH $31.78 $0.00 $31.78 BETHEL PARK BOROUGH $7,343.52 $0.00 $7,343.52 BLAWNOX BOROUGH $82.67 $0.00 $82.67 BRACKENRIDGE BOROUGH $791.76 $0.00 $791.76 BRADDOCK BOROUGH $169.76 $0.00 $169.76 BRADDOCK HILLS BOROUGH $116.55 $0.00 $116.55 BRADFORD WOODS BOROUGH $115.02 $0.00 $115.02 BRENTWOOD BOROUGH $516.15 $0.00 $516.15 BRIDGEVILLE BOROUGH $297.14 $0.00 $297.14 CARNEGIE BOROUGH $467.93 $0.00 $467.93 CASTLE SHANNON BOROUGH $486.14 $0.00 $486.14 CHALFANT BOROUGH $58.75 $0.00 $58.75 CHESWICK BOROUGH $414.61 $0.00 $414.61 CHURCHILL BOROUGH $215.53 $0.00 $215.53 CLAIRTON CITY $1,724.75 $0.00 $1,724.75 COLLIER TOWNSHIP $1,777.47 $0.00 $1,777.47 CORAOPOLIS BOROUGH $324.82 $0.00 $324.82 CRAFTON BOROUGH $351.11 $0.00 $351.11 CRESCENT TOWNSHIP $171.57 $0.00 $171.57 DORMONT BOROUGH $424.48 $0.00 $424.48 County and Municipality Disbursements for 2013 Allegheny Page 1 of 44
- 2. County and Municipality Disbursements for 2013 DRAVOSBURG BOROUGH $111.19 $0.00 $111.19 DUQUESNE CITY $349.59 $0.00 $349.59 EAST DEER TOWNSHIP $334.47 $0.00 $334.47 EAST MCKEESPORT BOROUGH $130.16 $0.00 $130.16 EAST PITTSBURGH BOROUGH $100.67 $0.00 $100.67 EDGEWOOD BOROUGH $186.57 $0.00 $186.57 EDGEWORTH BOROUGH $139.63 $0.00 $139.63 ELIZABETH BOROUGH $399.09 $0.00 $399.09 ELIZABETH TOWNSHIP $3,262.68 $0.00 $3,262.68 EMSWORTH BOROUGH $151.40 $0.00 $151.40 ETNA BOROUGH $208.25 $0.00 $208.25 FAWN TOWNSHIP $47,335.07 $0.00 $47,335.07 FINDLAY TOWNSHIP $8,440.33 $0.00 $8,440.33 FOREST HILLS BOROUGH $405.09 $0.00 $405.09 FORWARD TOWNSHIP $54,621.33 $0.00 $54,621.33 FOX CHAPEL BOROUGH $1,952.19 $0.00 $1,952.19 FRANKLIN PARK BOROUGH $900.26 $0.00 $900.26 FRAZER TOWNSHIP $100,477.68 $0.00 $100,477.68 GLASSPORT BOROUGH $1,037.26 $0.00 $1,037.26 GLEN OSBORNE BOROUGH $45.46 $0.00 $45.46 GLENFIELD BOROUGH $22.86 $0.00 $22.86 GREEN TREE BOROUGH $296.18 $0.00 $296.18 HAMPTON TOWNSHIP $1,275.99 $0.00 $1,275.99 HARMAR TOWNSHIP $767.52 $0.00 $767.52 HARRISON TOWNSHIP $2,527.88 $0.00 $2,527.88 HAYSVILLE BOROUGH $7.56 $0.00 $7.56 HEIDELBERG BOROUGH $98.77 $0.00 $98.77 HOMESTEAD BOROUGH $177.66 $0.00 $177.66 INDIANA TOWNSHIP $1,909.93 $0.00 $1,909.93 INGRAM BOROUGH $192.81 $0.00 $192.81 JEFFERSON HILLS BOROUGH $2,737.95 $0.00 $2,737.95 KENNEDY TOWNSHIP $469.91 $0.00 $469.91 KILBUCK TOWNSHIP $78.63 $0.00 $78.63 LEET TOWNSHIP $93.93 $0.00 $93.93 LEETSDALE BOROUGH $106.79 $0.00 $106.79 LIBERTY BOROUGH $652.46 $0.00 $652.46 Page 2 of 44
- 3. County and Municipality Disbursements for 2013 LINCOLN BOROUGH $280.45 $0.00 $280.45 MARSHALL TOWNSHIP $2,301.39 $0.00 $2,301.39 MCCANDLESS TOWNSHIP $1,801.05 $0.00 $1,801.05 MCDONALD BOROUGH $96.91 $0.00 $96.91 MCKEES ROCKS BOROUGH $357.88 $0.00 $357.88 MCKEESPORT CITY $4,972.03 $0.00 $4,972.03 MILLVALE BOROUGH $195.19 $0.00 $195.19 MONROEVILLE BOROUGH $1,759.77 $0.00 $1,759.77 MOON TOWNSHIP $5,298.14 $0.00 $5,298.14 MT LEBANON TOWNSHIP $1,789.52 $0.00 $1,789.52 MT OLIVER BOROUGH $180.65 $0.00 $180.65 MUNHALL BOROUGH $638.87 $0.00 $638.87 NEVILLE TOWNSHIP $65.99 $0.00 $65.99 NORTH BRADDOCK BOROUGH $372.41 $0.00 $372.41 NORTH FAYETTE TOWNSHIP $3,056.84 $0.00 $3,056.84 NORTH VERSAILLES TOWNSHIP $694.37 $0.00 $694.37 O'HARA TOWNSHIP $2,292.05 $0.00 $2,292.05 OAKDALE BOROUGH $352.70 $0.00 $352.70 OAKMONT BOROUGH $1,461.19 $0.00 $1,461.19 OHIO TOWNSHIP $364.71 $0.00 $364.71 PENN HILLS TOWNSHIP $9,098.56 $0.00 $9,098.56 PENNSBURY VILLAGE BOROUGH $35.15 $0.00 $35.15 PINE TOWNSHIP $3,480.84 $0.00 $3,480.84 PITCAIRN BOROUGH $184.21 $0.00 $184.21 PITTSBURGH CITY $17,474.42 $0.00 $17,474.42 PLEASANT HILLS BOROUGH $1,776.43 $0.00 $1,776.43 PLUM BOROUGH $6,355.40 $0.00 $6,355.40 PORT VUE BOROUGH $258.43 $0.00 $258.43 RANKIN BOROUGH $116.66 $0.00 $116.66 RESERVE TOWNSHIP $188.94 $0.00 $188.94 RICHLAND TOWNSHIP $3,382.37 $0.00 $3,382.37 ROBINSON TOWNSHIP $847.05 $0.00 $847.05 ROSS TOWNSHIP $1,877.61 $0.00 $1,877.61 ROSSLYN FARMS BOROUGH $56.21 $0.00 $56.21 SCOTT TOWNSHIP $874.67 $0.00 $874.67 SEWICKLEY BOROUGH $254.23 $0.00 $254.23 Page 3 of 44
- 4. County and Municipality Disbursements for 2013 SEWICKLEY HEIGHTS BOROUGH $84.75 $0.00 $84.75 SEWICKLEY HILLS BOROUGH $38.95 $0.00 $38.95 SHALER TOWNSHIP $1,782.77 $0.00 $1,782.77 SHARPSBURG BOROUGH $171.68 $0.00 $171.68 SOUTH FAYETTE TOWNSHIP $3,406.09 $0.00 $3,406.09 SOUTH PARK TOWNSHIP $3,006.17 $0.00 $3,006.17 SOUTH VERSAILLES TOWNSHIP $196.29 $0.00 $196.29 SPRINGDALE BOROUGH $866.61 $0.00 $866.61 SPRINGDALE TOWNSHIP $372.08 $0.00 $372.08 STOWE TOWNSHIP $360.16 $0.00 $360.16 SWISSVALE BOROUGH $490.77 $0.00 $490.77 TARENTUM BOROUGH $1,105.96 $0.00 $1,105.96 THORNBURG BOROUGH $45.17 $0.00 $45.17 TRAFFORD BOROUGH $6.68 $0.00 $6.68 TURTLE CREEK BOROUGH $321.95 $0.00 $321.95 UPPER ST CLAIR TOWNSHIP $4,850.97 $0.00 $4,850.97 VERONA BOROUGH $569.09 $0.00 $569.09 VERSAILLES BOROUGH $367.07 $0.00 $367.07 WALL BOROUGH $50.84 $0.00 $50.84 WEST DEER TOWNSHIP $3,454.55 $0.00 $3,454.55 WEST ELIZABETH BOROUGH $187.50 $0.00 $187.50 WEST HOMESTEAD BOROUGH $131.40 $0.00 $131.40 WEST MIFFLIN BOROUGH $1,237.80 $0.00 $1,237.80 WEST VIEW BOROUGH $374.71 $0.00 $374.71 WHITAKER BOROUGH $79.68 $0.00 $79.68 WHITE OAK BOROUGH $2,045.56 $0.00 $2,045.56 WHITEHALL BOROUGH $2,877.54 $0.00 $2,877.54 WILKINS TOWNSHIP $414.55 $0.00 $414.55 WILKINSBURG BOROUGH $860.17 $0.00 $860.17 WILMERDING BOROUGH $141.73 $0.00 $141.73 $597,430.18 $65,553.92 $662,984.10 APOLLO BOROUGH $6,864.44 $0.00 $6,864.44 APPLEWOLD BOROUGH $1,293.11 $0.00 $1,293.11 ATWOOD BOROUGH $1,331.66 $0.00 $1,331.66 BETHEL TOWNSHIP $8,271.68 $0.00 $8,271.68 BOGGS TOWNSHIP $49,047.87 $0.00 $49,047.87 Armstrong Page 4 of 44
- 5. County and Municipality Disbursements for 2013 BRADYS BEND TOWNSHIP $5,554.76 $0.00 $5,554.76 BURRELL TOWNSHIP $21,390.54 $0.00 $21,390.54 CADOGAN TOWNSHIP $1,547.40 $0.00 $1,547.40 COWANSHANNOCK TOWNSHIP $40,619.93 $0.00 $40,619.93 DAYTON BOROUGH $1,261.30 $0.00 $1,261.30 EAST FRANKLIN TOWNSHIP $76,752.41 $0.00 $76,752.41 ELDERTON BOROUGH $1,901.09 $0.00 $1,901.09 FORD CITY BOROUGH $12,779.64 $0.00 $12,779.64 FORD CLIFF BOROUGH $1,714.81 $0.00 $1,714.81 FREEPORT BOROUGH $7,170.56 $0.00 $7,170.56 GILPIN TOWNSHIP $27,902.13 $0.00 $27,902.13 HOVEY TOWNSHIP $956.64 $0.00 $956.64 KISKIMINETAS TOWNSHIP $27,711.33 $0.00 $27,711.33 KITTANNING BOROUGH $15,931.87 $0.00 $15,931.87 KITTANNING TOWNSHIP $78,363.53 $0.00 $78,363.53 LEECHBURG BOROUGH $9,267.10 $0.00 $9,267.10 MADISON TOWNSHIP $17,116.74 $0.00 $17,116.74 MAHONING TOWNSHIP $11,595.07 $0.00 $11,595.07 MANOR TOWNSHIP $95,563.18 $0.00 $95,563.18 MANORVILLE BOROUGH $1,723.12 $0.00 $1,723.12 NORTH APOLLO BOROUGH $2,851.98 $0.00 $2,851.98 NORTH BUFFALO TOWNSHIP $82,691.44 $0.00 $82,691.44 PARKER CITY $3,726.16 $0.00 $3,726.16 PARKS TOWNSHIP $13,985.73 $0.00 $13,985.73 PERRY TOWNSHIP $6,087.50 $0.00 $6,087.50 PINE TOWNSHIP $2,815.27 $0.00 $2,815.27 PLUMCREEK TOWNSHIP $75,862.71 $0.00 $75,862.71 RAYBURN TOWNSHIP $90,068.03 $0.00 $90,068.03 REDBANK TOWNSHIP $20,113.53 $0.00 $20,113.53 RURAL VALLEY BOROUGH $4,232.05 $0.00 $4,232.05 SOUTH BEND TOWNSHIP $37,391.53 $0.00 $37,391.53 SOUTH BETHLEHEM BOROUGH $2,043.43 $0.00 $2,043.43 SOUTH BUFFALO TOWNSHIP $58,294.48 $0.00 $58,294.48 SUGARCREEK TOWNSHIP $27,447.25 $0.00 $27,447.25 VALLEY TOWNSHIP $6,191.51 $0.00 $6,191.51 WASHINGTON TOWNSHIP $18,099.66 $0.00 $18,099.66 Armstrong Page 5 of 44
- 6. County and Municipality Disbursements for 2013 WAYNE TOWNSHIP $18,560.43 $0.00 $18,560.43 WEST FRANKLIN TOWNSHIP $60,165.05 $0.00 $60,165.05 WEST KITTANNING BOROUGH $5,003.30 $0.00 $5,003.30 WORTHINGTON BOROUGH $2,834.09 $0.00 $2,834.09 $207,801.80 $163,139.76 $370,941.56 ALIQUIPPA CITY $3,814.42 $0.00 $3,814.42 AMBRIDGE BOROUGH $2,407.43 $0.00 $2,407.43 BADEN BOROUGH $1,592.72 $0.00 $1,592.72 BEAVER BOROUGH $3,797.28 $0.00 $3,797.28 BEAVER FALLS CITY $6,967.83 $0.00 $6,967.83 BIG BEAVER BOROUGH $9,988.34 $0.00 $9,988.34 BRIDGEWATER BOROUGH $694.71 $0.00 $694.71 BRIGHTON TOWNSHIP $14,201.91 $0.00 $14,201.91 CENTER TOWNSHIP $10,221.01 $0.00 $10,221.01 CHIPPEWA TOWNSHIP $13,811.58 $0.00 $13,811.58 CONWAY BOROUGH $1,907.69 $0.00 $1,907.69 DARLINGTON BOROUGH $266.22 $0.00 $266.22 DARLINGTON TOWNSHIP $17,099.03 $0.00 $17,099.03 DAUGHERTY TOWNSHIP $3,116.38 $0.00 $3,116.38 EAST ROCHESTER BOROUGH $258.74 $0.00 $258.74 EASTVALE BOROUGH $260.30 $0.00 $260.30 ECONOMY BOROUGH $9,130.24 $0.00 $9,130.24 ELLWOOD CITY BOROUGH $554.79 $0.00 $554.79 FALLSTON BOROUGH $327.60 $0.00 $327.60 FRANKFORT SPRINGS BOROUGH $88.15 $0.00 $88.15 FRANKLIN TOWNSHIP $5,162.65 $0.00 $5,162.65 FREEDOM BOROUGH $1,411.77 $0.00 $1,411.77 GEORGETOWN BOROUGH $253.58 $0.00 $253.58 GLASGOW BOROUGH $115.00 $0.00 $115.00 GREENE TOWNSHIP $11,025.23 $0.00 $11,025.23 HANOVER TOWNSHIP $32,962.90 $0.00 $32,962.90 HARMONY TOWNSHIP $1,356.95 $0.00 $1,356.95 HOMEWOOD BOROUGH $204.82 $0.00 $204.82 HOOKSTOWN BOROUGH $175.94 $0.00 $175.94 HOPEWELL TOWNSHIP $11,338.31 $0.00 $11,338.31 INDEPENDENCE TOWNSHIP $4,086.05 $0.00 $4,086.05 Beaver Page 6 of 44
- 7. County and Municipality Disbursements for 2013 INDUSTRY BOROUGH $15,287.32 $0.00 $15,287.32 KOPPEL BOROUGH $702.79 $0.00 $702.79 MARION TOWNSHIP $7,641.36 $0.00 $7,641.36 MIDLAND BOROUGH $2,177.74 $0.00 $2,177.74 MONACA BOROUGH $2,213.37 $0.00 $2,213.37 NEW BRIGHTON BOROUGH $4,861.37 $0.00 $4,861.37 NEW GALILEE BOROUGH $406.69 $0.00 $406.69 NEW SEWICKLEY TOWNSHIP $28,197.71 $0.00 $28,197.71 NORTH SEWICKLEY TOWNSHIP $6,153.05 $0.00 $6,153.05 OHIOVILLE BOROUGH $44,051.11 $0.00 $44,051.11 PATTERSON HEIGHTS BOROUGH $576.73 $0.00 $576.73 PATTERSON TOWNSHIP $2,630.28 $0.00 $2,630.28 POTTER TOWNSHIP $700.28 $0.00 $700.28 PULASKI TOWNSHIP $1,342.56 $0.00 $1,342.56 RACCOON TOWNSHIP $4,057.55 $0.00 $4,057.55 ROCHESTER BOROUGH $1,319.23 $0.00 $1,319.23 ROCHESTER TOWNSHIP $2,908.28 $0.00 $2,908.28 SHIPPINGPORT BOROUGH $504.48 $0.00 $504.48 SOUTH BEAVER TOWNSHIP $70,966.35 $0.00 $70,966.35 SOUTH HEIGHTS BOROUGH $242.79 $0.00 $242.79 VANPORT TOWNSHIP $1,169.23 $0.00 $1,169.23 WEST MAYFIELD BOROUGH $1,403.34 $0.00 $1,403.34 WHITE TOWNSHIP $1,311.14 $0.00 $1,311.14 $6,493.80 $47,265.45 $53,759.25 BEDFORD BOROUGH $90.65 $0.00 $90.65 BEDFORD TOWNSHIP $211.74 $0.00 $211.74 BLOOMFIELD TOWNSHIP $39.63 $0.00 $39.63 BROAD TOP TOWNSHIP $87.56 $0.00 $87.56 COALDALE BOROUGH $4.61 $0.00 $4.61 COLERAIN TOWNSHIP $59.17 $0.00 $59.17 CUMBERLAND VALLEY TOWNSHIP $67.20 $0.00 $67.20 EAST PROVIDENCE TOWNSHIP $125.18 $0.00 $125.18 EAST ST CLAIR TOWNSHIP $766.15 $0.00 $766.15 EVERETT BOROUGH $59.31 $0.00 $59.31 HARRISON TOWNSHIP $53.15 $0.00 $53.15 HOPEWELL BOROUGH $9.04 $0.00 $9.04 Bedford Page 7 of 44
- 8. County and Municipality Disbursements for 2013 HOPEWELL TOWNSHIP $82.41 $0.00 $82.41 HYNDMAN BOROUGH $31.27 $0.00 $31.27 JUNIATA TOWNSHIP $110.02 $0.00 $110.02 KIMMEL TOWNSHIP $317.49 $0.00 $317.49 KING TOWNSHIP $256.27 $0.00 $256.27 LIBERTY TOWNSHIP $65.64 $0.00 $65.64 LINCOLN TOWNSHIP $184.86 $0.00 $184.86 LONDONDERRY TOWNSHIP $73.58 $0.00 $73.58 MANN TOWNSHIP $74.72 $0.00 $74.72 MANNS CHOICE BOROUGH $9.55 $0.00 $9.55 MONROE TOWNSHIP $141.65 $0.00 $141.65 NAPIER TOWNSHIP $853.36 $0.00 $853.36 NEW PARIS BOROUGH $4.83 $0.00 $4.83 PAVIA TOWNSHIP $101.48 $0.00 $101.48 PLEASANTVILLE BOROUGH $32.15 $0.00 $32.15 RAINSBURG BOROUGH $4.26 $0.00 $4.26 SAINT CLAIRSVILLE BOROUGH $2.51 $0.00 $2.51 SAXTON BOROUGH $24.57 $0.00 $24.57 SCHELLSBURG BOROUGH $10.53 $0.00 $10.53 SNAKE SPRING TOWNSHIP $67.68 $0.00 $67.68 SOUTH WOODBURY TOWNSHIP $82.20 $0.00 $82.20 SOUTHAMPTON TOWNSHIP $76.83 $0.00 $76.83 WEST PROVIDENCE TOWNSHIP $139.31 $0.00 $139.31 WEST ST CLAIR TOWNSHIP $7,155.13 $0.00 $7,155.13 WOODBURY BOROUGH $8.10 $0.00 $8.10 WOODBURY TOWNSHIP $60.26 $0.00 $60.26 Berks $0.00 $396,233.79 $396,233.79 $38,962.83 $121,815.56 $160,778.39 ALLEGHENY TOWNSHIP $3,934.78 $0.00 $3,934.78 ALTOONA CITY $4,510.65 $0.00 $4,510.65 ANTIS TOWNSHIP $4,166.06 $0.00 $4,166.06 BELLWOOD BOROUGH $189.89 $0.00 $189.89 BLAIR TOWNSHIP $2,389.26 $0.00 $2,389.26 CATHARINE TOWNSHIP $145.17 $0.00 $145.17 DUNCANSVILLE BOROUGH $134.33 $0.00 $134.33 FRANKSTOWN TOWNSHIP $1,022.20 $0.00 $1,022.20 Blair Page 8 of 44
- 9. County and Municipality Disbursements for 2013 FREEDOM TOWNSHIP $2,195.18 $0.00 $2,195.18 GREENFIELD TOWNSHIP $2,431.38 $0.00 $2,431.38 HOLLIDAYSBURG BOROUGH $562.33 $0.00 $562.33 HUSTON TOWNSHIP $251.91 $0.00 $251.91 JUNIATA TOWNSHIP $40,951.14 $0.00 $40,951.14 LOGAN TOWNSHIP $1,508.76 $0.00 $1,508.76 MARTINSBURG BOROUGH $189.41 $0.00 $189.41 NEWRY BOROUGH $26.21 $0.00 $26.21 NORTH WOODBURY TOWNSHIP $366.65 $0.00 $366.65 ROARING SPRING BOROUGH $244.45 $0.00 $244.45 SNYDER TOWNSHIP $2,334.20 $0.00 $2,334.20 TAYLOR TOWNSHIP $360.55 $0.00 $360.55 TUNNELHILL BOROUGH $10.66 $0.00 $10.66 TYRONE BOROUGH $512.02 $0.00 $512.02 TYRONE TOWNSHIP $299.60 $0.00 $299.60 WILLIAMSBURG BOROUGH $118.27 $0.00 $118.27 WOODBURY TOWNSHIP $411.85 $0.00 $411.85 $6,993,829.50 $60,171.35 $7,054,000.85 ALBA BOROUGH $7,963.76 $0.00 $7,963.76 ALBANY TOWNSHIP $398,894.41 $0.00 $398,894.41 ARMENIA TOWNSHIP $357,849.66 $0.00 $357,849.66 ASYLUM TOWNSHIP $328,644.03 $0.00 $328,644.03 ATHENS BOROUGH $164,326.60 $0.00 $164,326.60 ATHENS TOWNSHIP $396,557.68 $0.00 $396,557.68 BURLINGTON BOROUGH $20,156.35 $0.00 $20,156.35 BURLINGTON TOWNSHIP $212,929.43 $0.00 $212,929.43 CANTON BOROUGH $93,806.90 $0.00 $93,806.90 CANTON TOWNSHIP $346,871.95 $0.00 $346,871.95 COLUMBIA TOWNSHIP $515,100.00 $0.00 $515,100.00 FRANKLIN TOWNSHIP $169,183.21 $0.00 $169,183.21 GRANVILLE TOWNSHIP $221,800.21 $0.00 $221,800.21 HERRICK TOWNSHIP $515,100.00 $0.00 $515,100.00 LERAYSVILLE BOROUGH $36,025.16 $0.00 $36,025.16 LEROY TOWNSHIP $150,960.29 $0.00 $150,960.29 LITCHFIELD TOWNSHIP $250,294.56 $0.00 $250,294.56 MONROE BOROUGH $27,678.82 $0.00 $27,678.82 Bradford Page 9 of 44
- 10. County and Municipality Disbursements for 2013 MONROE TOWNSHIP $291,895.54 $0.00 $291,895.54 NEW ALBANY BOROUGH $17,627.00 $0.00 $17,627.00 NORTH TOWANDA TOWNSHIP $104,719.80 $0.00 $104,719.80 ORWELL TOWNSHIP $324,197.28 $0.00 $324,197.28 OVERTON TOWNSHIP $213,485.59 $0.00 $213,485.59 PIKE TOWNSHIP $272,245.09 $0.00 $272,245.09 RIDGEBURY TOWNSHIP $266,559.14 $0.00 $266,559.14 ROME BOROUGH $19,306.52 $0.00 $19,306.52 ROME TOWNSHIP $263,942.10 $0.00 $263,942.10 SAYRE BOROUGH $277,596.20 $0.00 $277,596.20 SHESHEQUIN TOWNSHIP $246,221.10 $0.00 $246,221.10 SMITHFIELD TOWNSHIP $396,027.21 $0.00 $396,027.21 SOUTH CREEK TOWNSHIP $112,525.62 $0.00 $112,525.62 SOUTH WAVERLY BOROUGH $55,449.96 $0.00 $55,449.96 SPRINGFIELD TOWNSHIP $380,794.79 $0.00 $380,794.79 STANDING STONE TOWNSHIP $158,015.19 $0.00 $158,015.19 STEVENS TOWNSHIP $405,779.40 $0.00 $405,779.40 SYLVANIA BOROUGH $10,709.94 $0.00 $10,709.94 TERRY TOWNSHIP $444,133.82 $0.00 $444,133.82 TOWANDA BOROUGH $143,994.30 $0.00 $143,994.30 TOWANDA TOWNSHIP $167,125.65 $0.00 $167,125.65 TROY BOROUGH $64,927.38 $0.00 $64,927.38 TROY TOWNSHIP $515,100.00 $0.00 $515,100.00 TUSCARORA TOWNSHIP $353,832.69 $0.00 $353,832.69 ULSTER TOWNSHIP $199,691.03 $0.00 $199,691.03 WARREN TOWNSHIP $291,675.51 $0.00 $291,675.51 WELLS TOWNSHIP $233,984.45 $0.00 $233,984.45 WEST BURLINGTON TOWNSHIP $224,221.29 $0.00 $224,221.29 WILMOT TOWNSHIP $515,100.00 $0.00 $515,100.00 WINDHAM TOWNSHIP $173,380.46 $0.00 $173,380.46 WYALUSING BOROUGH $31,666.36 $0.00 $31,666.36 WYALUSING TOWNSHIP $313,333.38 $0.00 $313,333.38 WYSOX TOWNSHIP $240,813.56 $0.00 $240,813.56 Bucks $0.00 $600,882.68 $600,882.68 $1,571,501.15 $177,250.20 $1,748,751.35 ADAMS TOWNSHIP $65,139.72 $0.00 $65,139.72 Butler Page 10 of 44
- 11. County and Municipality Disbursements for 2013 ALLEGHENY TOWNSHIP $36,965.11 $0.00 $36,965.11 BRADY TOWNSHIP $11,417.38 $0.00 $11,417.38 BRUIN BOROUGH $3,005.42 $0.00 $3,005.42 BUFFALO TOWNSHIP $82,279.65 $0.00 $82,279.65 BUTLER CITY $64,616.38 $0.00 $64,616.38 BUTLER TOWNSHIP $239,225.13 $0.00 $239,225.13 CALLERY BOROUGH $2,261.22 $0.00 $2,261.22 CENTER TOWNSHIP $63,171.27 $0.00 $63,171.27 CHERRY TOWNSHIP $39,500.98 $0.00 $39,500.98 CHERRY VALLEY BOROUGH $1,150.28 $0.00 $1,150.28 CHICORA BOROUGH $5,132.00 $0.00 $5,132.00 CLAY TOWNSHIP $25,084.10 $0.00 $25,084.10 CLEARFIELD TOWNSHIP $97,934.40 $0.00 $97,934.40 CLINTON TOWNSHIP $90,187.77 $0.00 $90,187.77 CONCORD TOWNSHIP $36,169.83 $0.00 $36,169.83 CONNOQUENESSING BOROUGH $2,616.20 $0.00 $2,616.20 CONNOQUENESSING TOWNSHIP $174,573.37 $0.00 $174,573.37 CRANBERRY TOWNSHIP $140,123.12 $0.00 $140,123.12 DONEGAL TOWNSHIP $51,103.18 $0.00 $51,103.18 EAST BUTLER BOROUGH $4,840.04 $0.00 $4,840.04 EAU CLAIRE BOROUGH $1,992.98 $0.00 $1,992.98 EVANS CITY BOROUGH $8,355.14 $0.00 $8,355.14 FAIRVIEW BOROUGH $1,043.00 $0.00 $1,043.00 FAIRVIEW TOWNSHIP $21,447.54 $0.00 $21,447.54 FORWARD TOWNSHIP $282,178.22 $0.00 $282,178.22 FRANKLIN TOWNSHIP $18,554.84 $0.00 $18,554.84 HARMONY BOROUGH $5,258.70 $0.00 $5,258.70 HARRISVILLE BOROUGH $4,644.86 $0.00 $4,644.86 JACKSON TOWNSHIP $199,808.71 $0.00 $199,808.71 JEFFERSON TOWNSHIP $64,138.08 $0.00 $64,138.08 KARNS CITY BOROUGH $947.76 $0.00 $947.76 LANCASTER TOWNSHIP $159,511.66 $0.00 $159,511.66 MARION TOWNSHIP $19,863.62 $0.00 $19,863.62 MARS BOROUGH $8,365.60 $0.00 $8,365.60 MERCER TOWNSHIP $81,690.90 $0.00 $81,690.90 MIDDLESEX TOWNSHIP $57,478.52 $0.00 $57,478.52 Butler Page 11 of 44
- 12. County and Municipality Disbursements for 2013 MUDDY CREEK TOWNSHIP $38,128.64 $0.00 $38,128.64 OAKLAND TOWNSHIP $23,012.08 $0.00 $23,012.08 PARKER TOWNSHIP $10,465.54 $0.00 $10,465.54 PENN TOWNSHIP $95,594.02 $0.00 $95,594.02 PETROLIA BOROUGH $1,483.88 $0.00 $1,483.88 PORTERSVILLE BOROUGH $1,609.08 $0.00 $1,609.08 PROSPECT BOROUGH $6,040.88 $0.00 $6,040.88 SAXONBURG BOROUGH $6,698.22 $0.00 $6,698.22 SEVEN FIELDS BOROUGH $13,449.28 $0.00 $13,449.28 SLIPPERY ROCK BOROUGH $15,494.10 $0.00 $15,494.10 SLIPPERY ROCK TOWNSHIP $69,978.07 $0.00 $69,978.07 SUMMIT TOWNSHIP $178,064.07 $0.00 $178,064.07 VALENCIA BOROUGH $2,538.46 $0.00 $2,538.46 VENANGO TOWNSHIP $13,296.26 $0.00 $13,296.26 WASHINGTON TOWNSHIP $23,433.60 $0.00 $23,433.60 WEST LIBERTY BOROUGH $4,247.36 $0.00 $4,247.36 WEST SUNBURY BOROUGH $861.12 $0.00 $861.12 WINFIELD TOWNSHIP $55,932.88 $0.00 $55,932.88 WORTH TOWNSHIP $43,072.69 $0.00 $43,072.69 ZELIENOPLE BOROUGH $18,601.58 $0.00 $18,601.58 $38,962.83 $135,674.93 $174,637.76 ADAMS TOWNSHIP $21,651.59 $0.00 $21,651.59 ALLEGHENY TOWNSHIP $906.79 $0.00 $906.79 ASHVILLE BOROUGH $64.02 $0.00 $64.02 BARR TOWNSHIP $886.32 $0.00 $886.32 BLACKLICK TOWNSHIP $533.27 $0.00 $533.27 BROWNSTOWN BOROUGH $64.49 $0.00 $64.49 CAMBRIA TOWNSHIP $1,654.63 $0.00 $1,654.63 CARROLLTOWN BOROUGH $98.56 $0.00 $98.56 CASSANDRA BOROUGH $14.46 $0.00 $14.46 CHEST SPRINGS BOROUGH $28.69 $0.00 $28.69 CHEST TOWNSHIP $197.42 $0.00 $197.42 CLEARFIELD TOWNSHIP $7,164.04 $0.00 $7,164.04 CONEMAUGH TOWNSHIP $477.98 $0.00 $477.98 CRESSON BOROUGH $146.48 $0.00 $146.48 CRESSON TOWNSHIP $816.40 $0.00 $816.40 Cambria Page 12 of 44
- 13. County and Municipality Disbursements for 2013 CROYLE TOWNSHIP $717.84 $0.00 $717.84 DAISYTOWN BOROUGH $39.93 $0.00 $39.93 DALE BOROUGH $89.86 $0.00 $89.86 DEAN TOWNSHIP $186.32 $0.00 $186.32 EAST CARROLL TOWNSHIP $578.68 $0.00 $578.68 EAST CONEMAUGH BOROUGH $225.29 $0.00 $225.29 EAST TAYLOR TOWNSHIP $679.68 $0.00 $679.68 EBENSBURG BOROUGH $279.45 $0.00 $279.45 EHRENFELD BOROUGH $29.74 $0.00 $29.74 ELDER TOWNSHIP $304.36 $0.00 $304.36 FERNDALE BOROUGH $124.34 $0.00 $124.34 FRANKLIN BOROUGH $62.64 $0.00 $62.64 GALLITZIN BOROUGH $163.35 $0.00 $163.35 GALLITZIN TOWNSHIP $332.98 $0.00 $332.98 GEISTOWN BOROUGH $214.51 $0.00 $214.51 HASTINGS BOROUGH $121.93 $0.00 $121.93 JACKSON TOWNSHIP $7,883.22 $0.00 $7,883.22 JOHNSTOWN CITY $3,806.09 $0.00 $3,806.09 LILLY BOROUGH $93.50 $0.00 $93.50 LORAIN BOROUGH $65.05 $0.00 $65.05 LORETTO BOROUGH $87.09 $0.00 $87.09 LOWER YODER TOWNSHIP $566.24 $0.00 $566.24 MIDDLE TAYLOR TOWNSHIP $258.59 $0.00 $258.59 MUNSTER TOWNSHIP $123.71 $0.00 $123.71 NANTY GLO BOROUGH $560.40 $0.00 $560.40 NORTHERN CAMBRIA BOROUGH $952.55 $0.00 $952.55 PATTON BOROUGH $323.52 $0.00 $323.52 PORTAGE BOROUGH $218.42 $0.00 $218.42 PORTAGE TOWNSHIP $855.04 $0.00 $855.04 READE TOWNSHIP $7,070.62 $0.00 $7,070.62 RICHLAND TOWNSHIP $2,671.66 $0.00 $2,671.66 SANKERTOWN BOROUGH $63.11 $0.00 $63.11 SCALP LEVEL BOROUGH $70.09 $0.00 $70.09 SOUTH FORK BOROUGH $174.54 $0.00 $174.54 SOUTHMONT BOROUGH $201.43 $0.00 $201.43 STONYCREEK TOWNSHIP $272.56 $0.00 $272.56 Page 13 of 44
- 14. County and Municipality Disbursements for 2013 SUMMERHILL BOROUGH $40.81 $0.00 $40.81 SUMMERHILL TOWNSHIP $713.88 $0.00 $713.88 SUSQUEHANNA TOWNSHIP $788.26 $0.00 $788.26 TUNNELHILL BOROUGH $18.02 $0.00 $18.02 UPPER YODER TOWNSHIP $1,049.07 $0.00 $1,049.07 VINTONDALE BOROUGH $91.00 $0.00 $91.00 WASHINGTON TOWNSHIP $348.95 $0.00 $348.95 WEST CARROLL TOWNSHIP $168.03 $0.00 $168.03 WEST TAYLOR TOWNSHIP $226.72 $0.00 $226.72 WESTMONT BOROUGH $443.57 $0.00 $443.57 WHITE TOWNSHIP $175.30 $0.00 $175.30 WILMORE BOROUGH $29.09 $0.00 $29.09 $103,900.90 $25,000.00 $128,900.90 DRIFTWOOD BOROUGH $694.08 $0.00 $694.08 EMPORIUM BOROUGH $18,793.27 $0.00 $18,793.27 GIBSON TOWNSHIP $13,948.61 $0.00 $13,948.61 GROVE TOWNSHIP $4,665.64 $0.00 $4,665.64 LUMBER TOWNSHIP $15,063.61 $0.00 $15,063.61 PORTAGE TOWNSHIP $2,984.02 $0.00 $2,984.02 SHIPPEN TOWNSHIP $128,563.31 $0.00 $128,563.31 Carbon $0.00 $62,292.95 $62,292.95 $305,208.90 $148,694.88 $453,903.78 BELLEFONTE BOROUGH $3,668.42 $0.00 $3,668.42 BENNER TOWNSHIP $4,489.17 $0.00 $4,489.17 * BOGGS TOWNSHIP $19,277.97 $0.00 $19,277.97 * BURNSIDE TOWNSHIP $182,727.10 $0.00 $182,727.10 CENTRE HALL BOROUGH $832.85 $0.00 $832.85 COLLEGE TOWNSHIP $6,613.99 $0.00 $6,613.99 CURTIN TOWNSHIP $19,296.29 $0.00 $19,296.29 FERGUSON TOWNSHIP $12,015.77 $0.00 $12,015.77 GREGG TOWNSHIP $3,246.72 $0.00 $3,246.72 HAINES TOWNSHIP $2,207.47 $0.00 $2,207.47 HALFMOON TOWNSHIP $2,310.68 $0.00 $2,310.68 HARRIS TOWNSHIP $3,808.05 $0.00 $3,808.05 HOWARD BOROUGH $496.75 $0.00 $496.75 HOWARD TOWNSHIP $5,720.70 $0.00 $5,720.70 Cameron Centre Page 14 of 44
- 15. County and Municipality Disbursements for 2013 HUSTON TOWNSHIP $5,570.38 $0.00 $5,570.38 LIBERTY TOWNSHIP $9,374.53 $0.00 $9,374.53 MARION TOWNSHIP $908.97 $0.00 $908.97 * MILES TOWNSHIP $1,403.35 $0.00 $1,403.35 MILESBURG BOROUGH $837.47 $0.00 $837.47 * MILLHEIM BOROUGH $709.03 $0.00 $709.03 PATTON TOWNSHIP $9,651.24 $0.00 $9,651.24 PENN TOWNSHIP $1,386.54 $0.00 $1,386.54 PHILIPSBURG BOROUGH $7,956.98 $0.00 $7,956.98 PORT MATILDA BOROUGH $453.42 $0.00 $453.42 POTTER TOWNSHIP $4,696.34 $0.00 $4,696.34 RUSH TOWNSHIP $23,623.82 $0.00 $23,623.82 SNOW SHOE BOROUGH $2,885.05 $0.00 $2,885.05 SNOW SHOE TOWNSHIP $98,543.73 $0.00 $98,543.73 SPRING TOWNSHIP $5,613.53 $0.00 $5,613.53 * STATE COLLEGE BOROUGH $18,754.53 $0.00 $18,754.53 TAYLOR TOWNSHIP $6,599.37 $0.00 $6,599.37 UNION TOWNSHIP $7,277.48 $0.00 $7,277.48 UNIONVILLE BOROUGH $277.50 $0.00 $277.50 WALKER TOWNSHIP $3,811.67 $0.00 $3,811.67 WORTH TOWNSHIP $5,409.11 $0.00 $5,409.11 Chester $0.00 $485,432.89 $485,432.89 $110,394.70 $37,991.36 $148,386.06 ASHLAND TOWNSHIP $9,081.07 $0.00 $9,081.07 BEAVER TOWNSHIP $4,702.32 $0.00 $4,702.32 BRADY TOWNSHIP $86.40 $0.00 $86.40 CALLENSBURG BOROUGH $321.29 $0.00 $321.29 CLARION BOROUGH $3,148.26 $0.00 $3,148.26 CLARION TOWNSHIP $6,775.67 $0.00 $6,775.67 EAST BRADY BOROUGH $1,475.65 $0.00 $1,475.65 ELK TOWNSHIP $16,503.56 $0.00 $16,503.56 EMLENTON BOROUGH $12.79 $0.00 $12.79 FARMINGTON TOWNSHIP $4,993.01 $0.00 $4,993.01 FOXBURG BOROUGH $325.95 $0.00 $325.95 HAWTHORN BOROUGH $768.66 $0.00 $768.66 HIGHLAND TOWNSHIP $733.47 $0.00 $733.47 Clarion Page 15 of 44
- 16. County and Municipality Disbursements for 2013 KNOX BOROUGH $1,611.44 $0.00 $1,611.44 KNOX TOWNSHIP $1,976.68 $0.00 $1,976.68 LICKING TOWNSHIP $1,710.35 $0.00 $1,710.35 LIMESTONE TOWNSHIP $12,373.09 $0.00 $12,373.09 MADISON TOWNSHIP $16,571.87 $0.00 $16,571.87 MILLCREEK TOWNSHIP $2,360.95 $0.00 $2,360.95 MONROE TOWNSHIP $4,221.80 $0.00 $4,221.80 NEW BETHLEHEM BOROUGH $1,434.59 $0.00 $1,434.59 PAINT TOWNSHIP $2,929.90 $0.00 $2,929.90 PERRY TOWNSHIP $3,263.83 $0.00 $3,263.83 PINEY TOWNSHIP $1,481.47 $0.00 $1,481.47 PORTER TOWNSHIP $31,516.99 $0.00 $31,516.99 REDBANK TOWNSHIP $10,370.47 $0.00 $10,370.47 RICHLAND TOWNSHIP $1,597.03 $0.00 $1,597.03 RIMERSBURG BOROUGH $1,273.23 $0.00 $1,273.23 SAINT PETERSBURG BOROUGH $564.24 $0.00 $564.24 SALEM TOWNSHIP $2,456.02 $0.00 $2,456.02 SHIPPENVILLE BOROUGH $671.84 $0.00 $671.84 SLIGO BOROUGH $1,065.93 $0.00 $1,065.93 STRATTANVILLE BOROUGH $370.63 $0.00 $370.63 TOBY TOWNSHIP $30,464.67 $0.00 $30,464.67 WASHINGTON TOWNSHIP $17,041.36 $0.00 $17,041.36 $915,626.70 $77,795.75 $993,422.45 BECCARIA TOWNSHIP $22,420.96 $0.00 $22,420.96 BELL TOWNSHIP $16,931.65 $0.00 $16,931.65 BIGLER TOWNSHIP $23,882.56 $0.00 $23,882.56 BLOOM TOWNSHIP $6,739.01 $0.00 $6,739.01 BOGGS TOWNSHIP $22,832.98 $0.00 $22,832.98 BRADFORD TOWNSHIP $26,049.98 $0.00 $26,049.98 BRADY TOWNSHIP $32,110.15 $0.00 $32,110.15 BRISBIN BOROUGH $3,301.19 $0.00 $3,301.19 BURNSIDE BOROUGH $1,128.97 $0.00 $1,128.97 BURNSIDE TOWNSHIP $16,710.52 $0.00 $16,710.52 CHEST TOWNSHIP $14,492.35 $0.00 $14,492.35 CHESTER HILL BOROUGH $5,175.86 $0.00 $5,175.86 CLEARFIELD BOROUGH $38,045.35 $0.00 $38,045.35 Clearfield Page 16 of 44
- 17. County and Municipality Disbursements for 2013 COALPORT BOROUGH $3,747.58 $0.00 $3,747.58 COOPER TOWNSHIP $50,684.14 $0.00 $50,684.14 COVINGTON TOWNSHIP $17,129.19 $0.00 $17,129.19 CURWENSVILLE BOROUGH $16,073.16 $0.00 $16,073.16 DECATUR TOWNSHIP $28,199.74 $0.00 $28,199.74 DUBOIS CITY $45,711.93 $0.00 $45,711.93 FALLS CREEK BOROUGH $274.65 $0.00 $274.65 FERGUSON TOWNSHIP $44,672.77 $0.00 $44,672.77 GIRARD TOWNSHIP $24,831.44 $0.00 $24,831.44 GLEN HOPE BOROUGH $1,398.11 $0.00 $1,398.11 GOSHEN TOWNSHIP $42,428.10 $0.00 $42,428.10 GRAHAM TOWNSHIP $11,019.23 $0.00 $11,019.23 GRAMPIAN BOROUGH $1,258.60 $0.00 $1,258.60 GREENWOOD TOWNSHIP $10,423.29 $0.00 $10,423.29 GULICH TOWNSHIP $16,086.23 $0.00 $16,086.23 HOUTZDALE BOROUGH $5,498.63 $0.00 $5,498.63 HUSTON TOWNSHIP $46,458.76 $0.00 $46,458.76 IRVONA BOROUGH $4,188.05 $0.00 $4,188.05 JORDAN TOWNSHIP $11,638.21 $0.00 $11,638.21 KARTHAUS TOWNSHIP $16,912.84 $0.00 $16,912.84 KNOX TOWNSHIP $9,830.44 $0.00 $9,830.44 LAWRENCE TOWNSHIP $778,559.91 $0.00 $778,559.91 LUMBER CITY BOROUGH $1,605.84 $0.00 $1,605.84 MAHAFFEY BOROUGH $2,115.90 $0.00 $2,115.90 MORRIS TOWNSHIP $25,036.66 $0.00 $25,036.66 NEW WASHINGTON BOROUGH $885.60 $0.00 $885.60 NEWBURG BOROUGH $821.52 $0.00 $821.52 OSCEOLA MILLS BOROUGH $6,451.88 $0.00 $6,451.88 PENN TOWNSHIP $17,621.70 $0.00 $17,621.70 PIKE TOWNSHIP $25,511.69 $0.00 $25,511.69 PINE TOWNSHIP $7,699.45 $0.00 $7,699.45 RAMEY BOROUGH $3,676.14 $0.00 $3,676.14 SANDY TOWNSHIP $67,901.69 $0.00 $67,901.69 TROUTVILLE BOROUGH $1,600.11 $0.00 $1,600.11 UNION TOWNSHIP $12,718.60 $0.00 $12,718.60 WALLACETON BOROUGH $2,309.94 $0.00 $2,309.94 Page 17 of 44
- 18. County and Municipality Disbursements for 2013 WESTOVER BOROUGH $3,070.88 $0.00 $3,070.88 WOODWARD TOWNSHIP $31,905.43 $0.00 $31,905.43 $513,010.70 $37,867.74 $550,878.44 ALLISON TOWNSHIP $2,675.02 $0.00 $2,675.02 AVIS BOROUGH $16,945.81 $0.00 $16,945.81 BALD EAGLE TOWNSHIP $27,631.01 $0.00 $27,631.01 BEECH CREEK BOROUGH $7,420.85 $0.00 $7,420.85 BEECH CREEK TOWNSHIP $72,500.53 $0.00 $72,500.53 CASTANEA TOWNSHIP $5,543.51 $0.00 $5,543.51 CHAPMAN TOWNSHIP $160,949.79 $0.00 $160,949.79 COLEBROOK TOWNSHIP $1,383.03 $0.00 $1,383.03 CRAWFORD TOWNSHIP $6,392.47 $0.00 $6,392.47 DUNNSTABLE TOWNSHIP $13,056.31 $0.00 $13,056.31 EAST KEATING TOWNSHIP $8,780.87 $0.00 $8,780.87 FLEMINGTON BOROUGH $4,989.76 $0.00 $4,989.76 GALLAGHER TOWNSHIP $76,872.58 $0.00 $76,872.58 GREENE TOWNSHIP $9,699.43 $0.00 $9,699.43 GRUGAN TOWNSHIP $186,087.50 $0.00 $186,087.50 LAMAR TOWNSHIP $36,191.58 $0.00 $36,191.58 LEIDY TOWNSHIP $8,616.54 $0.00 $8,616.54 LOCK HAVEN CITY $31,276.04 $0.00 $31,276.04 LOGAN TOWNSHIP $3,528.06 $0.00 $3,528.06 LOGANTON BOROUGH $1,705.59 $0.00 $1,705.59 MILL HALL BOROUGH $5,964.78 $0.00 $5,964.78 NOYES TOWNSHIP $72,756.01 $0.00 $72,756.01 PINE CREEK TOWNSHIP $40,579.22 $0.00 $40,579.22 PORTER TOWNSHIP $18,397.31 $0.00 $18,397.31 RENOVO BOROUGH $13,064.19 $0.00 $13,064.19 SOUTH RENOVO BOROUGH $4,906.56 $0.00 $4,906.56 WAYNE TOWNSHIP $23,220.79 $0.00 $23,220.79 WEST KEATING TOWNSHIP $19,931.12 $0.00 $19,931.12 WOODWARD TOWNSHIP $30,952.22 $0.00 $30,952.22 $12,987.61 $64,095.44 $77,083.05 BEAVER TOWNSHIP $83.20 $0.00 $83.20 BENTON BOROUGH $268.37 $0.00 $268.37 BENTON TOWNSHIP $796.19 $0.00 $796.19 Clinton Columbia Page 18 of 44
- 19. County and Municipality Disbursements for 2013 BERWICK BOROUGH $505.02 $0.00 $505.02 BLOOMSBURG TOWN $632.96 $0.00 $632.96 BRIAR CREEK BOROUGH $37.94 $0.00 $37.94 BRIAR CREEK TOWNSHIP $181.34 $0.00 $181.34 CATAWISSA BOROUGH $78.66 $0.00 $78.66 CATAWISSA TOWNSHIP $73.93 $0.00 $73.93 CENTRALIA BOROUGH $6.95 $0.00 $6.95 CLEVELAND TOWNSHIP $174.66 $0.00 $174.66 CONYNGHAM TOWNSHIP $46.61 $0.00 $46.61 FISHING CREEK TOWNSHIP $877.79 $0.00 $877.79 FRANKLIN TOWNSHIP $81.21 $0.00 $81.21 GREENWOOD TOWNSHIP $1,152.56 $0.00 $1,152.56 HEMLOCK TOWNSHIP $188.17 $0.00 $188.17 JACKSON TOWNSHIP $532.17 $0.00 $532.17 LOCUST TOWNSHIP $140.25 $0.00 $140.25 MADISON TOWNSHIP $917.40 $0.00 $917.40 MAIN TOWNSHIP $91.39 $0.00 $91.39 MIFFLIN TOWNSHIP $161.20 $0.00 $161.20 MILLVILLE BOROUGH $294.81 $0.00 $294.81 MONTOUR TOWNSHIP $87.69 $0.00 $87.69 MT PLEASANT TOWNSHIP $178.27 $0.00 $178.27 NORTH CENTRE TOWNSHIP $146.75 $0.00 $146.75 ORANGE TOWNSHIP $109.46 $0.00 $109.46 ORANGEVILLE BOROUGH $22.43 $0.00 $22.43 PINE TOWNSHIP $7,369.79 $0.00 $7,369.79 ROARING CREEK TOWNSHIP $64.90 $0.00 $64.90 SCOTT TOWNSHIP $273.92 $0.00 $273.92 SOUTH CENTRE TOWNSHIP $112.09 $0.00 $112.09 STILLWATER BOROUGH $128.47 $0.00 $128.47 SUGARLOAF TOWNSHIP $7,272.06 $0.00 $7,272.06 $19,481.41 $83,942.06 $103,423.47 ATHENS TOWNSHIP $114.11 $0.00 $114.11 BEAVER TOWNSHIP $136.13 $0.00 $136.13 BLOOMFIELD TOWNSHIP $209.58 $0.00 $209.58 BLOOMING VALLEY BOROUGH $20.42 $0.00 $20.42 CAMBRIDGE SPRINGS BOROUGH $117.08 $0.00 $117.08 Columbia Crawford Page 19 of 44
- 20. County and Municipality Disbursements for 2013 CAMBRIDGE TOWNSHIP $123.82 $0.00 $123.82 CENTERVILLE BOROUGH $16.07 $0.00 $16.07 COCHRANTON BOROUGH $233.99 $0.00 $233.99 CONNEAUT LAKE BOROUGH $38.88 $0.00 $38.88 CONNEAUT TOWNSHIP $646.82 $0.00 $646.82 CONNEAUTVILLE BOROUGH $50.75 $0.00 $50.75 CUSSEWAGO TOWNSHIP $184.12 $0.00 $184.12 EAST FAIRFIELD TOWNSHIP $6,923.81 $0.00 $6,923.81 EAST FALLOWFIELD TOWNSHIP $7,278.81 $0.00 $7,278.81 EAST MEAD TOWNSHIP $503.16 $0.00 $503.16 FAIRFIELD TOWNSHIP $365.08 $0.00 $365.08 GREENWOOD TOWNSHIP $582.66 $0.00 $582.66 HAYFIELD TOWNSHIP $284.36 $0.00 $284.36 HYDETOWN BOROUGH $28.13 $0.00 $28.13 LINESVILLE BOROUGH $204.09 $0.00 $204.09 MEADVILLE CITY $686.94 $0.00 $686.94 NORTH SHENANGO TOWNSHIP $7,346.89 $0.00 $7,346.89 OIL CREEK TOWNSHIP $190.21 $0.00 $190.21 PINE TOWNSHIP $153.23 $0.00 $153.23 RANDOLPH TOWNSHIP $747.07 $0.00 $747.07 RICHMOND TOWNSHIP $147.95 $0.00 $147.95 ROCKDALE TOWNSHIP $166.46 $0.00 $166.46 ROME TOWNSHIP $210.76 $0.00 $210.76 SADSBURY TOWNSHIP $818.58 $0.00 $818.58 SAEGERTOWN BOROUGH $50.30 $0.00 $50.30 SOUTH SHENANGO TOWNSHIP $839.51 $0.00 $839.51 SPARTA TOWNSHIP $192.49 $0.00 $192.49 SPARTANSBURG BOROUGH $18.76 $0.00 $18.76 SPRING TOWNSHIP $215.21 $0.00 $215.21 SPRINGBORO BOROUGH $24.08 $0.00 $24.08 STEUBEN TOWNSHIP $87.34 $0.00 $87.34 SUMMERHILL TOWNSHIP $140.27 $0.00 $140.27 SUMMIT TOWNSHIP $676.82 $0.00 $676.82 TITUSVILLE CITY $305.88 $0.00 $305.88 TOWNVILLE BOROUGH $15.96 $0.00 $15.96 TROY TOWNSHIP $137.26 $0.00 $137.26 Crawford Page 20 of 44
- 21. County and Municipality Disbursements for 2013 UNION TOWNSHIP $371.96 $0.00 $371.96 VENANGO BOROUGH $12.75 $0.00 $12.75 VENANGO TOWNSHIP $98.40 $0.00 $98.40 VERNON TOWNSHIP $351.38 $0.00 $351.38 WAYNE TOWNSHIP $735.13 $0.00 $735.13 WEST FALLOWFIELD TOWNSHIP $159.84 $0.00 $159.84 WEST MEAD TOWNSHIP $1,239.57 $0.00 $1,239.57 WEST SHENANGO TOWNSHIP $179.48 $0.00 $179.48 WOODCOCK BOROUGH $7.17 $0.00 $7.17 WOODCOCK TOWNSHIP $243.42 $0.00 $243.42 Cumberland $0.00 $228,655.35 $228,655.35 Dauphin $0.00 $258,410.42 $258,410.42 Delaware $0.00 $537,680.34 $537,680.34 $350,665.54 $30,233.25 $380,898.79 BENEZETTE TOWNSHIP $5,197.34 $0.00 $5,197.34 FOX TOWNSHIP $92,276.86 $0.00 $92,276.86 HIGHLAND TOWNSHIP $71,747.68 $0.00 $71,747.68 HORTON TOWNSHIP $56,748.53 $0.00 $56,748.53 JAY TOWNSHIP $56,971.18 $0.00 $56,971.18 JOHNSONBURG BOROUGH $14,428.36 $0.00 $14,428.36 JONES TOWNSHIP $142,136.71 $0.00 $142,136.71 MILLSTONE TOWNSHIP $13,973.68 $0.00 $13,973.68 RIDGWAY BOROUGH $23,104.48 $0.00 $23,104.48 RIDGWAY TOWNSHIP $37,255.90 $0.00 $37,255.90 SAINT MARYS CITY $100,983.74 $0.00 $100,983.74 SPRING CREEK TOWNSHIP $8,580.62 $0.00 $8,580.62 Erie $0.00 $268,933.13 $268,933.13 $1,331,230.31 $129,998.18 $1,461,228.49 BELLE VERNON BOROUGH $5,489.42 $0.00 $5,489.42 BROWNSVILLE BOROUGH $15,296.82 $0.00 $15,296.82 BROWNSVILLE TOWNSHIP $18,259.01 $0.00 $18,259.01 BULLSKIN TOWNSHIP $82,477.75 $0.00 $82,477.75 CONNELLSVILLE CITY $41,078.44 $0.00 $41,078.44 CONNELLSVILLE TOWNSHIP $16,423.14 $0.00 $16,423.14 DAWSON BOROUGH $2,555.32 $0.00 $2,555.32 DUNBAR BOROUGH $6,988.12 $0.00 $6,988.12 Elk Fayette Page 21 of 44
- 22. County and Municipality Disbursements for 2013 DUNBAR TOWNSHIP $193,009.54 $0.00 $193,009.54 EVERSON BOROUGH $4,152.04 $0.00 $4,152.04 FAIRCHANCE BOROUGH $11,221.30 $0.00 $11,221.30 FAYETTE CITY BOROUGH $3,450.52 $0.00 $3,450.52 FRANKLIN TOWNSHIP $66,851.16 $0.00 $66,851.16 GEORGES TOWNSHIP $49,474.02 $0.00 $49,474.02 GERMAN TOWNSHIP $199,386.72 $0.00 $199,386.72 HENRY CLAY TOWNSHIP $75,353.94 $0.00 $75,353.94 JEFFERSON TOWNSHIP $79,405.62 $0.00 $79,405.62 LOWER TYRONE TOWNSHIP $33,844.58 $0.00 $33,844.58 LUZERNE TOWNSHIP $222,550.90 $0.00 $222,550.90 MARKLEYSBURG BOROUGH $1,463.06 $0.00 $1,463.06 MASONTOWN BOROUGH $20,159.28 $0.00 $20,159.28 MENALLEN TOWNSHIP $73,865.00 $0.00 $73,865.00 NEWELL BOROUGH $3,673.48 $0.00 $3,673.48 NICHOLSON TOWNSHIP $73,419.29 $0.00 $73,419.29 NORTH UNION TOWNSHIP $136,768.80 $0.00 $136,768.80 OHIOPYLE BOROUGH $758.82 $0.00 $758.82 PERRY TOWNSHIP $54,052.58 $0.00 $54,052.58 PERRYOPOLIS BOROUGH $11,027.40 $0.00 $11,027.40 POINT MARION BOROUGH $6,896.66 $0.00 $6,896.66 REDSTONE TOWNSHIP $314,260.72 $0.00 $314,260.72 SALTLICK TOWNSHIP $30,892.20 $0.00 $30,892.20 SEVEN SPRINGS BOROUGH $1,800.74 $0.00 $1,800.74 SMITHFIELD BOROUGH $4,614.30 $0.00 $4,614.30 SOUTH CONNELLSVILLE BOROUGH $11,832.58 $0.00 $11,832.58 SOUTH UNION TOWNSHIP $62,596.30 $0.00 $62,596.30 SPRINGFIELD TOWNSHIP $54,682.89 $0.00 $54,682.89 SPRINGHILL TOWNSHIP $132,018.37 $0.00 $132,018.37 STEWART TOWNSHIP $18,008.46 $0.00 $18,008.46 UNIONTOWN CITY $52,359.64 $0.00 $52,359.64 UPPER TYRONE TOWNSHIP $12,535.28 $0.00 $12,535.28 VANDERBILT BOROUGH $2,944.38 $0.00 $2,944.38 WASHINGTON TOWNSHIP $75,814.31 $0.00 $75,814.31 WHARTON TOWNSHIP $82,917.69 $0.00 $82,917.69 $116,888.51 $25,000.00 $141,888.51Forest Page 22 of 44
- 23. County and Municipality Disbursements for 2013 BARNETT TOWNSHIP $8,075.60 $0.00 $8,075.60 GREEN TOWNSHIP $12,000.02 $0.00 $12,000.02 HARMONY TOWNSHIP $10,754.42 $0.00 $10,754.42 HICKORY TOWNSHIP $19,891.77 $0.00 $19,891.77 HOWE TOWNSHIP $34,542.09 $0.00 $34,542.09 JENKS TOWNSHIP $68,720.97 $0.00 $68,720.97 KINGSLEY TOWNSHIP $20,462.81 $0.00 $20,462.81 TIONESTA BOROUGH $3,854.12 $0.00 $3,854.12 TIONESTA TOWNSHIP $29,499.74 $0.00 $29,499.74 Franklin $0.00 $144,961.47 $144,961.47 Fulton $0.00 $25,000.00 $25,000.00 $3,591,074.94 $36,495.51 $3,627,570.45 ALEPPO TOWNSHIP $147,112.80 $0.00 $147,112.80 CARMICHAELS BOROUGH $19,624.18 $0.00 $19,624.18 CENTER TOWNSHIP $572,943.30 $0.00 $572,943.30 CLARKSVILLE BOROUGH $10,859.52 $0.00 $10,859.52 CUMBERLAND TOWNSHIP $906,875.01 $0.00 $906,875.01 DUNKARD TOWNSHIP $343,608.83 $0.00 $343,608.83 FRANKLIN TOWNSHIP $554,203.22 $0.00 $554,203.22 FREEPORT TOWNSHIP $24,396.62 $0.00 $24,396.62 GILMORE TOWNSHIP $120,451.83 $0.00 $120,451.83 GRAY TOWNSHIP $24,378.35 $0.00 $24,378.35 GREENE TOWNSHIP $148,742.64 $0.00 $148,742.64 GREENSBORO BOROUGH $12,574.88 $0.00 $12,574.88 JACKSON TOWNSHIP $248,762.82 $0.00 $248,762.82 JEFFERSON BOROUGH $11,601.68 $0.00 $11,601.68 JEFFERSON TOWNSHIP $257,999.82 $0.00 $257,999.82 MONONGAHELA TOWNSHIP $172,849.22 $0.00 $172,849.22 MORGAN TOWNSHIP $558,868.11 $0.00 $558,868.11 MORRIS TOWNSHIP $515,100.00 $0.00 $515,100.00 PERRY TOWNSHIP $127,188.38 $0.00 $127,188.38 RICES LANDING BOROUGH $21,283.30 $0.00 $21,283.30 RICHHILL TOWNSHIP $128,570.05 $0.00 $128,570.05 SPRINGHILL TOWNSHIP $82,481.63 $0.00 $82,481.63 WASHINGTON TOWNSHIP $435,850.88 $0.00 $435,850.88 WAYNE TOWNSHIP $148,595.16 $0.00 $148,595.16 Greene Forest Page 23 of 44
- 24. County and Municipality Disbursements for 2013 WAYNESBURG BOROUGH $170,097.46 $0.00 $170,097.46 WHITELEY TOWNSHIP $89,820.61 $0.00 $89,820.61 $6,493.80 $44,025.55 $50,519.35 ALEXANDRIA BOROUGH $12.63 $0.00 $12.63 BARREE TOWNSHIP $35.20 $0.00 $35.20 BIRMINGHAM BOROUGH $2.95 $0.00 $2.95 BRADY TOWNSHIP $42.95 $0.00 $42.95 BROAD TOP CITY BOROUGH $138.74 $0.00 $138.74 CARBON TOWNSHIP $119.12 $0.00 $119.12 CASS TOWNSHIP $458.97 $0.00 $458.97 CASSVILLE BOROUGH $40.66 $0.00 $40.66 CLAY TOWNSHIP $472.29 $0.00 $472.29 COALMONT BOROUGH $3.86 $0.00 $3.86 CROMWELL TOWNSHIP $123.57 $0.00 $123.57 DUBLIN TOWNSHIP $94.66 $0.00 $94.66 DUDLEY BOROUGH $56.53 $0.00 $56.53 FRANKLIN TOWNSHIP $17.70 $0.00 $17.70 HENDERSON TOWNSHIP $83.90 $0.00 $83.90 HOPEWELL TOWNSHIP $250.07 $0.00 $250.07 HUNTINGDON BOROUGH $238.48 $0.00 $238.48 JACKSON TOWNSHIP $79.01 $0.00 $79.01 JUNIATA TOWNSHIP $47.31 $0.00 $47.31 LINCOLN TOWNSHIP $141.11 $0.00 $141.11 LOGAN TOWNSHIP $33.04 $0.00 $33.04 MAPLETON BOROUGH $17.82 $0.00 $17.82 MARKLESBURG BOROUGH $8.74 $0.00 $8.74 MILL CREEK BOROUGH $12.52 $0.00 $12.52 MILLER TOWNSHIP $33.37 $0.00 $33.37 MORRIS TOWNSHIP $19.91 $0.00 $19.91 MOUNT UNION BOROUGH $94.43 $0.00 $94.43 ONEIDA TOWNSHIP $50.18 $0.00 $50.18 ORBISONIA BOROUGH $18.01 $0.00 $18.01 PENN TOWNSHIP $484.83 $0.00 $484.83 PETERSBURG BOROUGH $16.75 $0.00 $16.75 PORTER TOWNSHIP $96.89 $0.00 $96.89 ROCKHILL BOROUGH $15.31 $0.00 $15.31 Huntingdon Page 24 of 44
- 25. County and Municipality Disbursements for 2013 SALTILLO BOROUGH $12.38 $0.00 $12.38 SHADE GAP BOROUGH $3.69 $0.00 $3.69 SHIRLEY TOWNSHIP $145.80 $0.00 $145.80 SHIRLEYSBURG BOROUGH $7.35 $0.00 $7.35 SMITHFIELD TOWNSHIP $136.37 $0.00 $136.37 SPRINGFIELD TOWNSHIP $78.12 $0.00 $78.12 SPRUCE CREEK TOWNSHIP $16.05 $0.00 $16.05 TELL TOWNSHIP $90.60 $0.00 $90.60 THREE SPRINGS BOROUGH $14.88 $0.00 $14.88 TODD TOWNSHIP $7,182.30 $0.00 $7,182.30 UNION TOWNSHIP $76.60 $0.00 $76.60 WALKER TOWNSHIP $89.50 $0.00 $89.50 WARRIORS MARK TOWNSHIP $74.27 $0.00 $74.27 WEST TOWNSHIP $53.07 $0.00 $53.07 WOOD TOWNSHIP $201.38 $0.00 $201.38 $259,752.25 $84,536.19 $344,288.44 ARMAGH BOROUGH $177.63 $0.00 $177.63 ARMSTRONG TOWNSHIP $8,680.96 $0.00 $8,680.96 BANKS TOWNSHIP $2,801.65 $0.00 $2,801.65 BLACK LICK TOWNSHIP $3,606.49 $0.00 $3,606.49 BLAIRSVILLE BOROUGH $5,068.32 $0.00 $5,068.32 BRUSH VALLEY TOWNSHIP $32,753.37 $0.00 $32,753.37 BUFFINGTON TOWNSHIP $17,047.17 $0.00 $17,047.17 BURRELL TOWNSHIP $8,656.37 $0.00 $8,656.37 CANOE TOWNSHIP $5,001.02 $0.00 $5,001.02 CENTER TOWNSHIP $62,805.96 $0.00 $62,805.96 CHERRY TREE BOROUGH $587.37 $0.00 $587.37 CHERRYHILL TOWNSHIP $62,022.33 $0.00 $62,022.33 CLYMER BOROUGH $2,365.19 $0.00 $2,365.19 CONEMAUGH TOWNSHIP $6,713.88 $0.00 $6,713.88 CREEKSIDE BOROUGH $261.20 $0.00 $261.20 EAST MAHONING TOWNSHIP $4,184.64 $0.00 $4,184.64 EAST WHEATFIELD TOWNSHIP $5,026.14 $0.00 $5,026.14 ERNEST BOROUGH $687.16 $0.00 $687.16 GLEN CAMPBELL BOROUGH $292.31 $0.00 $292.31 GRANT TOWNSHIP $3,604.14 $0.00 $3,604.14 Indiana Page 25 of 44
- 26. County and Municipality Disbursements for 2013 GREEN TOWNSHIP $29,940.95 $0.00 $29,940.95 HOMER CITY BOROUGH $2,582.58 $0.00 $2,582.58 INDIANA BOROUGH $18,470.91 $0.00 $18,470.91 MARION CENTER BOROUGH $331.15 $0.00 $331.15 MONTGOMERY TOWNSHIP $4,646.42 $0.00 $4,646.42 NORTH MAHONING TOWNSHIP $30,792.43 $0.00 $30,792.43 PINE TOWNSHIP $11,205.89 $0.00 $11,205.89 PLUMVILLE BOROUGH $242.53 $0.00 $242.53 RAYNE TOWNSHIP $9,527.77 $0.00 $9,527.77 SALTSBURG BOROUGH $1,290.83 $0.00 $1,290.83 SHELOCTA BOROUGH $223.55 $0.00 $223.55 SMICKSBURG BOROUGH $115.72 $0.00 $115.72 SOUTH MAHONING TOWNSHIP $5,621.35 $0.00 $5,621.35 WASHINGTON TOWNSHIP $7,298.26 $0.00 $7,298.26 WEST MAHONING TOWNSHIP $4,443.45 $0.00 $4,443.45 WEST WHEATFIELD TOWNSHIP $18,986.83 $0.00 $18,986.83 WHITE TOWNSHIP $31,405.08 $0.00 $31,405.08 YOUNG TOWNSHIP $52,311.90 $0.00 $52,311.90 $194,814.19 $42,895.76 $237,709.95 BARNETT TOWNSHIP $1,198.22 $0.00 $1,198.22 BEAVER TOWNSHIP $10,219.13 $0.00 $10,219.13 BELL TOWNSHIP $6,379.21 $0.00 $6,379.21 BIG RUN BOROUGH $1,349.94 $0.00 $1,349.94 BROCKWAY BOROUGH $4,539.45 $0.00 $4,539.45 BROOKVILLE BOROUGH $4,357.73 $0.00 $4,357.73 CLOVER TOWNSHIP $2,534.67 $0.00 $2,534.67 CORSICA BOROUGH $831.36 $0.00 $831.36 ELDRED TOWNSHIP $2,916.29 $0.00 $2,916.29 FALLS CREEK BOROUGH $2,144.86 $0.00 $2,144.86 GASKILL TOWNSHIP $35,877.10 $0.00 $35,877.10 HEATH TOWNSHIP $1,648.27 $0.00 $1,648.27 HENDERSON TOWNSHIP $39,921.28 $0.00 $39,921.28 KNOX TOWNSHIP $5,302.70 $0.00 $5,302.70 MCCALMONT TOWNSHIP $24,595.22 $0.00 $24,595.22 OLIVER TOWNSHIP $5,583.47 $0.00 $5,583.47 PERRY TOWNSHIP $5,701.78 $0.00 $5,701.78 Jefferson Page 26 of 44
- 27. County and Municipality Disbursements for 2013 PINE CREEK TOWNSHIP $4,283.36 $0.00 $4,283.36 POLK TOWNSHIP $42,239.96 $0.00 $42,239.96 PORTER TOWNSHIP $3,216.13 $0.00 $3,216.13 PUNXSUTAWNEY BOROUGH $12,667.66 $0.00 $12,667.66 REYNOLDSVILLE BOROUGH $5,983.24 $0.00 $5,983.24 RINGGOLD TOWNSHIP $3,919.14 $0.00 $3,919.14 ROSE TOWNSHIP $4,203.94 $0.00 $4,203.94 SNYDER TOWNSHIP $27,933.24 $0.00 $27,933.24 SUMMERVILLE BOROUGH $1,365.61 $0.00 $1,365.61 SYKESVILLE BOROUGH $2,643.29 $0.00 $2,643.29 TIMBLIN BOROUGH $443.99 $0.00 $443.99 UNION TOWNSHIP $4,461.01 $0.00 $4,461.01 WARSAW TOWNSHIP $6,771.91 $0.00 $6,771.91 WASHINGTON TOWNSHIP $55,665.76 $0.00 $55,665.76 WINSLOW TOWNSHIP $9,563.22 $0.00 $9,563.22 WORTHVILLE BOROUGH $134.37 $0.00 $134.37 YOUNG TOWNSHIP $5,739.12 $0.00 $5,739.12 Juniata $0.00 $25,000.00 $25,000.00 $6,493.80 $205,525.71 $212,019.51 ARCHBALD BOROUGH $83.52 $0.00 $83.52 BENTON TOWNSHIP $7,180.44 $0.00 $7,180.44 BLAKELY BOROUGH $65.92 $0.00 $65.92 CARBONDALE CITY $84.62 $0.00 $84.62 CARBONDALE TOWNSHIP $12.44 $0.00 $12.44 CLARKS GREEN BOROUGH $16.01 $0.00 $16.01 CLARKS SUMMIT BOROUGH $58.69 $0.00 $58.69 CLIFTON TOWNSHIP $13.98 $0.00 $13.98 COVINGTON TOWNSHIP $41.13 $0.00 $41.13 DALTON BOROUGH $16.92 $0.00 $16.92 DICKSON CITY BOROUGH $61.70 $0.00 $61.70 DUNMORE BOROUGH $143.21 $0.00 $143.21 ELMHURST TOWNSHIP $15.74 $0.00 $15.74 FELL TOWNSHIP $387.94 $0.00 $387.94 GLENBURN TOWNSHIP $18.07 $0.00 $18.07 GREENFIELD TOWNSHIP $512.42 $0.00 $512.42 JEFFERSON TOWNSHIP $54.32 $0.00 $54.32 Lackawanna Page 27 of 44
- 28. County and Municipality Disbursements for 2013 JERMYN BOROUGH $24.63 $0.00 $24.63 JESSUP BOROUGH $50.18 $0.00 $50.18 LA PLUME TOWNSHIP $95.51 $0.00 $95.51 MADISON TOWNSHIP $40.73 $0.00 $40.73 MAYFIELD BOROUGH $18.93 $0.00 $18.93 MOOSIC BOROUGH $66.70 $0.00 $66.70 MOSCOW BOROUGH $23.73 $0.00 $23.73 NEWTON TOWNSHIP $50.16 $0.00 $50.16 NORTH ABINGTON TOWNSHIP $180.45 $0.00 $180.45 OLD FORGE BOROUGH $92.90 $0.00 $92.90 OLYPHANT BOROUGH $52.61 $0.00 $52.61 RANSOM TOWNSHIP $25.37 $0.00 $25.37 ROARING BROOK TOWNSHIP $39.97 $0.00 $39.97 SCOTT TOWNSHIP $818.98 $0.00 $818.98 SCRANTON CITY $749.34 $0.00 $749.34 SOUTH ABINGTON TOWNSHIP $99.64 $0.00 $99.64 SPRING BROOK TOWNSHIP $49.92 $0.00 $49.92 TAYLOR BOROUGH $54.58 $0.00 $54.58 THORNHURST TOWNSHIP $8.09 $0.00 $8.09 THROOP BOROUGH $39.70 $0.00 $39.70 VANDLING BOROUGH $92.72 $0.00 $92.72 WAVERLY TOWNSHIP $21.29 $0.00 $21.29 WEST ABINGTON TOWNSHIP $80.80 $0.00 $80.80 Lancaster $0.00 $504,835.83 $504,835.83 $201,307.99 $86,120.19 $287,428.18 BESSEMER BOROUGH $1,463.00 $0.00 $1,463.00 ELLPORT BOROUGH $1,754.66 $0.00 $1,754.66 ELLWOOD CITY BOROUGH $9,210.64 $0.00 $9,210.64 ENON VALLEY BOROUGH $445.74 $0.00 $445.74 HICKORY TOWNSHIP $4,432.30 $0.00 $4,432.30 LITTLE BEAVER TOWNSHIP $30,647.97 $0.00 $30,647.97 MAHONING TOWNSHIP $12,816.76 $0.00 $12,816.76 NESHANNOCK TOWNSHIP $14,752.92 $0.00 $14,752.92 NEW BEAVER BOROUGH $3,418.80 $0.00 $3,418.80 NEW CASTLE CITY $29,128.32 $0.00 $29,128.32 NEW WILMINGTON BOROUGH $2,720.28 $0.00 $2,720.28 Lawrence Page 28 of 44
- 29. County and Municipality Disbursements for 2013 NORTH BEAVER TOWNSHIP $63,632.83 $0.00 $63,632.83 PERRY TOWNSHIP $37,628.56 $0.00 $37,628.56 PLAIN GROVE TOWNSHIP $3,071.82 $0.00 $3,071.82 PULASKI TOWNSHIP $66,952.08 $0.00 $66,952.08 S.N.P.J. BOROUGH $118.80 $0.00 $118.80 SCOTT TOWNSHIP $31,045.43 $0.00 $31,045.43 SHENANGO TOWNSHIP $11,998.34 $0.00 $11,998.34 SLIPPERY ROCK TOWNSHIP $7,667.16 $0.00 $7,667.16 SOUTH NEW CASTLE BOROUGH $1,083.52 $0.00 $1,083.52 TAYLOR TOWNSHIP $2,113.02 $0.00 $2,113.02 UNION TOWNSHIP $7,759.74 $0.00 $7,759.74 VOLANT BOROUGH $205.24 $0.00 $205.24 WAMPUM BOROUGH $1,018.22 $0.00 $1,018.22 WASHINGTON TOWNSHIP $2,495.70 $0.00 $2,495.70 WAYNE TOWNSHIP $4,957.26 $0.00 $4,957.26 WILMINGTON TOWNSHIP $5,341.14 $0.00 $5,341.14 Lebanon $0.00 $129,606.25 $129,606.25 Lehigh $0.00 $340,418.70 $340,418.70 Luzerne $0.00 $307,628.81 $307,628.81 $4,987,243.32 $112,277.95 $5,099,521.27 ANTHONY TOWNSHIP $83,302.77 $0.00 $83,302.77 ARMSTRONG TOWNSHIP $23,650.52 $0.00 $23,650.52 BASTRESS TOWNSHIP $8,242.53 $0.00 $8,242.53 BRADY TOWNSHIP $7,966.87 $0.00 $7,966.87 BROWN TOWNSHIP $13,746.67 $0.00 $13,746.67 CASCADE TOWNSHIP $213,732.91 $0.00 $213,732.91 CLINTON TOWNSHIP $92,876.62 $0.00 $92,876.62 COGAN HOUSE TOWNSHIP $540,829.50 $0.00 $540,829.50 CUMMINGS TOWNSHIP $515,100.00 $0.00 $515,100.00 DUBOISTOWN BOROUGH $12,341.16 $0.00 $12,341.16 ELDRED TOWNSHIP $89,190.47 $0.00 $89,190.47 FAIRFIELD TOWNSHIP $81,200.11 $0.00 $81,200.11 FRANKLIN TOWNSHIP $244,042.52 $0.00 $244,042.52 GAMBLE TOWNSHIP $323,322.24 $0.00 $323,322.24 HEPBURN TOWNSHIP $99,982.26 $0.00 $99,982.26 HUGHESVILLE BOROUGH $50,764.35 $0.00 $50,764.35 Lycoming Page 29 of 44
- 30. County and Municipality Disbursements for 2013 JACKSON TOWNSHIP $71,269.47 $0.00 $71,269.47 JERSEY SHORE BOROUGH $102,595.28 $0.00 $102,595.28 JORDAN TOWNSHIP $105,169.47 $0.00 $105,169.47 LEWIS TOWNSHIP $387,712.88 $0.00 $387,712.88 LIMESTONE TOWNSHIP $36,704.80 $0.00 $36,704.80 LOYALSOCK TOWNSHIP $304,718.73 $0.00 $304,718.73 LYCOMING TOWNSHIP $95,601.62 $0.00 $95,601.62 MCHENRY TOWNSHIP $338,104.50 $0.00 $338,104.50 MCINTYRE TOWNSHIP $173,246.01 $0.00 $173,246.01 MCNETT TOWNSHIP $64,968.10 $0.00 $64,968.10 MIFFLIN TOWNSHIP $196,448.68 $0.00 $196,448.68 MILL CREEK TOWNSHIP $45,704.07 $0.00 $45,704.07 MONTGOMERY BOROUGH $17,422.71 $0.00 $17,422.71 MONTOURSVILLE BOROUGH $120,768.59 $0.00 $120,768.59 MORELAND TOWNSHIP $148,199.26 $0.00 $148,199.26 MUNCY BOROUGH $27,187.31 $0.00 $27,187.31 MUNCY CREEK TOWNSHIP $110,560.51 $0.00 $110,560.51 MUNCY TOWNSHIP $49,695.06 $0.00 $49,695.06 NIPPENOSE TOWNSHIP $28,233.89 $0.00 $28,233.89 OLD LYCOMING TOWNSHIP $149,191.49 $0.00 $149,191.49 PENN TOWNSHIP $495,867.40 $0.00 $495,867.40 PIATT TOWNSHIP $49,069.82 $0.00 $49,069.82 PICTURE ROCKS BOROUGH $20,034.32 $0.00 $20,034.32 PINE TOWNSHIP $92,606.32 $0.00 $92,606.32 PLUNKETTS CREEK TOWNSHIP $35,737.17 $0.00 $35,737.17 PORTER TOWNSHIP $53,490.21 $0.00 $53,490.21 SALLADASBURG BOROUGH $5,332.15 $0.00 $5,332.15 SHREWSBURY TOWNSHIP $60,217.05 $0.00 $60,217.05 SOUTH WILLIAMSPORT BOROUGH $148,874.38 $0.00 $148,874.38 SUSQUEHANNA TOWNSHIP $12,141.87 $0.00 $12,141.87 UPPER FAIRFIELD TOWNSHIP $231,966.63 $0.00 $231,966.63 WASHINGTON TOWNSHIP $37,093.31 $0.00 $37,093.31 WATSON TOWNSHIP $100,515.58 $0.00 $100,515.58 WILLIAMSPORT CITY $689,279.63 $0.00 $689,279.63 WOLF TOWNSHIP $111,885.34 $0.00 $111,885.34 WOODWARD TOWNSHIP $66,884.14 $0.00 $66,884.14 Page 30 of 44
- 31. County and Municipality Disbursements for 2013 $396,122.19 $41,327.08 $437,449.27 ANNIN TOWNSHIP $11,857.31 $0.00 $11,857.31 BRADFORD CITY $42,035.04 $0.00 $42,035.04 BRADFORD TOWNSHIP $62,673.26 $0.00 $62,673.26 CERES TOWNSHIP $11,723.54 $0.00 $11,723.54 CORYDON TOWNSHIP $10,182.51 $0.00 $10,182.51 ELDRED BOROUGH $2,072.12 $0.00 $2,072.12 ELDRED TOWNSHIP $14,989.16 $0.00 $14,989.16 FOSTER TOWNSHIP $26,874.14 $0.00 $26,874.14 HAMILTON TOWNSHIP $5,407.03 $0.00 $5,407.03 HAMLIN TOWNSHIP $26,047.07 $0.00 $26,047.07 KANE BOROUGH $19,258.50 $0.00 $19,258.50 KEATING TOWNSHIP $40,049.60 $0.00 $40,049.60 LAFAYETTE TOWNSHIP $48,035.94 $0.00 $48,035.94 LEWIS RUN BOROUGH $3,303.25 $0.00 $3,303.25 LIBERTY TOWNSHIP $22,150.66 $0.00 $22,150.66 MOUNT JEWETT BOROUGH $5,481.43 $0.00 $5,481.43 NORWICH TOWNSHIP $113,670.07 $0.00 $113,670.07 OTTO TOWNSHIP $11,288.81 $0.00 $11,288.81 PORT ALLEGANY BOROUGH $5,579.90 $0.00 $5,579.90 SERGEANT TOWNSHIP $136,499.18 $0.00 $136,499.18 SMETHPORT BOROUGH $9,723.71 $0.00 $9,723.71 WETMORE TOWNSHIP $75,314.48 $0.00 $75,314.48 $168,838.96 $110,828.10 $279,667.06 CLARK BOROUGH $673.01 $0.00 $673.01 COOLSPRING TOWNSHIP $2,909.46 $0.00 $2,909.46 DEER CREEK TOWNSHIP $1,315.91 $0.00 $1,315.91 DELAWARE TOWNSHIP $3,918.71 $0.00 $3,918.71 EAST LACKAWANNOCK TOWNSHIP $15,910.69 $0.00 $15,910.69 FAIRVIEW TOWNSHIP $8,466.21 $0.00 $8,466.21 FARRELL CITY $4,687.94 $0.00 $4,687.94 FINDLEY TOWNSHIP $3,775.93 $0.00 $3,775.93 FREDONIA BOROUGH $493.59 $0.00 $493.59 FRENCH CREEK TOWNSHIP $2,373.15 $0.00 $2,373.15 GREENE TOWNSHIP $9,403.14 $0.00 $9,403.14 GREENVILLE BOROUGH $5,187.17 $0.00 $5,187.17 McKean Mercer Page 31 of 44
- 32. County and Municipality Disbursements for 2013 GROVE CITY BOROUGH $6,422.14 $0.00 $6,422.14 HEMPFIELD TOWNSHIP $3,787.46 $0.00 $3,787.46 HERMITAGE CITY $14,730.64 $0.00 $14,730.64 JACKSON CENTER BOROUGH $204.96 $0.00 $204.96 JACKSON TOWNSHIP $1,989.99 $0.00 $1,989.99 JAMESTOWN BOROUGH $582.82 $0.00 $582.82 JEFFERSON TOWNSHIP $63,218.76 $0.00 $63,218.76 LACKAWANNOCK TOWNSHIP $9,810.75 $0.00 $9,810.75 LAKE TOWNSHIP $8,572.91 $0.00 $8,572.91 LIBERTY TOWNSHIP $1,888.84 $0.00 $1,888.84 MERCER BOROUGH $1,806.46 $0.00 $1,806.46 MILL CREEK TOWNSHIP $2,251.70 $0.00 $2,251.70 NEW LEBANON BOROUGH $237.42 $0.00 $237.42 NEW VERNON TOWNSHIP $1,894.91 $0.00 $1,894.91 OTTER CREEK TOWNSHIP $8,284.03 $0.00 $8,284.03 PERRY TOWNSHIP $2,296.38 $0.00 $2,296.38 PINE TOWNSHIP $5,541.41 $0.00 $5,541.41 PYMATUNING TOWNSHIP $3,946.95 $0.00 $3,946.95 SALEM TOWNSHIP $1,650.13 $0.00 $1,650.13 SANDY CREEK TOWNSHIP $1,895.97 $0.00 $1,895.97 SANDY LAKE BOROUGH $674.61 $0.00 $674.61 SANDY LAKE TOWNSHIP $2,380.97 $0.00 $2,380.97 SHARON CITY $5,254.42 $0.00 $5,254.42 SHARPSVILLE BOROUGH $1,633.52 $0.00 $1,633.52 SHEAKLEYVILLE BOROUGH $42.59 $0.00 $42.59 SHENANGO TOWNSHIP $57,903.73 $0.00 $57,903.73 SOUTH PYMATUNING TOWNSHIP $3,002.99 $0.00 $3,002.99 SPRINGFIELD TOWNSHIP $3,322.13 $0.00 $3,322.13 STONEBORO BOROUGH $958.07 $0.00 $958.07 SUGAR GROVE TOWNSHIP $1,380.02 $0.00 $1,380.02 WEST MIDDLESEX BOROUGH $753.26 $0.00 $753.26 WEST SALEM TOWNSHIP $17,848.48 $0.00 $17,848.48 WHEATLAND BOROUGH $700.06 $0.00 $700.06 WILMINGTON TOWNSHIP $1,813.86 $0.00 $1,813.86 WOLF CREEK TOWNSHIP $915.11 $0.00 $915.11 WORTH TOWNSHIP $1,443.81 $0.00 $1,443.81 Page 32 of 44
- 33. County and Municipality Disbursements for 2013 Mifflin $0.00 $44,820.91 $44,820.91 Monroe $0.00 $161,753.15 $161,753.15 Montgomery $0.00 $774,718.60 $774,718.60 Montour $0.00 $25,000.00 $25,000.00 Northampton $0.00 $286,776.97 $286,776.97 Northumberland $0.00 $90,487.01 $90,487.01 Perry $0.00 $43,793.65 $43,793.65 Philadelphia $0.00 $1,483,016.99 $1,483,016.99 Pike $0.00 $54,524.30 $54,524.30 $376,640.77 $25,000.00 $401,640.77 ABBOTT TOWNSHIP $17,049.31 $0.00 $17,049.31 ALLEGANY TOWNSHIP $37,824.47 $0.00 $37,824.47 AUSTIN BOROUGH $6,152.12 $0.00 $6,152.12 BINGHAM TOWNSHIP $13,682.59 $0.00 $13,682.59 CLARA TOWNSHIP $44,468.63 $0.00 $44,468.63 COUDERSPORT BOROUGH $37,794.94 $0.00 $37,794.94 EULALIA TOWNSHIP $12,365.60 $0.00 $12,365.60 GALETON BOROUGH $11,375.63 $0.00 $11,375.63 GENESEE TOWNSHIP $11,471.55 $0.00 $11,471.55 HARRISON TOWNSHIP $21,874.25 $0.00 $21,874.25 HEBRON TOWNSHIP $20,761.54 $0.00 $20,761.54 HECTOR TOWNSHIP $35,492.91 $0.00 $35,492.91 HOMER TOWNSHIP $8,039.49 $0.00 $8,039.49 KEATING TOWNSHIP $28,529.99 $0.00 $28,529.99 OSWAYO BOROUGH $1,970.64 $0.00 $1,970.64 OSWAYO TOWNSHIP $8,570.56 $0.00 $8,570.56 PIKE TOWNSHIP $5,562.62 $0.00 $5,562.62 PLEASANT VALLEY TOWNSHIP $83,634.20 $0.00 $83,634.20 PORTAGE TOWNSHIP $2,252.78 $0.00 $2,252.78 ROULETTE TOWNSHIP $14,104.87 $0.00 $14,104.87 SHARON TOWNSHIP $15,802.39 $0.00 $15,802.39 SHINGLEHOUSE BOROUGH $5,279.09 $0.00 $5,279.09 STEWARDSON TOWNSHIP $2,829.92 $0.00 $2,829.92 SUMMIT TOWNSHIP $4,608.46 $0.00 $4,608.46 SWEDEN TOWNSHIP $31,976.90 $0.00 $31,976.90 SYLVANIA TOWNSHIP $15,244.65 $0.00 $15,244.65 Potter Page 33 of 44
- 34. County and Municipality Disbursements for 2013 ULYSSES BOROUGH $6,460.37 $0.00 $6,460.37 ULYSSES TOWNSHIP $11,496.62 $0.00 $11,496.62 WEST BRANCH TOWNSHIP $122,598.87 $0.00 $122,598.87 WHARTON TOWNSHIP $30,306.93 $0.00 $30,306.93 Schuylkill $0.00 $140,925.26 $140,925.26 Snyder $0.00 $38,016.28 $38,016.28 $123,382.32 $73,745.17 $197,127.49 ADDISON BOROUGH $165.67 $0.00 $165.67 ADDISON TOWNSHIP $69,374.62 $0.00 $69,374.62 ALLEGHENY TOWNSHIP $2,173.60 $0.00 $2,173.60 BENSON BOROUGH $81.46 $0.00 $81.46 BERLIN BOROUGH $1,879.15 $0.00 $1,879.15 BLACK TOWNSHIP $8,249.51 $0.00 $8,249.51 BOSWELL BOROUGH $488.61 $0.00 $488.61 BROTHERSVALLEY TOWNSHIP $10,743.35 $0.00 $10,743.35 CALLIMONT BOROUGH $128.47 $0.00 $128.47 CASSELMAN BOROUGH $147.58 $0.00 $147.58 CENTRAL CITY BOROUGH $502.16 $0.00 $502.16 CONEMAUGH TOWNSHIP $7,691.80 $0.00 $7,691.80 CONFLUENCE BOROUGH $782.73 $0.00 $782.73 ELK LICK TOWNSHIP $3,355.44 $0.00 $3,355.44 FAIRHOPE TOWNSHIP $208.39 $0.00 $208.39 GARRETT BOROUGH $436.15 $0.00 $436.15 GREENVILLE TOWNSHIP $628.65 $0.00 $628.65 HOOVERSVILLE BOROUGH $276.07 $0.00 $276.07 INDIAN LAKE BOROUGH $1,114.65 $0.00 $1,114.65 JEFFERSON TOWNSHIP $22,839.52 $0.00 $22,839.52 JENNER TOWNSHIP $5,821.11 $0.00 $5,821.11 JENNERSTOWN BOROUGH $323.54 $0.00 $323.54 LARIMER TOWNSHIP $1,081.30 $0.00 $1,081.30 LINCOLN TOWNSHIP $2,811.63 $0.00 $2,811.63 LOWER TURKEYFOOT TOWNSHIP $7,933.35 $0.00 $7,933.35 MEYERSDALE BOROUGH $880.57 $0.00 $880.57 MIDDLECREEK TOWNSHIP $15,166.49 $0.00 $15,166.49 MILFORD TOWNSHIP $2,143.69 $0.00 $2,143.69 NEW BALTIMORE BOROUGH $71.44 $0.00 $71.44 Somerset Page 34 of 44
- 35. County and Municipality Disbursements for 2013 NEW CENTERVILLE BOROUGH $151.07 $0.00 $151.07 NORTHAMPTON TOWNSHIP $1,402.57 $0.00 $1,402.57 OGLE TOWNSHIP $1,038.57 $0.00 $1,038.57 PAINT BOROUGH $391.36 $0.00 $391.36 PAINT TOWNSHIP $3,092.95 $0.00 $3,092.95 QUEMAHONING TOWNSHIP $3,510.05 $0.00 $3,510.05 ROCKWOOD BOROUGH $717.92 $0.00 $717.92 SALISBURY BOROUGH $309.89 $0.00 $309.89 SEVEN SPRINGS BOROUGH $140.21 $0.00 $140.21 SHADE TOWNSHIP $4,284.57 $0.00 $4,284.57 SHANKSVILLE BOROUGH $191.55 $0.00 $191.55 SOMERSET BOROUGH $5,203.83 $0.00 $5,203.83 SOMERSET TOWNSHIP $12,714.01 $0.00 $12,714.01 SOUTHAMPTON TOWNSHIP $484.80 $0.00 $484.80 STONYCREEK TOWNSHIP $10,385.68 $0.00 $10,385.68 STOYSTOWN BOROUGH $135.76 $0.00 $135.76 SUMMIT TOWNSHIP $3,323.34 $0.00 $3,323.34 UPPER TURKEYFOOT TOWNSHIP $2,492.57 $0.00 $2,492.57 URSINA BOROUGH $241.27 $0.00 $241.27 WELLERSBURG BOROUGH $96.98 $0.00 $96.98 WINDBER BOROUGH $1,535.75 $0.00 $1,535.75 $532,492.12 $25,000.00 $557,492.12 CHERRY TOWNSHIP $329,842.53 $0.00 $329,842.53 COLLEY TOWNSHIP $76,348.17 $0.00 $76,348.17 DAVIDSON TOWNSHIP $59,212.18 $0.00 $59,212.18 DUSHORE BOROUGH $20,789.48 $0.00 $20,789.48 EAGLES MERE BOROUGH $7,917.44 $0.00 $7,917.44 ELKLAND TOWNSHIP $170,448.98 $0.00 $170,448.98 FORKS TOWNSHIP $83,339.36 $0.00 $83,339.36 FORKSVILLE BOROUGH $5,266.66 $0.00 $5,266.66 FOX TOWNSHIP $107,619.70 $0.00 $107,619.70 HILLSGROVE TOWNSHIP $13,925.04 $0.00 $13,925.04 LAPORTE BOROUGH $14,507.96 $0.00 $14,507.96 LAPORTE TOWNSHIP $24,995.46 $0.00 $24,995.46 SHREWSBURY TOWNSHIP $32,439.37 $0.00 $32,439.37 $5,415,834.54 $40,914.06 $5,456,748.60Susquehanna Sullivan Page 35 of 44
- 36. County and Municipality Disbursements for 2013 APOLACON TOWNSHIP $115,756.26 $0.00 $115,756.26 ARARAT TOWNSHIP $64,493.50 $0.00 $64,493.50 AUBURN TOWNSHIP $587,691.17 $0.00 $587,691.17 BRIDGEWATER TOWNSHIP $507,001.79 $0.00 $507,001.79 BROOKLYN TOWNSHIP $354,042.17 $0.00 $354,042.17 CHOCONUT TOWNSHIP $85,926.93 $0.00 $85,926.93 CLIFFORD TOWNSHIP $196,669.29 $0.00 $196,669.29 DIMOCK TOWNSHIP $515,100.00 $0.00 $515,100.00 FOREST CITY BOROUGH $107,544.58 $0.00 $107,544.58 FOREST LAKE TOWNSHIP $464,907.47 $0.00 $464,907.47 FRANKLIN TOWNSHIP $236,400.59 $0.00 $236,400.59 FRIENDSVILLE BOROUGH $9,815.52 $0.00 $9,815.52 GIBSON TOWNSHIP $267,104.81 $0.00 $267,104.81 GREAT BEND BOROUGH $41,995.28 $0.00 $41,995.28 GREAT BEND TOWNSHIP $150,830.16 $0.00 $150,830.16 HALLSTEAD BOROUGH $71,135.22 $0.00 $71,135.22 HARFORD TOWNSHIP $382,735.71 $0.00 $382,735.71 HARMONY TOWNSHIP $72,738.48 $0.00 $72,738.48 HERRICK TOWNSHIP $89,221.58 $0.00 $89,221.58 HOP BOTTOM BOROUGH $19,068.26 $0.00 $19,068.26 JACKSON TOWNSHIP $223,392.17 $0.00 $223,392.17 JESSUP TOWNSHIP $332,035.22 $0.00 $332,035.22 LANESBORO BOROUGH $29,946.06 $0.00 $29,946.06 LATHROP TOWNSHIP $206,181.19 $0.00 $206,181.19 LENOX TOWNSHIP $443,570.37 $0.00 $443,570.37 LIBERTY TOWNSHIP $363,365.12 $0.00 $363,365.12 LITTLE MEADOWS BOROUGH $20,381.56 $0.00 $20,381.56 MIDDLETOWN TOWNSHIP $105,522.49 $0.00 $105,522.49 MONTROSE BOROUGH $93,332.22 $0.00 $93,332.22 NEW MILFORD BOROUGH $48,432.96 $0.00 $48,432.96 NEW MILFORD TOWNSHIP $515,100.00 $0.00 $515,100.00 OAKLAND BOROUGH $37,922.24 $0.00 $37,922.24 OAKLAND TOWNSHIP $41,404.78 $0.00 $41,404.78 RUSH TOWNSHIP $515,100.00 $0.00 $515,100.00 SILVER LAKE TOWNSHIP $322,941.07 $0.00 $322,941.07 SPRINGVILLE TOWNSHIP $534,437.20 $0.00 $534,437.20 Susquehanna Page 36 of 44
- 37. County and Municipality Disbursements for 2013 SUSQUEHANNA DEPOT BOROUGH $95,969.26 $0.00 $95,969.26 THOMPSON BOROUGH $16,890.42 $0.00 $16,890.42 THOMPSON TOWNSHIP $71,731.67 $0.00 $71,731.67 UNION DALE BOROUGH $19,158.16 $0.00 $19,158.16 $4,363,837.90 $40,800.03 $4,404,637.93 BLOSS TOWNSHIP $252,887.91 $0.00 $252,887.91 BLOSSBURG BOROUGH $117,911.23 $0.00 $117,911.23 BROOKFIELD TOWNSHIP $72,651.80 $0.00 $72,651.80 CHARLESTON TOWNSHIP $515,333.68 $0.00 $515,333.68 CHATHAM TOWNSHIP $283,515.89 $0.00 $283,515.89 CLYMER TOWNSHIP $115,722.58 $0.00 $115,722.58 COVINGTON TOWNSHIP $437,670.29 $0.00 $437,670.29 DEERFIELD TOWNSHIP $91,948.30 $0.00 $91,948.30 DELMAR TOWNSHIP $515,100.00 $0.00 $515,100.00 DUNCAN TOWNSHIP $173,583.54 $0.00 $173,583.54 ELK TOWNSHIP $77,247.08 $0.00 $77,247.08 ELKLAND BOROUGH $85,478.36 $0.00 $85,478.36 FARMINGTON TOWNSHIP $112,521.92 $0.00 $112,521.92 GAINES TOWNSHIP $261,614.67 $0.00 $261,614.67 HAMILTON TOWNSHIP $50,824.73 $0.00 $50,824.73 JACKSON TOWNSHIP $442,042.65 $0.00 $442,042.65 KNOXVILLE BOROUGH $29,610.28 $0.00 $29,610.28 LAWRENCE TOWNSHIP $137,113.10 $0.00 $137,113.10 LAWRENCEVILLE BOROUGH $27,353.46 $0.00 $27,353.46 LIBERTY BOROUGH $12,102.28 $0.00 $12,102.28 LIBERTY TOWNSHIP $355,389.67 $0.00 $355,389.67 MANSFIELD BOROUGH $155,994.78 $0.00 $155,994.78 MIDDLEBURY TOWNSHIP $121,310.26 $0.00 $121,310.26 MORRIS TOWNSHIP $83,798.16 $0.00 $83,798.16 NELSON TOWNSHIP $37,767.42 $0.00 $37,767.42 OSCEOLA TOWNSHIP $67,594.43 $0.00 $67,594.43 PUTNAM TOWNSHIP $18,329.66 $0.00 $18,329.66 RICHMOND TOWNSHIP $384,985.97 $0.00 $384,985.97 ROSEVILLE BOROUGH $8,317.10 $0.00 $8,317.10 RUTLAND TOWNSHIP $313,579.43 $0.00 $313,579.43 SHIPPEN TOWNSHIP $111,311.95 $0.00 $111,311.95 Tioga Page 37 of 44
- 38. County and Municipality Disbursements for 2013 SULLIVAN TOWNSHIP $745,615.30 $0.00 $745,615.30 TIOGA BOROUGH $29,872.82 $0.00 $29,872.82 TIOGA TOWNSHIP $90,238.48 $0.00 $90,238.48 UNION TOWNSHIP $387,279.40 $0.00 $387,279.40 WARD TOWNSHIP $474,264.66 $0.00 $474,264.66 WELLSBORO BOROUGH $155,299.52 $0.00 $155,299.52 WESTFIELD BOROUGH $49,521.36 $0.00 $49,521.36 WESTFIELD TOWNSHIP $79,357.88 $0.00 $79,357.88 Union $0.00 $43,075.91 $43,075.91 $32,469.03 $52,006.94 $84,475.97 ALLEGHENY TOWNSHIP $217.49 $0.00 $217.49 BARKEYVILLE BOROUGH $42.93 $0.00 $42.93 CANAL TOWNSHIP $724.06 $0.00 $724.06 CHERRYTREE TOWNSHIP $1,219.03 $0.00 $1,219.03 CLINTON TOWNSHIP $532.60 $0.00 $532.60 CLINTONVILLE BOROUGH $74.38 $0.00 $74.38 COOPERSTOWN BOROUGH $72.51 $0.00 $72.51 CORNPLANTER TOWNSHIP $1,214.24 $0.00 $1,214.24 CRANBERRY TOWNSHIP $2,568.70 $0.00 $2,568.70 EMLENTON BOROUGH $226.51 $0.00 $226.51 FRANKLIN CITY $1,957.73 $0.00 $1,957.73 FRENCHCREEK TOWNSHIP $14,213.95 $0.00 $14,213.95 IRWIN TOWNSHIP $956.58 $0.00 $956.58 JACKSON TOWNSHIP $816.64 $0.00 $816.64 MINERAL TOWNSHIP $427.77 $0.00 $427.77 OAKLAND TOWNSHIP $7,571.41 $0.00 $7,571.41 OIL CITY CITY $3,247.38 $0.00 $3,247.38 OIL CREEK TOWNSHIP $314.09 $0.00 $314.09 PINEGROVE TOWNSHIP $839.86 $0.00 $839.86 PLEASANTVILLE BOROUGH $127.25 $0.00 $127.25 PLUM TOWNSHIP $788.71 $0.00 $788.71 POLK BOROUGH $238.58 $0.00 $238.58 PRESIDENT TOWNSHIP $465.52 $0.00 $465.52 RICHLAND TOWNSHIP $13,937.46 $0.00 $13,937.46 ROCKLAND TOWNSHIP $1,093.74 $0.00 $1,093.74 ROUSEVILLE BOROUGH $183.33 $0.00 $183.33 Venango Page 38 of 44
- 39. County and Municipality Disbursements for 2013 SANDYCREEK TOWNSHIP $834.67 $0.00 $834.67 SCRUBGRASS TOWNSHIP $440.00 $0.00 $440.00 SUGARCREEK BOROUGH $1,971.12 $0.00 $1,971.12 UTICA BOROUGH $93.47 $0.00 $93.47 VICTORY TOWNSHIP $310.42 $0.00 $310.42 $19,481.41 $39,428.76 $58,910.17 BEAR LAKE BOROUGH $22.06 $0.00 $22.06 BROKENSTRAW TOWNSHIP $7,488.54 $0.00 $7,488.54 CHERRY GROVE TOWNSHIP $79.83 $0.00 $79.83 CLARENDON BOROUGH $104.39 $0.00 $104.39 COLUMBUS TOWNSHIP $480.49 $0.00 $480.49 CONEWANGO TOWNSHIP $1,087.18 $0.00 $1,087.18 DEERFIELD TOWNSHIP $315.65 $0.00 $315.65 ELDRED TOWNSHIP $557.62 $0.00 $557.62 ELK TOWNSHIP $294.77 $0.00 $294.77 FARMINGTON TOWNSHIP $792.21 $0.00 $792.21 FREEHOLD TOWNSHIP $768.48 $0.00 $768.48 GLADE TOWNSHIP $653.21 $0.00 $653.21 LIMESTONE TOWNSHIP $200.69 $0.00 $200.69 MEAD TOWNSHIP $7,087.08 $0.00 $7,087.08 PINE GROVE TOWNSHIP $846.04 $0.00 $846.04 PITTSFIELD TOWNSHIP $7,289.71 $0.00 $7,289.71 PLEASANT TOWNSHIP $624.90 $0.00 $624.90 SHEFFIELD TOWNSHIP $556.79 $0.00 $556.79 SOUTHWEST TOWNSHIP $470.32 $0.00 $470.32 SPRING CREEK TOWNSHIP $762.28 $0.00 $762.28 SUGAR GROVE BOROUGH $67.97 $0.00 $67.97 SUGAR GROVE TOWNSHIP $919.54 $0.00 $919.54 TIDIOUTE BOROUGH $84.62 $0.00 $84.62 TRIUMPH TOWNSHIP $377.81 $0.00 $377.81 WARREN CITY $2,214.60 $0.00 $2,214.60 WATSON TOWNSHIP $72.78 $0.00 $72.78 YOUNGSVILLE BOROUGH $413.49 $0.00 $413.49 $5,915,857.64 $200,005.15 $6,115,862.79 ALLENPORT BOROUGH $11,480.00 $0.00 $11,480.00 AMWELL TOWNSHIP $609,545.31 $0.00 $609,545.31 Warren Washington Page 39 of 44
- 40. County and Municipality Disbursements for 2013 BEALLSVILLE BOROUGH $7,495.22 $0.00 $7,495.22 BENTLEYVILLE BOROUGH $49,220.86 $0.00 $49,220.86 BLAINE TOWNSHIP $58,150.28 $0.00 $58,150.28 BUFFALO TOWNSHIP $176,747.49 $0.00 $176,747.49 BURGETTSTOWN BOROUGH $23,706.50 $0.00 $23,706.50 CALIFORNIA BOROUGH $100,615.26 $0.00 $100,615.26 CANONSBURG BOROUGH $135,353.28 $0.00 $135,353.28 CANTON TOWNSHIP $285,362.59 $0.00 $285,362.59 CARROLL TOWNSHIP $190,001.31 $0.00 $190,001.31 CECIL TOWNSHIP $283,888.79 $0.00 $283,888.79 CENTERVILLE BOROUGH $107,427.78 $0.00 $107,427.78 CHARLEROI BOROUGH $63,573.82 $0.00 $63,573.82 CHARTIERS TOWNSHIP $608,011.57 $0.00 $608,011.57 CLAYSVILLE BOROUGH $12,336.62 $0.00 $12,336.62 COAL CENTER BOROUGH $2,657.08 $0.00 $2,657.08 COKEBURG BOROUGH $12,948.52 $0.00 $12,948.52 CROSS CREEK TOWNSHIP $515,100.00 $0.00 $515,100.00 DEEMSTON BOROUGH $84,768.38 $0.00 $84,768.38 DONEGAL TOWNSHIP $428,551.17 $0.00 $428,551.17 DONORA BOROUGH $86,781.60 $0.00 $86,781.60 DUNLEVY BOROUGH $6,805.38 $0.00 $6,805.38 EAST BETHLEHEM TOWNSHIP $50,978.70 $0.00 $50,978.70 EAST FINLEY TOWNSHIP $91,044.02 $0.00 $91,044.02 EAST WASHINGTON BOROUGH $31,432.16 $0.00 $31,432.16 ELCO BOROUGH $6,405.34 $0.00 $6,405.34 ELLSWORTH BOROUGH $17,387.16 $0.00 $17,387.16 FALLOWFIELD TOWNSHIP $139,363.18 $0.00 $139,363.18 FINLEYVILLE BOROUGH $7,151.26 $0.00 $7,151.26 GREEN HILLS BOROUGH $308.24 $0.00 $308.24 HANOVER TOWNSHIP $134,957.86 $0.00 $134,957.86 HOPEWELL TOWNSHIP $515,100.00 $0.00 $515,100.00 HOUSTON BOROUGH $18,167.94 $0.00 $18,167.94 INDEPENDENCE TOWNSHIP $484,683.03 $0.00 $484,683.03 JEFFERSON TOWNSHIP $81,482.12 $0.00 $81,482.12 LONG BRANCH BOROUGH $13,760.92 $0.00 $13,760.92 MARIANNA BOROUGH $13,950.84 $0.00 $13,950.84 Washington Page 40 of 44
- 41. County and Municipality Disbursements for 2013 MCDONALD BOROUGH $28,303.48 $0.00 $28,303.48 MIDWAY BOROUGH $15,601.90 $0.00 $15,601.90 MONONGAHELA CITY $73,136.10 $0.00 $73,136.10 MORRIS TOWNSHIP $515,100.00 $0.00 $515,100.00 MOUNT PLEASANT TOWNSHIP $600,295.07 $0.00 $600,295.07 NEW EAGLE BOROUGH $37,223.46 $0.00 $37,223.46 NORTH BETHLEHEM TOWNSHIP $149,836.46 $0.00 $149,836.46 NORTH CHARLEROI BOROUGH $21,252.82 $0.00 $21,252.82 NORTH FRANKLIN TOWNSHIP $163,685.16 $0.00 $163,685.16 NORTH STRABANE TOWNSHIP $236,580.74 $0.00 $236,580.74 NOTTINGHAM TOWNSHIP $73,292.46 $0.00 $73,292.46 PETERS TOWNSHIP $365,889.28 $0.00 $365,889.28 ROBINSON TOWNSHIP $182,008.37 $0.00 $182,008.37 ROSCOE BOROUGH $14,539.00 $0.00 $14,539.00 SMITH TOWNSHIP $385,181.16 $0.00 $385,181.16 SOMERSET TOWNSHIP $205,359.63 $0.00 $205,359.63 SOUTH FRANKLIN TOWNSHIP $342,345.48 $0.00 $342,345.48 SOUTH STRABANE TOWNSHIP $172,378.98 $0.00 $172,378.98 SPEERS BOROUGH $21,107.00 $0.00 $21,107.00 STOCKDALE BOROUGH $7,876.84 $0.00 $7,876.84 TWILIGHT BOROUGH $6,421.88 $0.00 $6,421.88 UNION TOWNSHIP $162,436.12 $0.00 $162,436.12 WASHINGTON CITY $207,988.20 $0.00 $207,988.20 WEST BETHLEHEM TOWNSHIP $252,935.48 $0.00 $252,935.48 WEST BROWNSVILLE BOROUGH $23,428.58 $0.00 $23,428.58 WEST FINLEY TOWNSHIP $261,718.02 $0.00 $261,718.02 WEST MIDDLETOWN BOROUGH $3,142.06 $0.00 $3,142.06 WEST PIKE RUN TOWNSHIP $101,311.86 $0.00 $101,311.86 Wayne $0.00 $49,786.64 $49,786.64 $1,357,205.54 $348,228.56 $1,705,434.10 ADAMSBURG BOROUGH $511.78 $0.00 $511.78 ALLEGHENY TOWNSHIP $24,061.89 $0.00 $24,061.89 ARNOLD CITY $12,155.96 $0.00 $12,155.96 ARONA BOROUGH $801.06 $0.00 $801.06 AVONMORE BOROUGH $2,526.85 $0.00 $2,526.85 BELL TOWNSHIP $43,673.70 $0.00 $43,673.70 Westmoreland Page 41 of 44
- 42. County and Municipality Disbursements for 2013 BOLIVAR BOROUGH $1,425.75 $0.00 $1,425.75 COOK TOWNSHIP $38,217.14 $0.00 $38,217.14 DELMONT BOROUGH $6,504.63 $0.00 $6,504.63 DERRY BOROUGH $6,659.21 $0.00 $6,659.21 DERRY TOWNSHIP $428,321.83 $0.00 $428,321.83 DONEGAL BOROUGH $334.49 $0.00 $334.49 DONEGAL TOWNSHIP $62,461.62 $0.00 $62,461.62 EAST HUNTINGDON TOWNSHIP $25,055.27 $0.00 $25,055.27 EAST VANDERGRIFT BOROUGH $709.11 $0.00 $709.11 EXPORT BOROUGH $2,435.02 $0.00 $2,435.02 FAIRFIELD TOWNSHIP $81,269.90 $0.00 $81,269.90 GREENSBURG CITY $31,830.53 $0.00 $31,830.53 HEMPFIELD TOWNSHIP $144,565.79 $0.00 $144,565.79 HUNKER BOROUGH $857.89 $0.00 $857.89 HYDE PARK BOROUGH $1,599.90 $0.00 $1,599.90 IRWIN BOROUGH $9,390.80 $0.00 $9,390.80 JEANNETTE CITY $22,760.84 $0.00 $22,760.84 LATROBE BOROUGH $20,778.94 $0.00 $20,778.94 LAUREL MOUNTAIN BOROUGH $640.60 $0.00 $640.60 LIGONIER BOROUGH $4,306.64 $0.00 $4,306.64 LIGONIER TOWNSHIP $48,167.02 $0.00 $48,167.02 LOWER BURRELL CITY $28,486.84 $0.00 $28,486.84 LOYALHANNA TOWNSHIP $21,984.08 $0.00 $21,984.08 MADISON BOROUGH $723.80 $0.00 $723.80 MANOR BOROUGH $7,269.73 $0.00 $7,269.73 MONESSEN CITY $20,492.32 $0.00 $20,492.32 MOUNT PLEASANT BOROUGH $4,792.59 $0.00 $4,792.59 MOUNT PLEASANT TOWNSHIP $34,924.87 $0.00 $34,924.87 MURRYSVILLE BOROUGH $56,781.01 $0.00 $56,781.01 NEW ALEXANDRIA BOROUGH $1,536.56 $0.00 $1,536.56 NEW FLORENCE BOROUGH $2,520.28 $0.00 $2,520.28 NEW KENSINGTON CITY $29,555.10 $0.00 $29,555.10 NEW STANTON BOROUGH $6,036.66 $0.00 $6,036.66 NORTH BELLE VERNON BOROUGH $4,606.90 $0.00 $4,606.90 NORTH HUNTINGDON TOWNSHIP $75,633.47 $0.00 $75,633.47 NORTH IRWIN BOROUGH $2,012.51 $0.00 $2,012.51 Westmoreland Page 42 of 44
- 43. County and Municipality Disbursements for 2013 OKLAHOMA BOROUGH $1,586.93 $0.00 $1,586.93 PENN BOROUGH $1,289.03 $0.00 $1,289.03 PENN TOWNSHIP $49,340.30 $0.00 $49,340.30 ROSTRAVER TOWNSHIP $52,902.36 $0.00 $52,902.36 SALEM TOWNSHIP $62,094.18 $0.00 $62,094.18 SCOTTDALE BOROUGH $10,826.13 $0.00 $10,826.13 SEWARD BOROUGH $1,547.53 $0.00 $1,547.53 SEWICKLEY TOWNSHIP $255,787.64 $0.00 $255,787.64 SMITHTON BOROUGH $903.30 $0.00 $903.30 SOUTH GREENSBURG BOROUGH $4,866.97 $0.00 $4,866.97 SOUTH HUNTINGDON TOWNSHIP $209,956.54 $0.00 $209,956.54 SOUTHWEST GREENSBURG BOROUGH $4,545.37 $0.00 $4,545.37 ST CLAIR TOWNSHIP $19,406.40 $0.00 $19,406.40 SUTERSVILLE BOROUGH $1,584.16 $0.00 $1,584.16 TRAFFORD BOROUGH $3,269.32 $0.00 $3,269.32 UNITY TOWNSHIP $63,772.90 $0.00 $63,772.90 UPPER BURRELL TOWNSHIP $8,871.23 $0.00 $8,871.23 VANDERGRIFT BOROUGH $11,132.49 $0.00 $11,132.49 WASHINGTON TOWNSHIP $310,371.55 $0.00 $310,371.55 WEST LEECHBURG BOROUGH $4,279.45 $0.00 $4,279.45 WEST NEWTON BOROUGH $6,774.39 $0.00 $6,774.39 YOUNGSTOWN BOROUGH $768.74 $0.00 $768.74 YOUNGWOOD BOROUGH $7,550.60 $0.00 $7,550.60 $1,149,403.73 $26,951.19 $1,176,354.92 BRAINTRIM TOWNSHIP $27,512.96 $0.00 $27,512.96 CLINTON TOWNSHIP $38,244.98 $0.00 $38,244.98 EATON TOWNSHIP $70,456.12 $0.00 $70,456.12 EXETER TOWNSHIP $9,945.33 $0.00 $9,945.33 FACTORYVILLE BOROUGH $25,151.74 $0.00 $25,151.74 FALLS TOWNSHIP $61,339.38 $0.00 $61,339.38 FORKSTON TOWNSHIP $25,692.64 $0.00 $25,692.64 LACEYVILLE BOROUGH $8,283.45 $0.00 $8,283.45 LEMON TOWNSHIP $329,781.48 $0.00 $329,781.48 MEHOOPANY TOWNSHIP $120,050.47 $0.00 $120,050.47 MESHOPPEN BOROUGH $11,155.19 $0.00 $11,155.19 MESHOPPEN TOWNSHIP $188,466.30 $0.00 $188,466.30 Wyoming Page 43 of 44
- 44. County and Municipality Disbursements for 2013 MONROE TOWNSHIP $48,075.32 $0.00 $48,075.32 NICHOLSON BOROUGH $15,909.46 $0.00 $15,909.46 NICHOLSON TOWNSHIP $125,688.09 $0.00 $125,688.09 NORTH BRANCH TOWNSHIP $46,974.14 $0.00 $46,974.14 NORTHMORELAND TOWNSHIP $23,991.82 $0.00 $23,991.82 NOXEN TOWNSHIP $27,844.82 $0.00 $27,844.82 OVERFIELD TOWNSHIP $42,578.91 $0.00 $42,578.91 TUNKHANNOCK BOROUGH $37,090.44 $0.00 $37,090.44 TUNKHANNOCK TOWNSHIP $134,411.30 $0.00 $134,411.30 WASHINGTON TOWNSHIP $442,078.20 $0.00 $442,078.20 WINDHAM TOWNSHIP $182,661.31 $0.00 $182,661.31 York $0.00 $419,572.32 $419,572.32 $113,444,038.21 $12,315,120.01 $125,759,158.22 $5,000,000.00 $0.00 $5,000,000.00 $4,646,994.19 $0.00 $4,646,994.19 $60,137.08 $60,137.08 Rounding $30.52 ($0.01) $30.51 $123,151,200.00 $12,315,120.00 $135,466,320.00 Funds in excess of the Municipality Restriction reallocated to HAREF) (*)Funds held in escrow due to Centre County Boundary Lawsuit Grand Total Total before adjustments Housing Affordability & Rehabilitation Enhancement Fund (HAREF) Allocation Page 44 of 44