Download to read offline

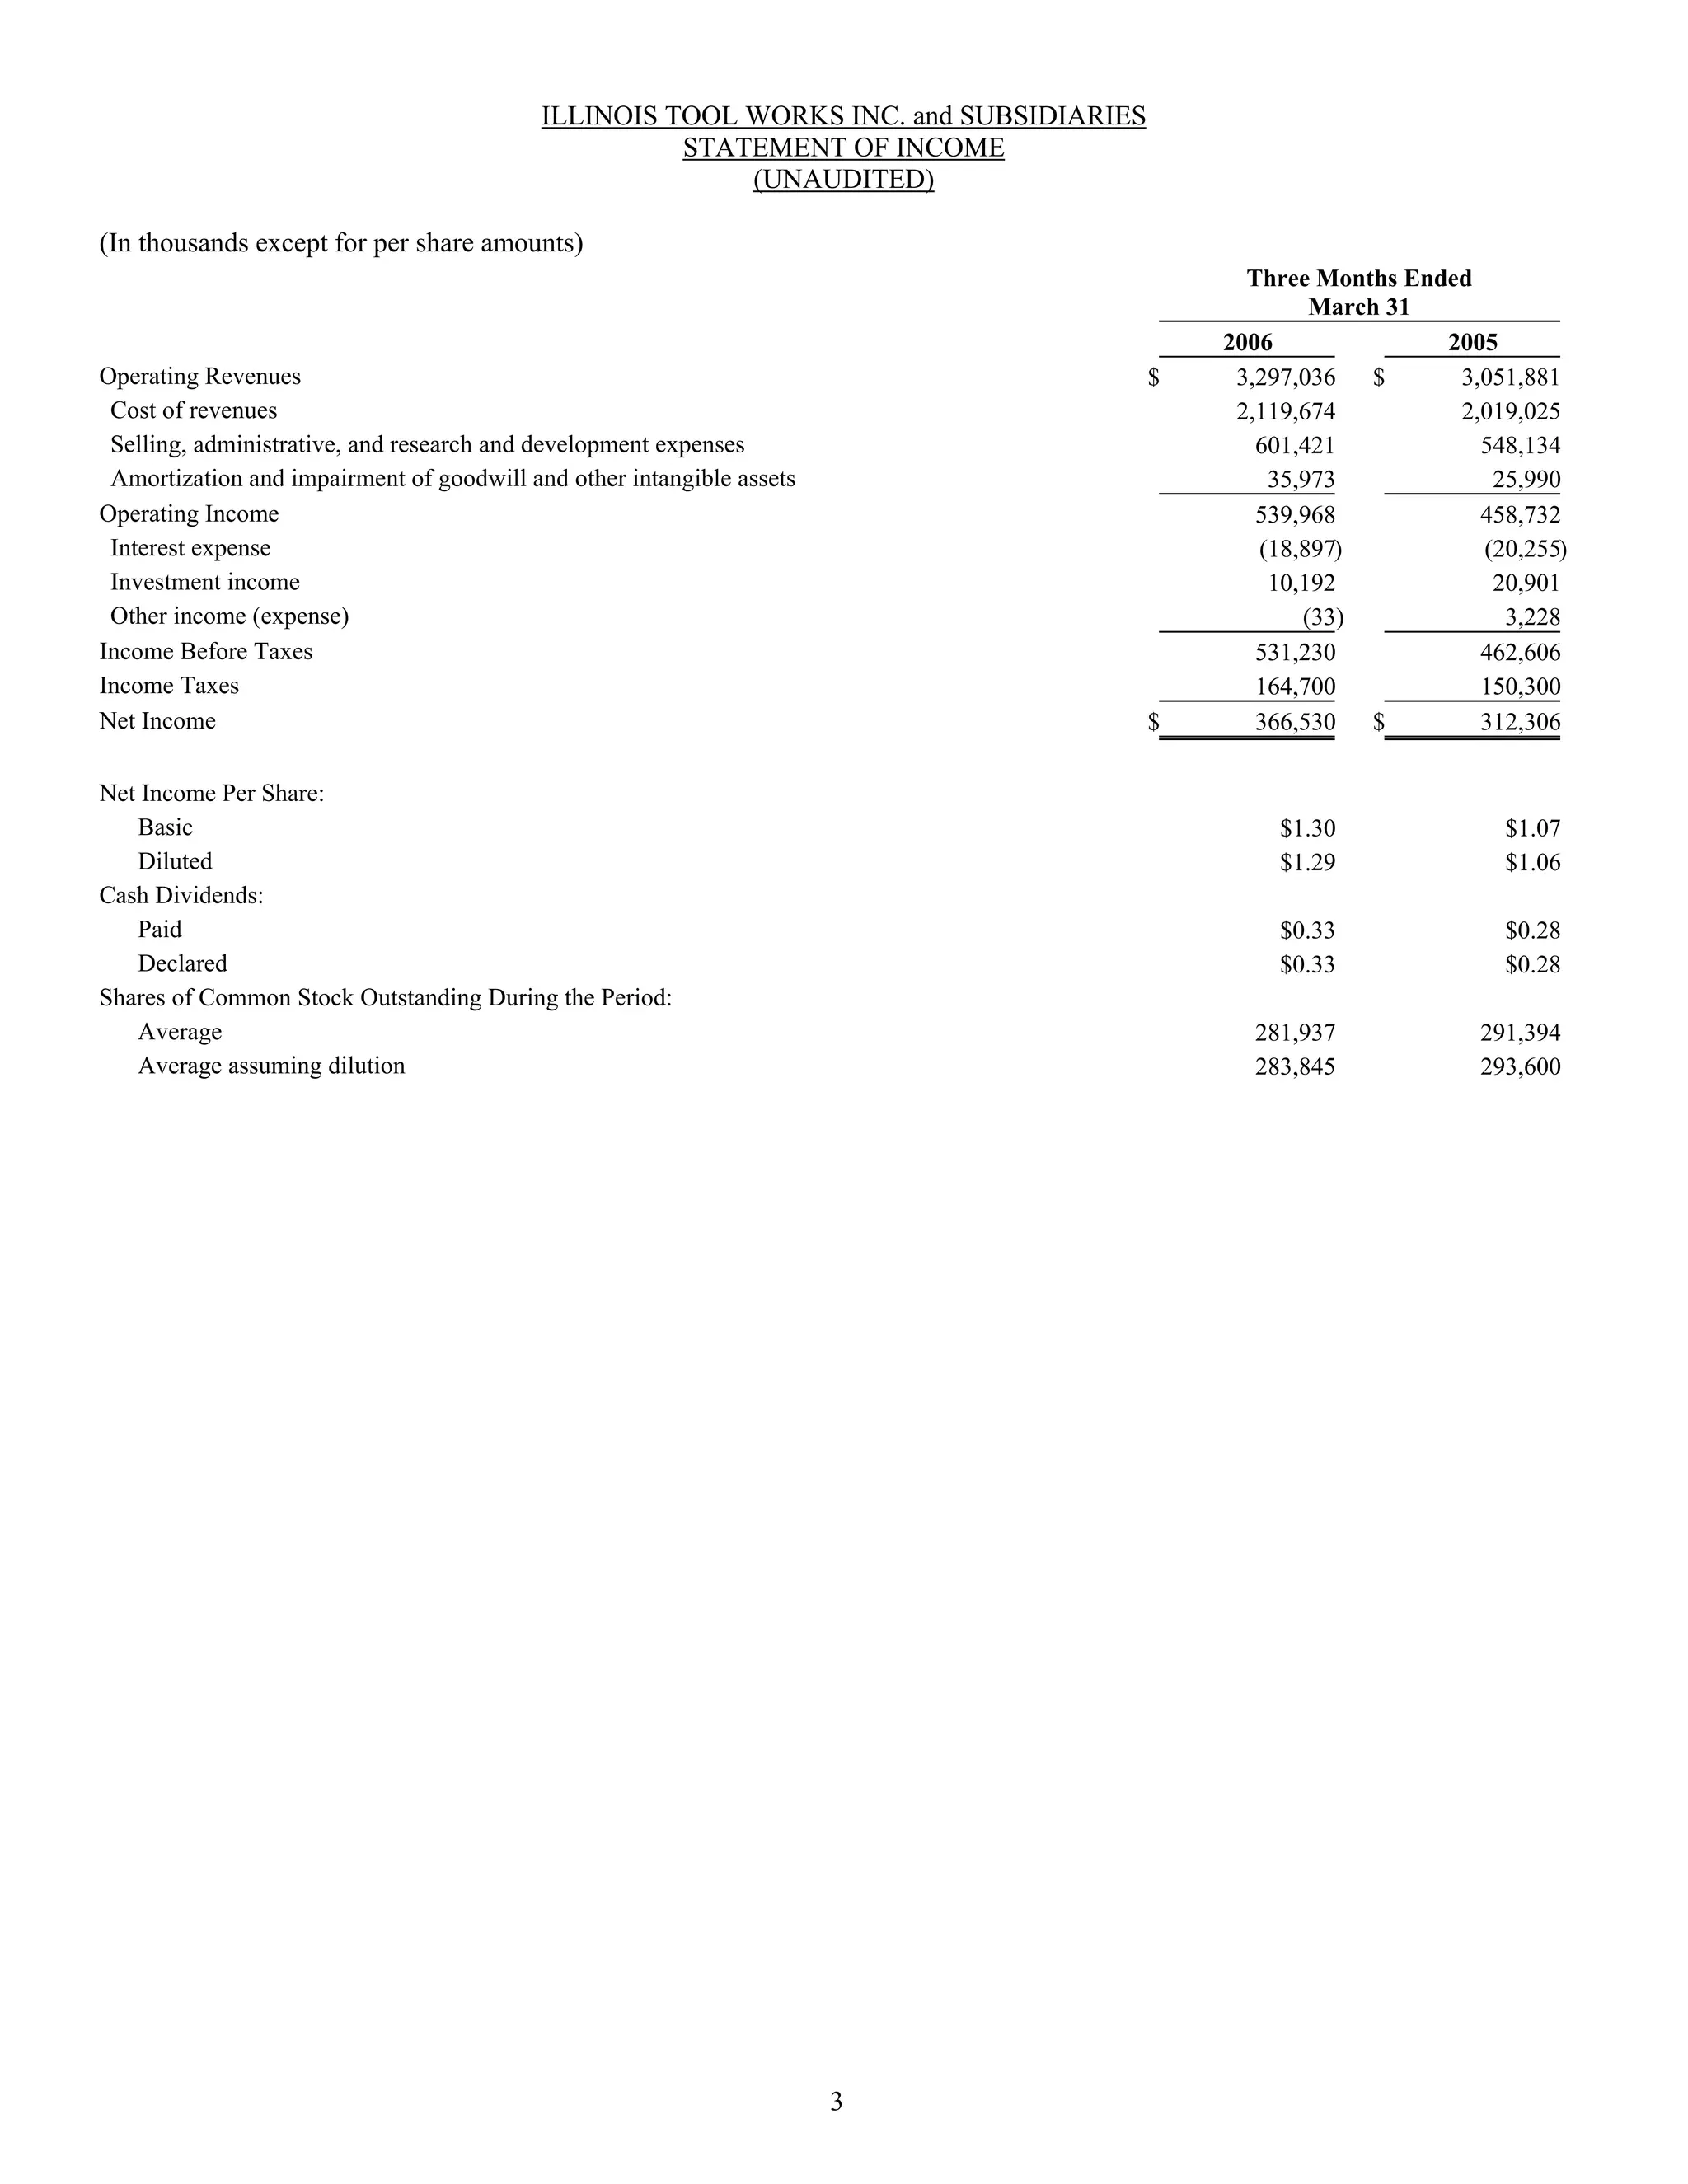


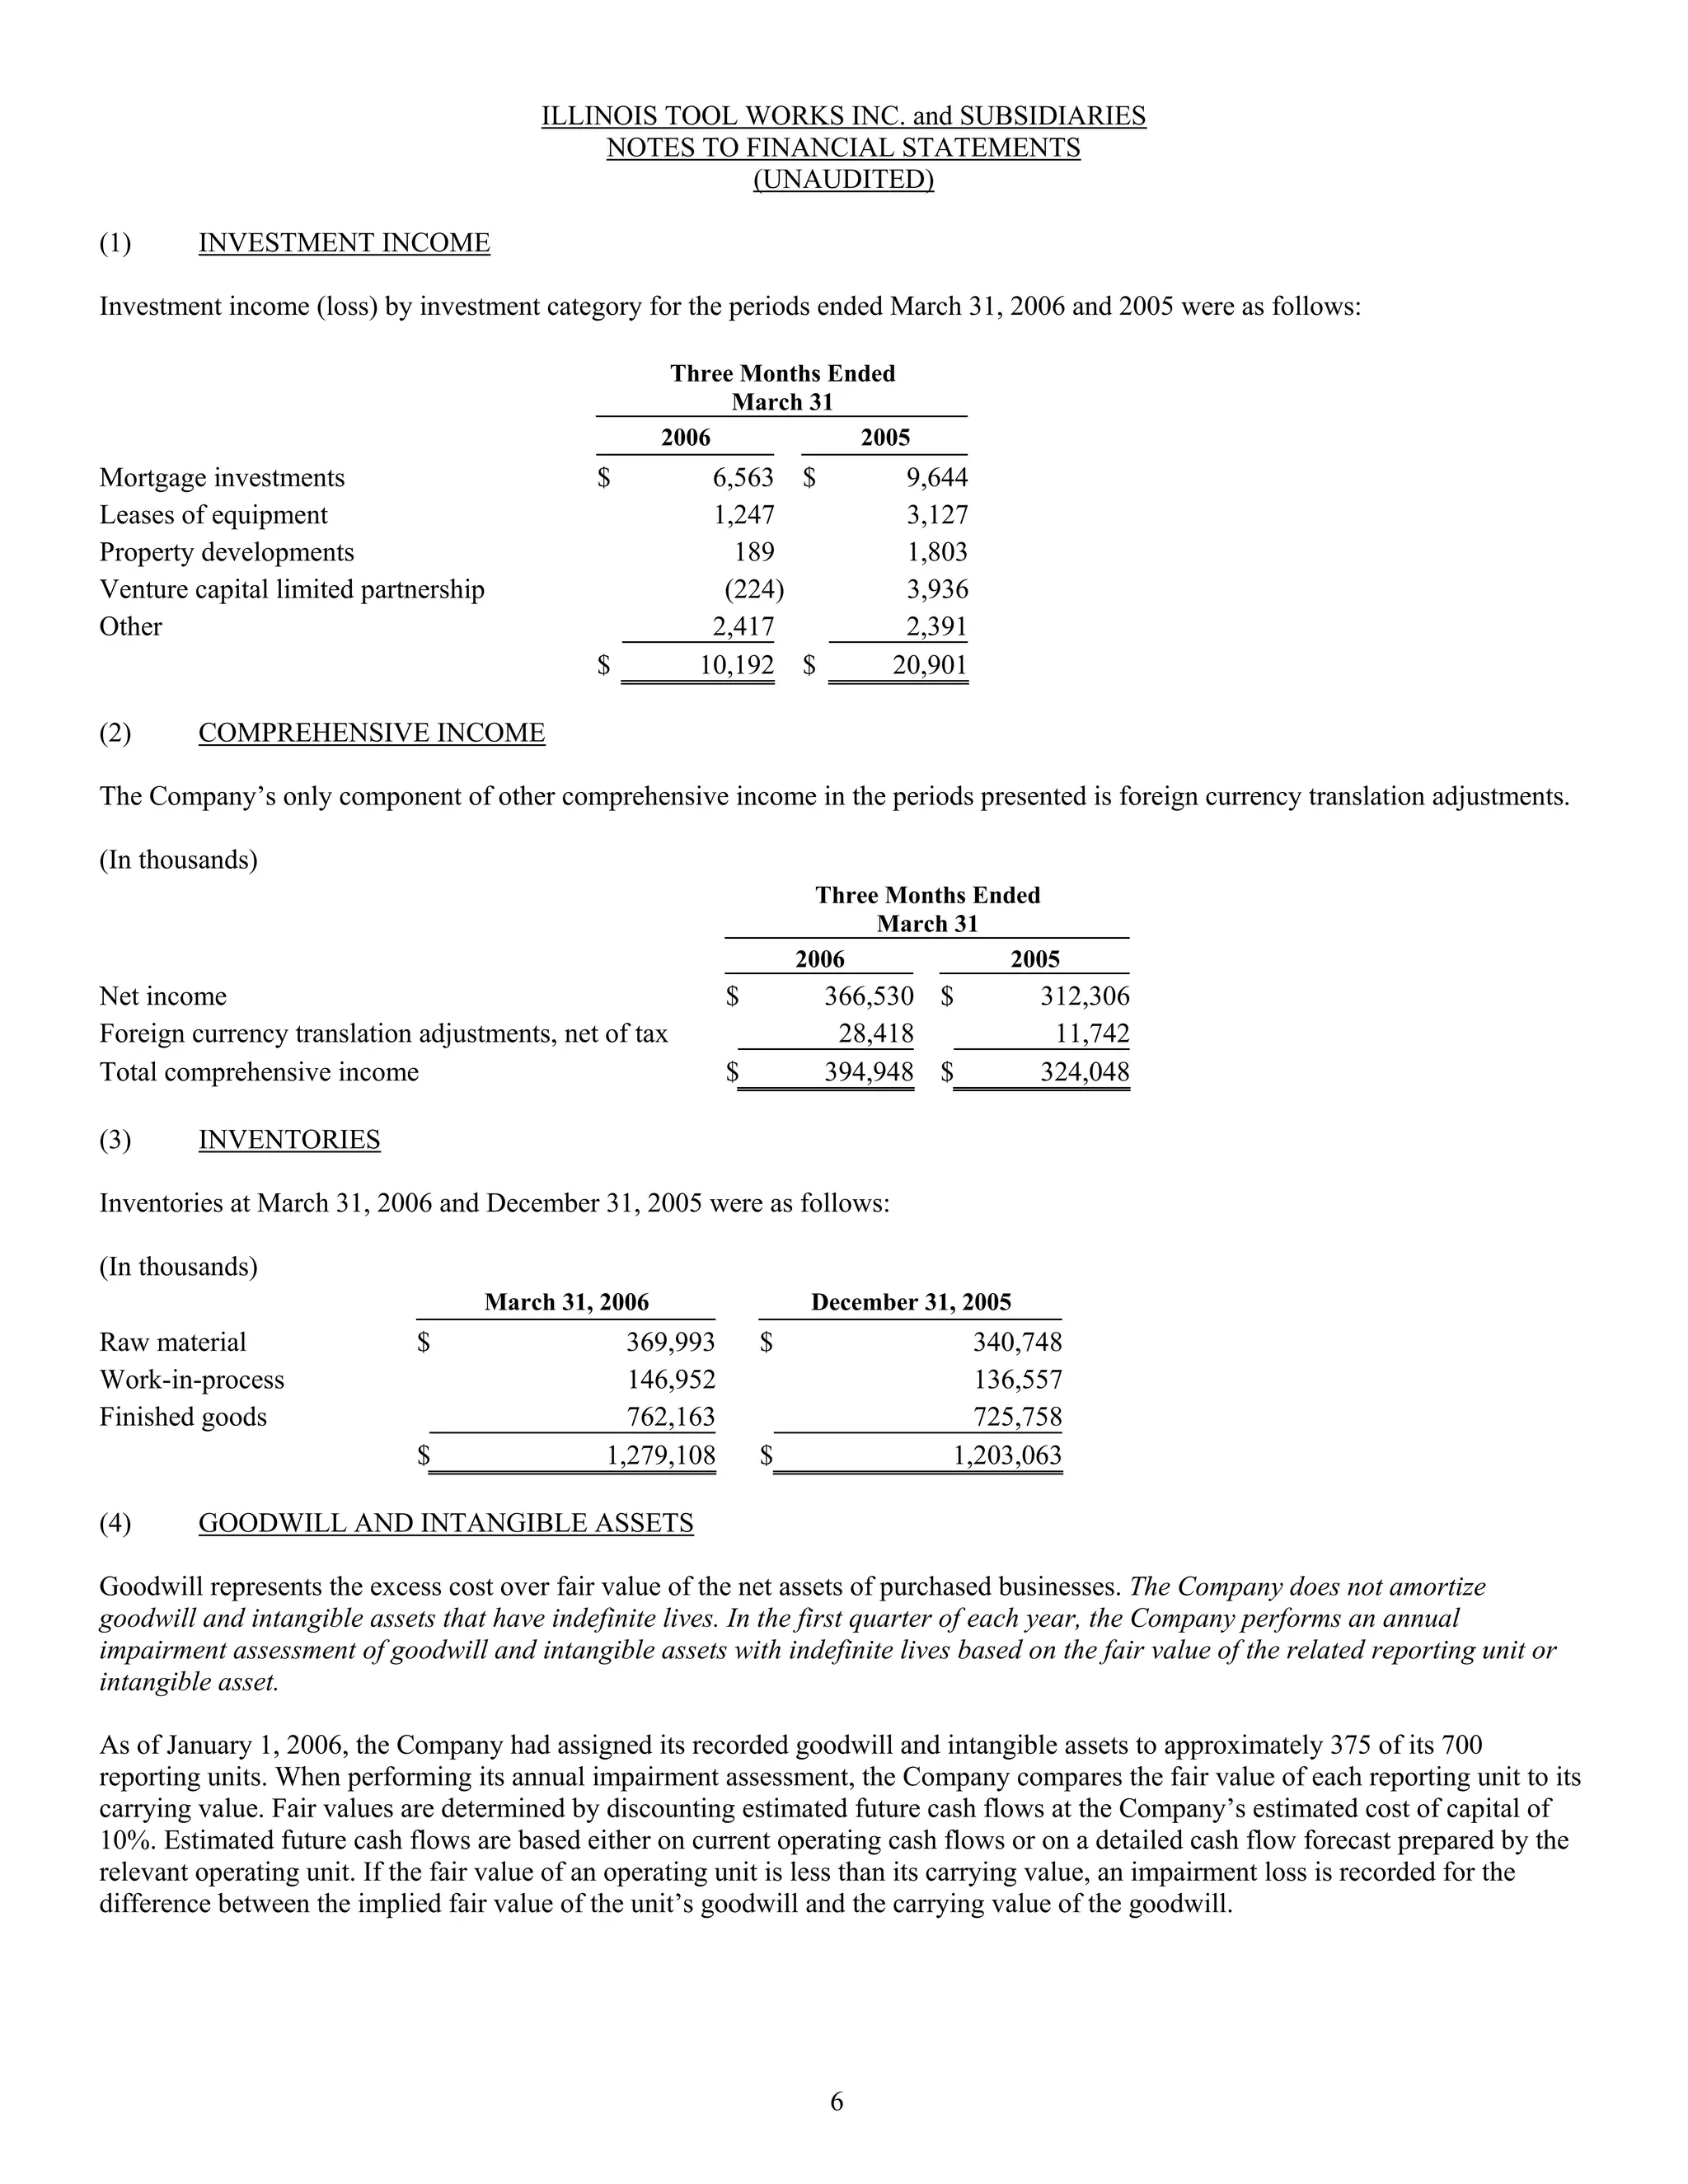


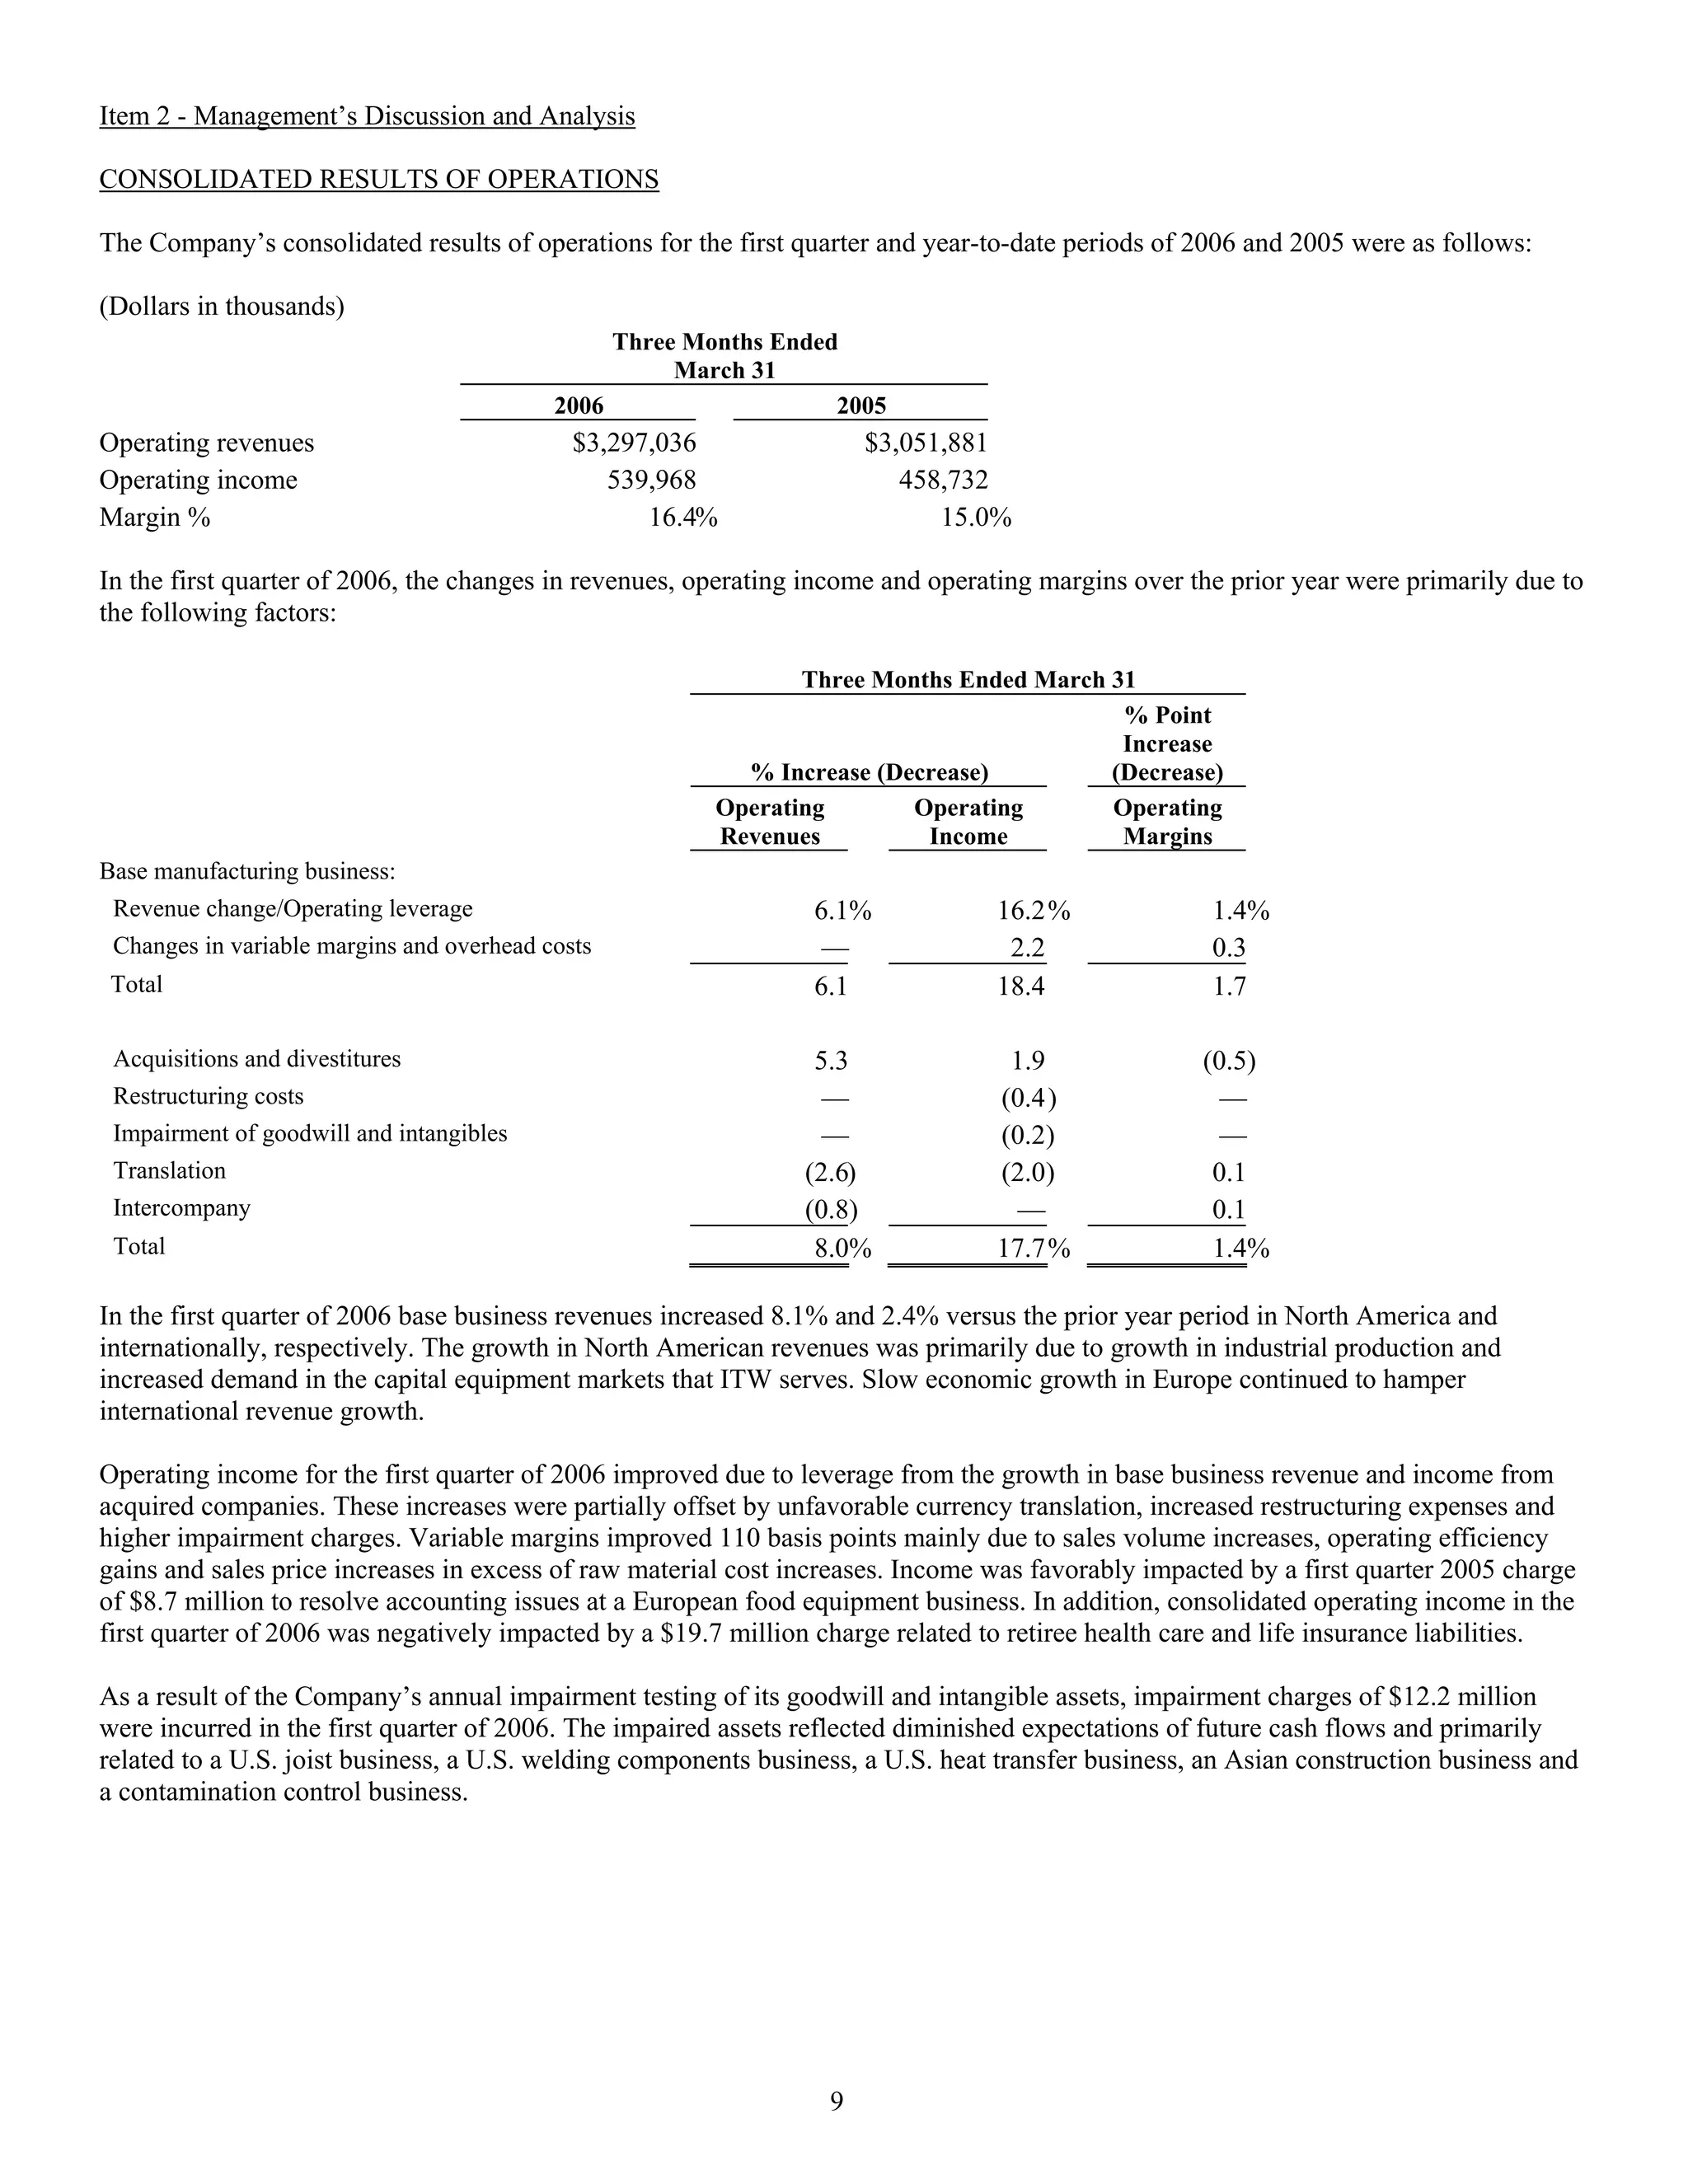


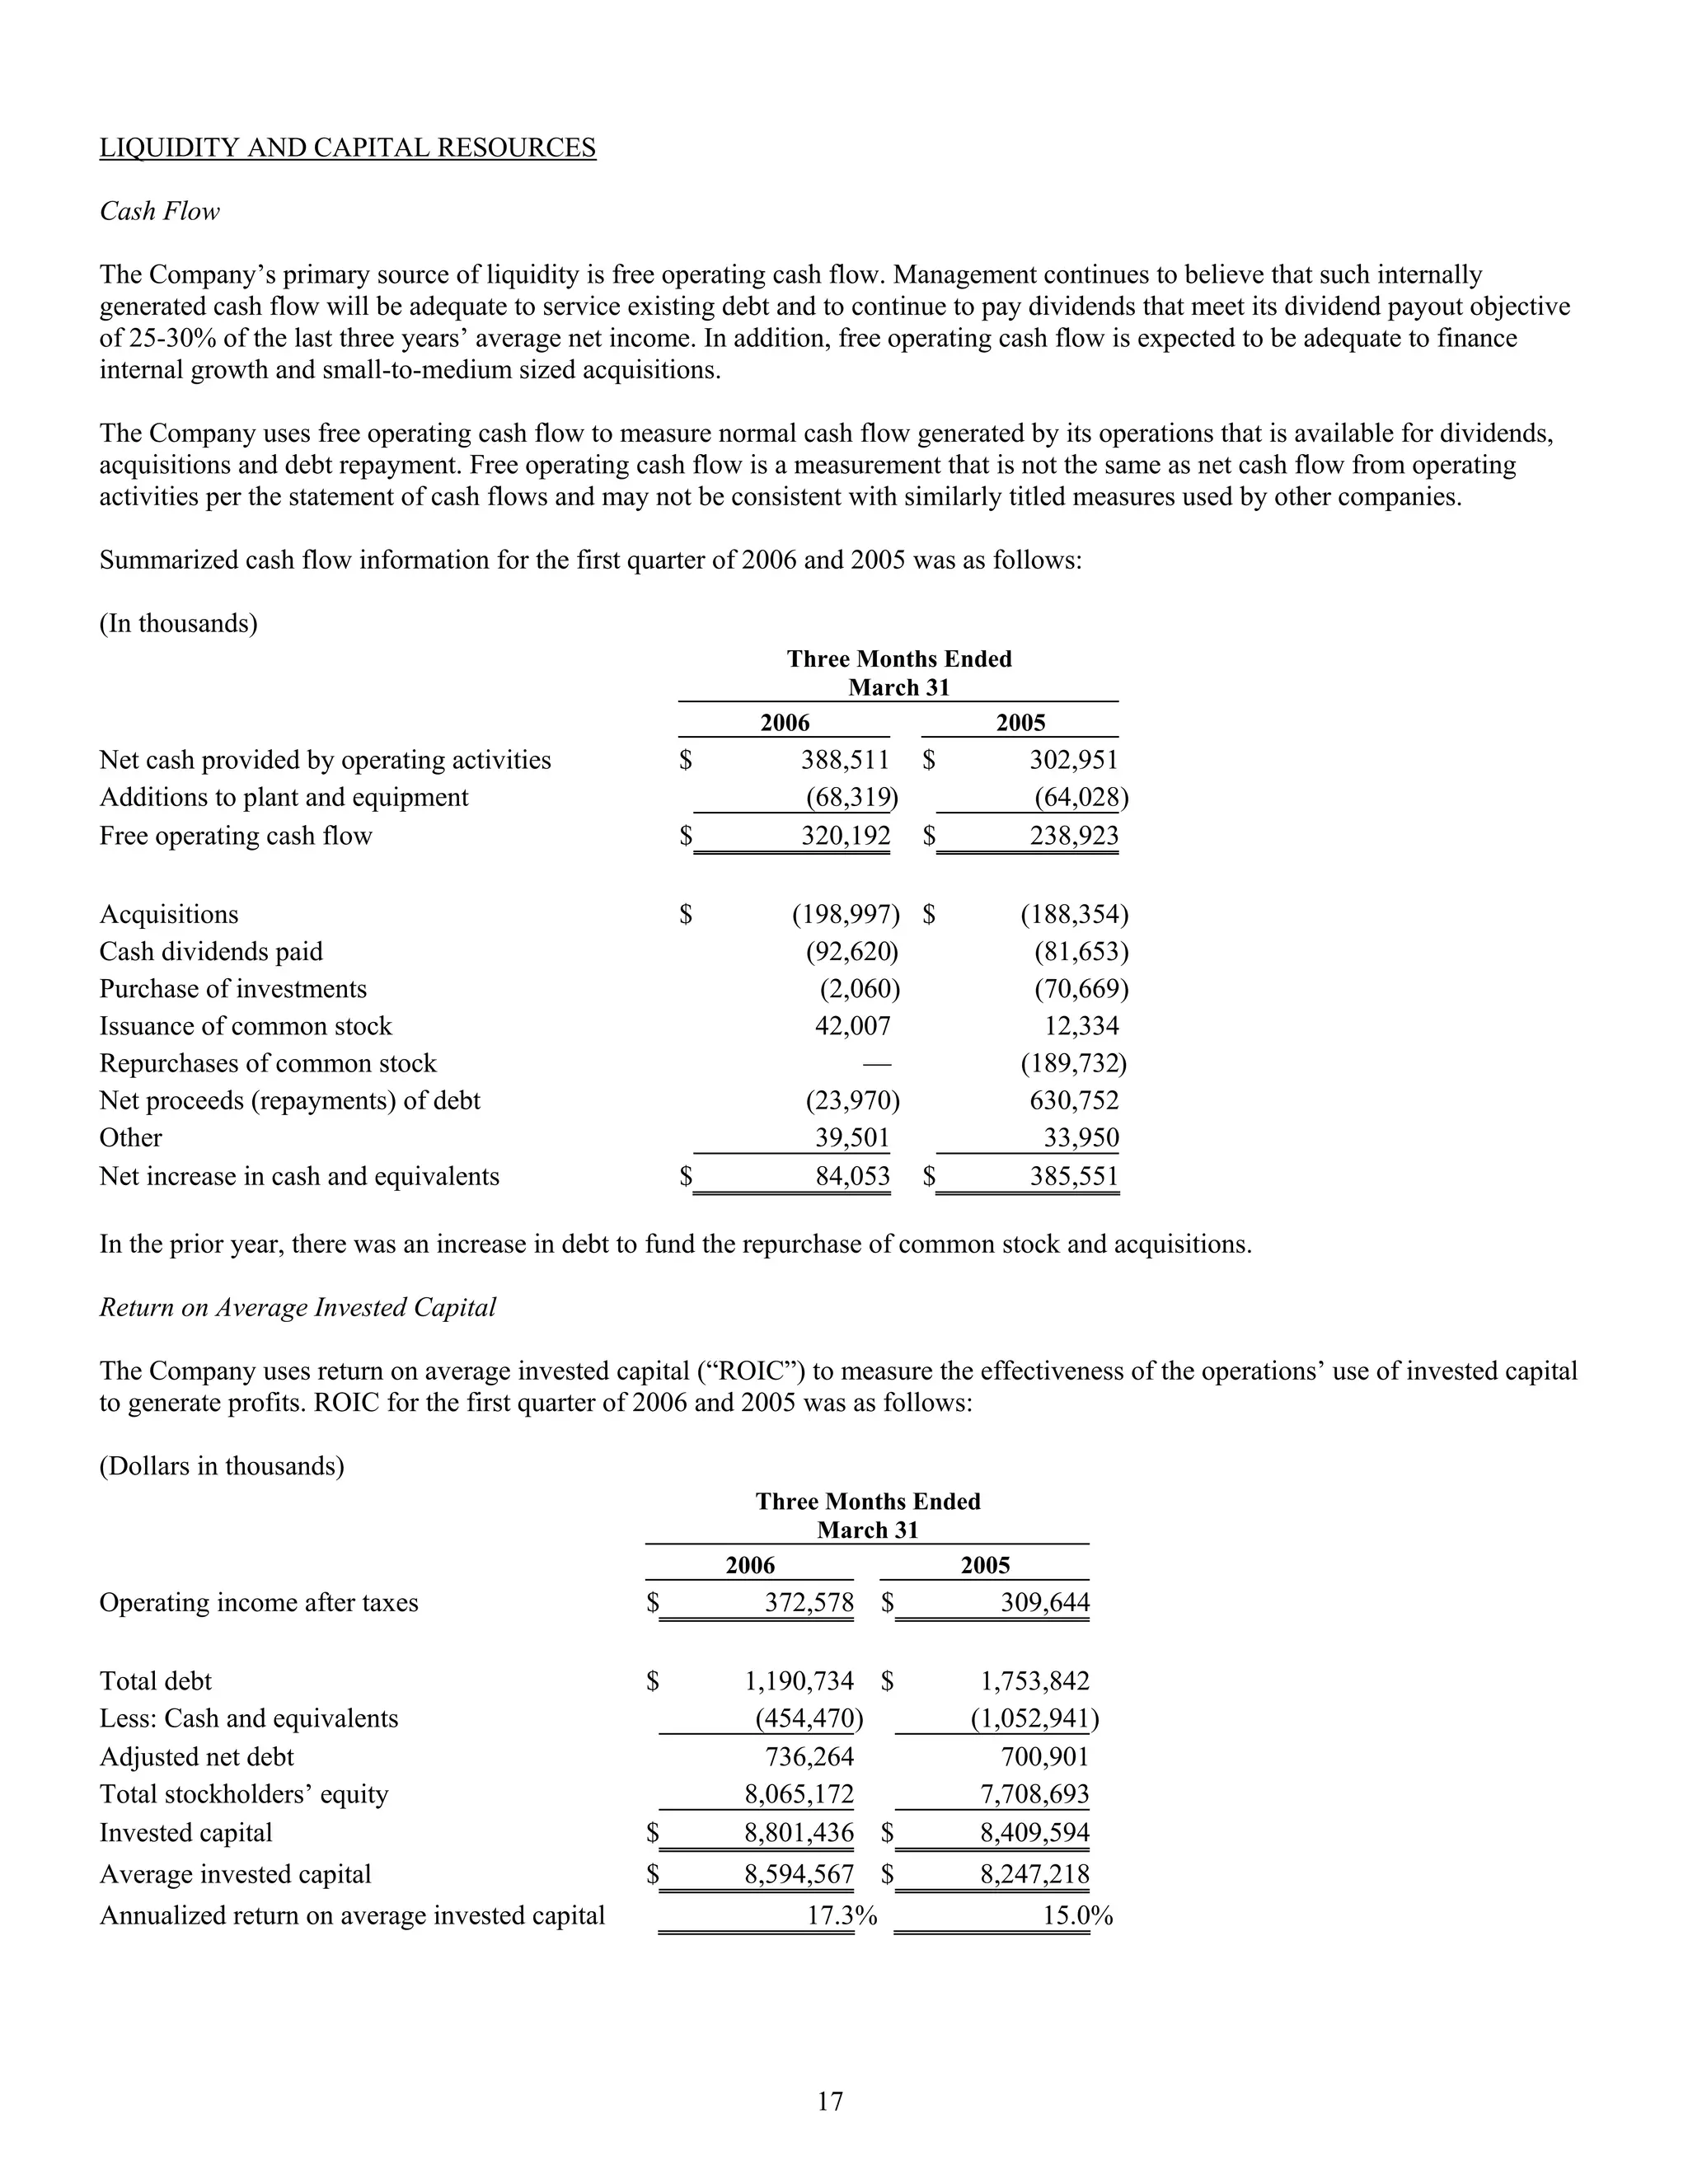
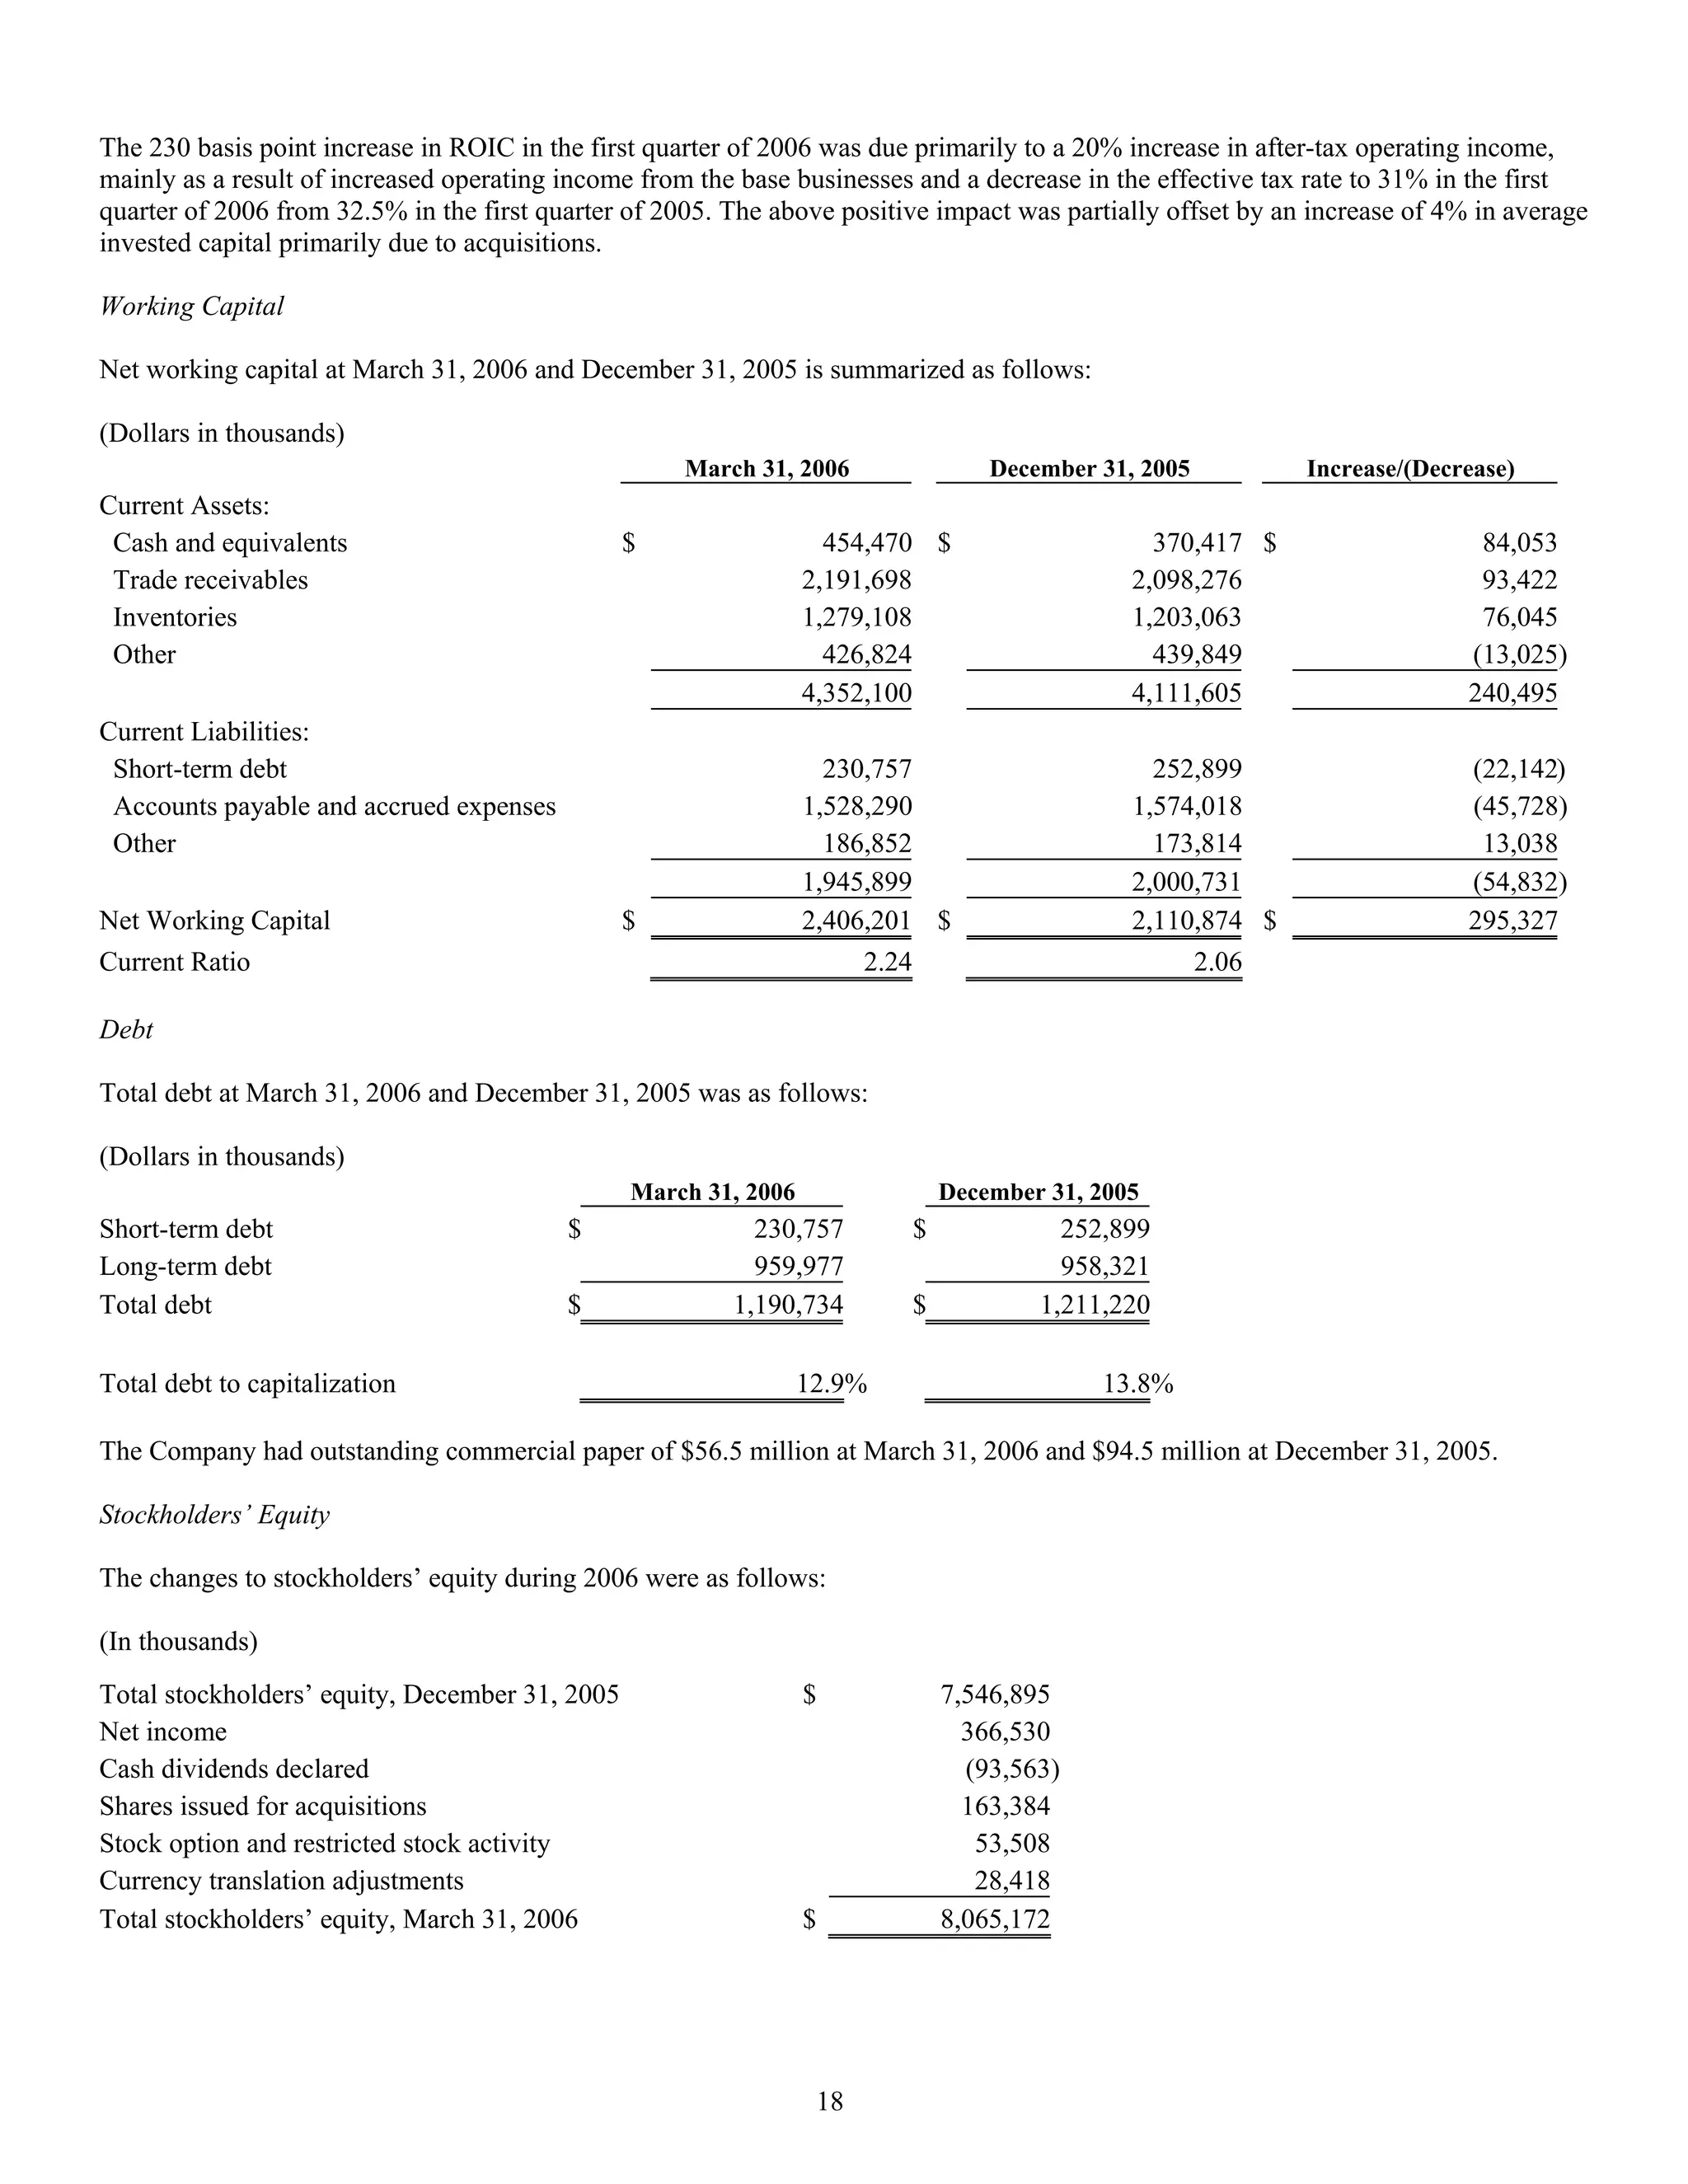

This document is a Form 10-Q quarterly report filed by Illinois Tool Works Inc. with the SEC for the quarter ended March 31, 2006. It includes financial statements such as the Statement of Income, Statement of Financial Position, Statement of Cash Flows, and Notes to the Financial Statements. The financial statements show that for the quarter ended March 31, 2006, Illinois Tool Works had operating revenues of $3.3 billion, net income of $366.5 million, and cash and equivalents of $454.5 million.


