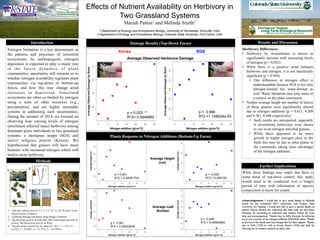
1. 0 5 10 15 20 25 30
8.48.58.68.78.88.9
Nitrogen addition (g/cm^2)
AverageLeafCount
0 5 10 15 20 25 30
2224262830323436
Nitrogen addition (g/cm^2)
AverageLeafCount
0 5 10 15 20 25 30
5254565860
Nitrogen addition (g/cm^2)
AverageHeight(cm)
0 5 10 15 20 25 30
14161820
Nitrogen addition (g/cm^2)
AverageHeight(cm)
0 5 10 15 20 25 30
1.81.92.02.1
Nitrogen addition (g/cm^2)
AverageObservedDamagebyRank
0 5 10 15 20 25 30
1.71.81.92.02.12.2
Nitrogen addition (g/cm^2)
AverageObservedDamagebyRank
Nitrogen limitation is a key determinant in
the patterns and processes of terrestrial
ecosystems. As anthropogenic nitrogen
deposition is expected to play a major role
in the future dynamics of plant
communities, uncertainty still remains as to
whether nitrogen availability regulates plant
communities via top-down or bottom-up
forces, and how this may change amid
increases in deposition. Grassland
ecosystems are often co-limited by nitrogen
along a suite of other resources (e.g.,
precipitation), and are highly amenable
systems to addressing such uncertainties.
During the summer of 2014, we focused on
observing how varying levels of nitrogen
enrichment affected insect herbivory among
dominant grass individuals in two grassland
systems- a shortgrass steppe (SGS) and
native tallgrass prairie (Konza). We
hypothesized that grasses will have more
biomass with increased nitrogen which will
lead to more herbivory.
Effects of Nutrient Availability on Herbivory in
Two Grassland Systems
Mariah Patton1 and Melinda Smith2
1 Department of Ecology and Evolutionary Biology, University of Tennessee, Knoxville, USA;
2 Department of Ecology and Evolutionary Biology, Colorado State University, Fort Collins, USA
Damage Results (Top-Down Focus)
Department
of
Ecology
and
Evolu4onary
Biology
Acknowledgements I would like to give much thanks to Melinda
Smith for the wonderful REU experience and Kansas State
University for funding. I would also like to give a special thanks to
partner Shayla Burnett for collecting this data with me and Katie
Michaels for assisisting in collection and Andrew Felton for extra
help and encouragement. Thanks also to Sally Koerner for allowing
me to use a section of the nitrogen addition (ChANGE) plots. Thanks
to the rest of the Smith and Alan Knapp labs for their support. Thanks
also to SGS LTER as well as Konza Prairie LTER and staff for
allowing me to conduct research on these sites.
Methods
Results and Discussion
Herbivory Differences
• Herbivory by invertebrates is shown to
significantly increase with increasing levels
of nitrogen (p = 0.025).
• While there is a positive trend between
herbivory and nitrogen, it is not statistically
significant (p = 0.994).
• This difference in nitrogen effect is
understandable because SGS is not only
nitrogen-limited but water-limited as
well. Water limitation may play more of
a control on the plant community
• Neither average height nor number of leaves
of these grasses were significantly altered
due to nitrogen additions (p = 0.631, 0.209
and 0.561, 0.448 respectively).
• Such results are unexpected, especially
if invertebrate herbivores were shown
to cue in on nitrogen enriched grasses.
• While there appeared to be more
growth in higher nitrogen plots in the
field, this may be due to other plants in
the community taking more advantage
of the nitrogen additions.
Introduction
1. Add time-release urea (0, 2.5, 5, 7.5, 10, 15, 20, 30 g/cm^2) per
block (8 plots, 6 blocks)
2. Callibrate damage perception using Image-J software
3. Tag dominant grasses at both sites (480 Andropogon gerardii at
Konza, 960 Bouteloua gracilis at SGS)
4. Visually assess insectivory by ranks (0 = 0%, 1 = 1-5%, 2 =
6-25%, 3 = 26-50%, 4 = 51-75%, 5 = 76-100%)
While these findings may imply that there is
some trend of top-down control, this study
would need to be conducted over a longer
period of time with information of species
composition to know for certain.
Further Implications
Average Height
(cm)
Average Observed Herbivore Damage
Konza SGS
Plants Response to Nitrogen Additions (Bottom-Up Focus)
Average Leaf
Number
p = 0.025 **
R^2= 0.5948962
p = 0.994
R^2 =1.146634e-05
p = 0.631
R^2 = 0.04091704
p = 0.209
R^2 = 0.248126
p = 0.561
R^2 = 0.05932634
p = 0.448
R^2 = 0.09905864
1
2
3
4