Assigning And Combining Probabilities In Single-Case Studies
Paper_Plastic_Eating
1. SMS FOR FOOD INTAKE 1
Running head: SMS FOR FOOD INTAKE
Comparison of text messaging and paper-and-pencil for ecological momentary assessment of
food craving and intake
Elliot T. Berkman1,2
Nicole R. Giuliani1
Alicia K. Pruitt1
University of Oregon
1
Department of Psychology
2
Prevention Sciences Institute
Tables: 2
Figures: 3
Word Count: 5199
Abstract word count: 260
Corresponding Author:
Elliot Berkman
Department of Psychology
1227 University of Oregon
Eugene, OR USA 97403-1227
berkman@uoregon.edu
IN PRESS AT APPETITE
2. SMS FOR FOOD INTAKE 2
Abstract
Electronic devices such as mobile phones are quickly becoming a popular way to gather
participant reports of everyday thoughts, feelings, and behaviors, including food cravings and
intake. Electronic devices offer a number of advantages over alternative methods such as paper-
and-pencil (PNP) assessment including automated prompts, on-the-fly data transmission, and
participant familiarity with and ownership of the devices. However, only a handful of studies
have systematically compared compliance between electronic and PNP methods of ecological
momentary assessment (EMA), and none have examined eating specifically. Existing
comparisons generally find greater compliance for electronic devices than PNP, but there is
variability in the results across studies that may be accounted for by differences across research
domains. Here, we compared the two EMA methods in an unexamined domain—eating—in
terms of response rate and response latency, and their sensitivity to individual difference
variables such as body mass index (BMI). Forty-four participants were randomly assigned to
report on their food craving, food intake, and hunger four times each day for two weeks using
either a PNP diary (N=19) or text messaging (TXT; N=25). Response rates were higher for TXT
than PNP (96% vs. 70%) and latencies were faster (29 min vs. 79 min), and response rate and
latency were less influenced by BMI in the TXT condition than in the PNP condition. These
results support the feasibility of using text messaging for EMA in the eating domain, and more
broadly highlight the ways that research domain-specific considerations (e.g., the importance of
response latency in measuring short-lived food craving) interact with assessment modality during
EMA.
KEYWORDS: ecological momentary assessment, text messaging, paper-and-pencil diary,
experience sampling, eating
3. SMS FOR FOOD INTAKE 3
Ecological momentary assessment (EMA) is a relatively new but growing approach for
measuring everyday experiences (e.g., behaviors, thoughts, mood/emotion) in vivo and with high
temporal specificity (Shiffman, Stone, & Hufford, 2008; Trull & Ebner-Priemer, 2013). EMA
entails repeated measurements within and across days (e.g., 4 times each day for 14 days) that,
depending on the research goals, can occur randomly, on a fixed schedule, or be triggered by
specific events. In any case, one of the main advantages of EMA is its ability to minimize
retrospective bias by eliciting reports from participants more closely in time to the event of
interest than would otherwise be possible with post hoc measurements based on recollection. A
second advantage is that reports are obtained in vivo and are thus more ecologically valid than
those gathered in a laboratory. For these reasons, EMA has been used to provide unique
information about psychological, behavioral, and clinical outcomes ranging from mood (Ebner-
Priemer & Trull, 2009) and relationship quality (Laurenceau & Bolger, 2009) to cigarette
smoking (Shiffman, 1993) and food intake (Thomas, Doshi, Crosby, & Lowe, 2009).
The present study focuses on compliance rates of EMA in the domain of food intake and
craving. Researchers in the food domain have embraced EMA because of its ability to measure
food intake and food-related affect (e.g., craving) as it occurs naturally during everyday life.
Food craving is also short lived (Werthmann, Roefs, Nederkoorn, Mogg, Bradley, & Jansen,
2011), making response latency an important consideration in this area. Preliminary evidence
suggests that EMA via electronic devices, and particularly text messaging, is feasible for
assessing appetite and food intake (Schembre & Yuen, 2011), and even among children (Shapiro,
Bauer, Hamer, Kordy, Ward, & Bulik, 2008). Building on this, a number of pilot studies have
begun to test the efficacy of weight loss and other dietary interventions based on text messaging,
generally with encouraging results (Cole-Lewis & Kershaw, 2010; Gerber, Stolley, Thompson,
4. SMS FOR FOOD INTAKE 4
Sharp, & Fitzgibbon, 2009; Napolitano, Hayes, Bennett, Ives, & Foster, 2012; Patrick, Raab,
Adams, Dillon, Zabinski, Rock, et al., 2009). Electronic EMA-based interventions (or
“ecological momentary interventions”; Heron & Smyth, 2011) are particularly relevant in the
realm of dietary intervention because of the effect of mere self-monitoring on intake (Burke,
Conroy, Sereika, Elci, Styn, Acharya, et al., 2009). Nonetheless, the majority of studies to date
using EMA to monitor or intervene upon intake use the paper-and-pencil (PNP) method (see
Burke, Wang, & Sevick, 2011 for review), and to our knowledge electronic and PNP EMA have
not been directly compared in this area. Thus, the overarching purpose of the present research is
to directly compare response rates and latencies between these two types of EMA in the eating
domain. We believe that quantifying the differences in response rate and latency between PNP
and electronic methods is an important first step in the comparison between the two.
Early EMA studies used paper-and-pencil (PNP) diaries as the medium, sometimes aided
by electronic reminders (e.g., Larson & Csikszentmihalyi, 1983). As portable device technology
developed, researchers deployed electronic devices that minimized subject burden and increased
data fidelity including Palm Pilots (Feldman Barrett & Barrett, 2001) and, more recently, short-
message service text messaging (TXT; Berkman, Dickenson, Falk, & Lieberman, 2011). The key
advantages of electronic devices over PNP for EMA are: (a) time stamping to thwart possible
forward- or backfilling of entries, (b) built-in prompting or signaling (e.g., auditory or tactile) at
pre-set times, (c) input gating to ensure that responses conform to criteria (e.g., a 1-to-5 Likert
scale), (d) the potential for instantaneous wireless data transfer to reduce data loss in the event
that the diary device is lost, stolen, or broken, and (e) generally greater convenience and
accessibility for participants. In the case of text messaging, most participants are already familiar
with the interface and own the device, which increases compliance because they are more likely
5. SMS FOR FOOD INTAKE 5
to have it with them at all times and less likely to lose or forget the device. These considerable
advantages have led researchers increasingly to use electronic devices not only for EMA-based
observational studies but also for EMA-based interventions (Heron & Smyth, 2010).
Despite the enthusiasm for electronic EMA, only a few studies have directly compared it
to older, more extensively validated PNP methods. An initial study comparing the two methods
(Stone, Shiffman, Schwartz, Broderick, & Hufford, 2002) found that participants in the PNP
group reported completing 90% of the assessments within 15 minutes of the targeted time, but a
covert light-sensitive computer chip revealed that only 11% of the responses were actually in
compliance. By comparison, the actual completion rate for electronic EMA in that study was
94%. Subsequent studies that took steps to equate the two methods in other ways (e.g., by
providing audible alerts and giving feedback on compliance) found more comparable response
rates between PNP and electronic methods as well as comparable patterns in the data in terms of
central tendency and covariance (Green, Rafaeli, Bolger, Shrout, & Reis, 2006). One study in the
paper by Green and colleagues (2006) elicited a 94% completion rate from participants in the
PNP condition (compared to 92% in the electronic version), and the authors concluded that
compliance likely varies as a function of study design and participant motivation more than it
does by data collection format. Nonetheless, the reliability of self-reports of PNP completion has
remained a controversial topic (Broderick & Stone, 2006), and scientists have emphasized the
need for more research on this issue with particular attention to variability in completion rates
across research domains (Tennen, Affleck, Coyne, Larsen, & DeLongis, 2006).
The goal of the present study is to directly compare PNP and TXT formats for EMA of
food intake and craving. Specifically, we compared response rates (i.e., compliance), response
latency, and user experience across 14 consecutive days of EMA with four assessments per day
6. SMS FOR FOOD INTAKE 6
between two groups of individuals who had been randomly assigned to either a PNP or
electronic format. The TXT EMA was delivered using text messaging, and the PNP EMA was
delivered using a pocket-sized diary. To facilitate a “fair” comparison (Tennen et al., 2006), we
used electronic time-stamp verification for the PNP method and took steps to equate the
experimental procedures for the two conditions aside from differences inherent in the assessment
format. As an exploratory aim, we also gathered several individual difference measures to test if
compliance was systematically related to trait-level variables and, if so, whether that differed
between the EMA formats (e.g., Courvoisier, Eid, & Lischetzke, 2012). We reasoned that several
broad personality traits (impulsivity, self-control, and the big five traits agreeableness,
conscientiousness, extraversion, neuroticism, and openness) and a food intake-specific measure
(body mass index; BMI) might relate to compliance in either or both groups.
Method
Participants
A total of 44 participants (30 female, age M = 21.25, SD = 2.32, range = 18-30)
completed the study after being recruited through flyers placed around the University of Oregon
campus. Participants were randomly assigned to either the PNP (N = 19) or the TXT (N = 25)
EMA formats (see Table 1 for demographics by group). Participants were paid $10 for the
baseline session, $5 for the endpoint session, $5 per week of EMA, and an additional $5 per
week that they responded to 90% or more of the prompts. Thus, participants would receive at
least $25 if they participated in the entire experiment, and as much as $35 if they completed
more than 90% of the prompts in both weeks. All gave informed consent in accordance with the
University of Oregon Institutional Review Board.
Procedure overview
7. SMS FOR FOOD INTAKE 7
The study consisted of two weeks of daily EMA of food intake and craving bookended
by one baseline and one endpoint laboratory session. All participants were emailed nightly
during the EMA phase with a reminder (that was identical between conditions) to complete all
assessments the following day in a timely manner.
Baseline session. At the baseline session, participants completed questionnaires assessing
individual differences in self-control, impulsivity, and personality: the 13-item Brief Self-Control
Scale (BSCS; Tangney, Baumeister, & Boone, 2004; M = 4.05, SD = .91, α = .83; 1 =
“completely disagree,” 4 = “neutral,” 7 = “completely agree”), the Barratt Impulsivity Scale
(BIS-10; Patton, Stanford, & Barratt, 1995; M = 2.48, SD = .23, α = .62; 1 = “rarely/never,” 2 =
“occasionally,” 3 = “often,” 4 = almost always/always”), and the Big Five Inventory (BFI; John,
Donahue, & Kentle, 1991; agreeableness: M = 3.73, SD = .49, α = .65; conscientiousness: M =
3.57, SD = .67, α = .82; extraversion: M = 3.32, SD = .91, α = .9; neuroticism: M = 3.04, SD =
.71, α = .8; openness: M = 3.88, SD = .54, α = .74; 1 = “strongly disagree,” 3 = “neither agree
nor disagree,” 5 = “strongly agree”). At this session, participants also reported their current
height and weight, from which we calculated BMI (weight in kg/height in m2
; M = 22.1, SD =
3.33, range = 17.5-33.9). None of these measures differed significantly by EMA group (p-values
> .1). The incentive structure was also explained at this session, noting the bonus payment ($5
per week) for a 90% or greater completion rate.
EMA. Upon completion of the questionnaires at the baseline session, participants were
randomized into a group and then trained by the experimenter on the EMA procedure they were
to adhere to for the following 14-day period. All participants identified their typical meal times
(breakfast, lunch, and dinner) and bedtime so that the four prompts per day could be scheduled to
occur approximately at the end of each meal and just before bed. We note that we used a
8. SMS FOR FOOD INTAKE 8
mealtime-based EMA schedule, as opposed to a more common random schedule, because we
were specifically interested in food-related responses near mealtimes. In addition, all participants
identified a “target” energy-dense food to monitor for the 14-day period. Target foods were
selected to be high-calorie, readily available, and often consumed when the participant was not
hungry (e.g., a snack or dessert food). At each of the four time points, participants in both groups
rated: (a) their current craving for the target food on a five-point Likert scale (0 = Not at all, 4 =
Very strong), (b) the number of servings of their target food they had consumed since the last
prompt (using a numerical count of servings), and (c) their current level of general hunger on a
give-point Likert scale (0 = Not at all, 4 = Very hungry). Participants in both groups were
instructed to respond as closely as possible to the target time, and only to reply to the single most
recent prompt. For example, if a participant was scheduled to respond at 9am and 12pm, to make
a rating at 12:05pm he/she was instructed to reply only to the 12pm prompt regardless of whether
or not a response was made at the 9am prompt. Participants were prompted four times each day
for 14 days, totaling 56 prompts across the EMA period.
PNP EMA participants were given a bag containing a data entry packet and a tamper-
proof digital time stamper. The data entry packet contained one page for each day (14 pages
total), each prefilled with the dates and times of each prompt (Figure 1a), spaces for the three
ratings (with brief explanations of the rating scales), and a space to time-stamp when the entry
occurred. Participants in the PNP EMA condition were instructed to complete each assessment as
closely as possible to the target time indicated in the packet and to imprint a time stamp when
they completed the assessment. We decided not to use an additional prompting method (e.g., pre-
programmed wristwatches) for participants in the PNP condition for two reasons. First, we
wanted to estimate compliance for PNP EMA as it is most commonly deployed in the research
9. SMS FOR FOOD INTAKE 9
literature (i.e., without prompts). Second, the one published study on this topic of which we are
aware found that pairing PNP EMA with electronic reminder signals does not necessarily
increase compliance rates (Broderick, Schwartz, Shiffman, Hufford, & Stone, 2003). Thus,
beyond the nightly emails and the written schedule in the data entry packet, PNP participants
were not reminded about when to complete their assessments. Figure 1b shows a representative
page reflecting one day’s worth of responses for one participant; the target response times were
entered into the packet by the experimenter during the baseline session, and the responses and
time stamps were completed by the participant during EMA. Response latency was computed by
comparing the target time to the time indicated by the stamp.
TXT EMA participants were given a card containing explanations of the rating scales
(identical to those in the PNP data entry packet), as well as a description of the response format
to be used for the TXT EMA ratings (Figure 2). TXT EMA prompts were delivered four times
per day via text messaging at each of the target times using an automated text messaging service
(mProve, http://www.mprove.com). TXT EMA participants were instructed to respond to the
text messages when they received the prompt, but no later than the subsequent prompt. The
prompt read, “Please rate your craving (c: 0-to-4), eating (e: servings), and hunger (h: 0-to-4) in
a single text (e.g., c1e0h3),” and participants replied with their response in a single text message
using the alphanumeric code provided on the card. The code paired a letter for each question
(“C” for craving, “E” for eating, and “H” for hunger) with a number for the response using the
scale indicated on the card (i.e., five-point Likert for craving and hunger, and number of servings
for eating). For example, a response for very strong craving, no eating, and very high hunger
would be “C4 E0 H4.” This alphanumeric code method has been used successfully in the past to
measure craving for and smoking of tobacco cigarettes (Berkman et al., 2011). Participants in the
10. SMS FOR FOOD INTAKE 10
TXT EMA condition we offered a “loaner” phone with sufficient prepaid time to cover all text
prompts and responses, but all participants elected to carry their own phones. 64% of the TXT
participants possessed smartphones, though there were no significant differences in response
rates (F(1,23) = 0.97, ns) and latencies (F(1,24) = 2.06, ns) between smartphones and standard
phones. We reminded participants to carry their phones at all times.
Endpoint session. At the endpoint session, all participants completed a user experience
questionnaire assessing their satisfaction with the EMA response format they used, problems
they had with their response format, and whether they would have preferred another response
method. Finally, an experimenter tallied completion rates and provided compensation at the end
of the session.
Data analysis
Valid responses were defined by the following criteria: within the acceptable numeric
range (0-4 for craving and hunger ratings, integer for servings consumed), logged before the
subsequent target time, and logged on the same day as the target time (i.e., next-day responses to
bedtime prompts were excluded). Invalid responses were catalogued according to error type:
non-numeric or out of the acceptable number range (“unacceptable”), before the target time
(“early”), and after the subsequent target time (“late”). Response latency was calculated as a
continuous variable in minutes from the target time and visualized using a histogram of the
number of responses in 30-minute bins (e.g., from the target time to 30 minutes after; from 31 to
60 minutes after, etc.).
All variables were checked for normality using the Shapiro-Wilk test; variables that were
significantly non-normal were transformed to improve normality. Specifically, BMI was
subjected to a -2 power transformation (i.e., BMI-2
), which improved the fit of the distribution to
11. SMS FOR FOOD INTAKE 11
normality from p < .001 to p > .6. The rest of the individual difference variables all passed the
Shapiro-Wilk test (p > .05), both within each method group and across all participants.
Independent samples t-tests were used to compare the variables of interest between the groups,
and Pearson’s correlations were used to assess the linear relationship between individual
difference variables and response rate/latency. For all tests, alpha was set at p < .05.
Results
Response Rate and Errors
Participants in the TXT EMA group responded at significantly more of the target times
than participants in the PNP EMA group (PNP: M = 69.91% valid response rate, SD = 29.49%;
TXT: M = 95.87%, SD = 3.78%; t(42) = 19.09, p < .001). Compared to the TXT EMA group,
participants in the PNP group produced more responses that were before the target time (PNP: M
= 3.05, SD = 5.76; TXT: M = 0.0, SD = 0.0; t(42) = 7.08, p = .011). There was no significant
difference in the number of unacceptable (PNP: M = 2.0, SD = 5.95; TXT: M = 0.48, SD = 1.53;
t(42) = 1.51, p = .23) or late responses between the groups (PNP: M = 1.37, SD = 5.03; TXT: M
= 0.0, SD = 0.0; t(42) = 1.89, p = .18), with few unacceptable or late responses in either group.
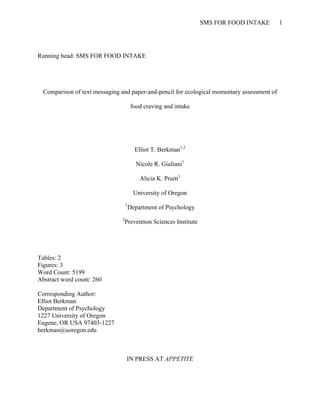
Response Latency
Participants in the TXT EMA group responded significantly closer to the target time (in
terms of target-to-response latency) than participants in the PNP group (PNP: M = 78.93
minutes, SD = 40.56; TXT: M = 29.02 minutes, SD = 16.09; t(42) = 31.54, p < .001). As shown
in Figure 3, participants in the TXT EMA group responded to significantly more prompts within
30 minutes of the target time (i.e., from 15 minutes before to 15 minutes after) than the PNP
group (PNP: M = 15.0 or 26.8%, SD = 12.86; TXT: M = 33.5 or 59.9%, SD = 7.79; t(42) =
45.73, p < .001). This same pattern holds for several other “fences” that might be used to define
12. SMS FOR FOOD INTAKE 12
timely responses vis-à-vis the target time, including 60 minutes (PNP: 39.2%, TXT: 71.1%), 90
minutes (PNP: 47.3%, TXT: 77.7%), and 120 minutes (PNP: 54.9%, TXT: 85.0%, all ts(42) >
10.00, ps < .001) within the target time.
Correlations with Individual Difference Measures
As an exploratory aim, we examined the correlations between response rate and latency
with BMI and several other individual differences measures, and compared these correlations
between the two groups (Table 2). Response rate correlated negatively with BMI in both groups,
but to a significantly greater degree in the PNP (r = -.49, p = .03) versus the TXT group (r = -.24,
p = .26; group X response rate interaction on BMI: F(1,39) = 3.96, p = .054). Response latency
correlated positively with BMI in both groups (PNP: r = .49, p = .03; TXT: r = .40, p < .051).
The positive relationship between BMI and latency did not differ between the groups, suggesting
that individuals with higher BMIs tended to have longer response latencies, and this effect was
not altered by EMA type. In both groups, response rates and response latency were negatively
related to each other (PNP: r = -.20, p = .41; TXT: r = -.44, p = .029), and these correlations
were not significantly different from one another (interaction: p = .29) even though the
correlation reached significance in the TXT group and not the PNP group. Summarizing the
results regarding the differential relations of BMI to compliance, participants with higher BMI
had longer response latencies in general but lower response rates only in the PNP group.
Next, we examined the differential correlations between the two groups with the other
individual difference measures. PNP response rate did not relate significantly to any of the other
individual difference measures (all ps > .30), and PNP response latency was related positively
only to agreeableness (r = .52, p = .023). This relationship was significantly stronger in the PNP
group compared to the TXT group (TXT: r = .06, p > .7; group X response latency interaction on
13. SMS FOR FOOD INTAKE 13
agreeableness: F(1,40) = 6.65, p < .05). In the TXT group, only extraversion was significantly
related (negatively) to mean response latency (r = -.44, p = .026), but not to a greater magnitude
than in the PNP group (interaction p = .23). In sum, among the individual difference measures,
only agreeableness related differentially with response latency such that individuals high in
agreeableness had greater latencies in the PNP than in the TXT EMA method.
User Experience
Finally, we examined group differences in user experience in terms of participant ratings
of satisfaction, self-efficacy to use the method, and preference for another method. Participants
in the PNP group reported being significantly less satisfied than those in the TXT EMA group
(PNP: M = 3.37, SD = 1.12; TXT: M = 4.0, SD = .92; t(42) = 4.26, p = .045). Self-efficacy to
provide accurate ratings was high in both groups (PNP: M = 3.79 of 5, SD = 1.08; TXT: M =
4.04, SD = 0.74) and did not differ between groups (p = .37). When asked whether they would
prefer another assessment method, 14 of the 19 PNP participants (73.7%) reported that they
would have preferred either a text- or online-based method, whereas only 1 of the 25 TXT EMA
participants (4%) reported that she preferred another method (a once-per-day email schedule).
The preference for an alternative method was significantly different between the two groups
(chi-squared = 23.33, p < .01).
Discussion
The present study compared PNP and TXT EMA for assessing food intake, food craving,
and hunger. Our main goal was to compare response rates, response latencies, feasibility, and
acceptability of these two types of EMA in the eating domain, where EMA is increasingly
popular but has received little methodological attention. We found that participants using the
TXT EMA format versus the PNP format had a greater mean response rate (96% versus 70%)
14. SMS FOR FOOD INTAKE 14
and a smaller latency to the target response time (29 minutes versus 79 minutes), and were also
more satisfied with their EMA experience and less likely to prefer a different format. This is the
first study to directly compare these two EMA formats in the eating domain, and among the first
to use time-stamps to examine response latencies in the PNP format and compare them to
latencies in the TXT format. Our results consistently favor TXT EMA over PNP in terms of
response rate, response latency, and user experience, and highlight the utility of text messaging
for electronic EMA, particularly in the eating domain where shorter response latencies are highly
valuable.
The present results provide further support for the feasibility of conducting EMA using
text messaging. Text messaging is low cost (typically less than $0.01 per message) and, though
brief (i.e., up to 160 characters), can be ideal for certain types of EMA assessment such as brief
questionnaires using Likert or count ratings. Text messaging is also highly familiar to most
participants, who increasingly own their own text-enabled phones, and is more accessible in low-
income and rural areas than alternative electronic EMA formats such as smartphone applications
or PDAs. A recent report from the Pew Research Center found that 91% of people in the United
States have a mobile device, nearly all of which are text messaging-enabled, whereas only 45%
owned smartphones (Smith, 2013). Formerly used mostly by young people, the demographics of
texting have shifted to include 87% of individuals aged 55-64, and 76% of those 65 and above
(Smith, 2013). Participants who do not already own such devices can be provided with pre-paid
phones (typically <$20), and text messages can be purchased in bulk for less than $0.01 each. At
that rate, sampling each participant four times each day for 60 days costs less than $5. Together
with the data presented here, these statistics indicate that text messaging is an ideal way to gather
15. SMS FOR FOOD INTAKE 15
repeated, brief assessments for low cost with high compliance and fast responses from nearly any
population.
An interesting set of exploratory findings that may be specific to the food-related nature
of the prompts was the relationship between BMI and response rate/latency. Notably, BMI was
related to response rate (negatively) and response latency (positively) in the PNP condition.
Individuals higher in BMI tended to respond less often and more slowly. The directions of these
relationships were the same in the TXT condition, but the magnitude of the effect for response
rate was significantly smaller. One possible interpretation of these results is that people with
higher BMI might have found reporting on their food intake and craving more aversive than
those with lower BMI, and thus avoided or delayed responding when possible. If that were the
case, then the difference between conditions might be attributable to text messaging being more
accessible, as people are increasingly using mobile phones for multiple modes of
communication. This increased accessibility and fluency with the TXT response method may
explain the smaller relationships between BMI and response rate/latency specifically, and the
increased response rates and reduced latencies in the TXT condition compared to PNP generally.
Indeed, recent research has shown that many people find text messaging and phone checking to
be very compelling (Augner & Hacker, 2012; Takao, Takahashi, & Kitamura, 2009; Walsh,
White, & Young, 2008). The fact that all individuals in this study used their own phones further
supports this interpretation.
Two other interesting exploratory results emerged in the relationship between response
latency and individual differences measures. Specifically, agreeableness related positively to
response latency in the PNP group (and related to a greater degree in the PNP group than in the
TXT group), and extraversion related negatively to response latency in the TXT group (though
16. SMS FOR FOOD INTAKE 16
not to a different degree than in the PNP group). It is notable that these relationships emerged in
the response latency but not the response rate metric, suggesting that individual differences are
more relevant to how long it takes to respond than whether or not a response is ultimately
provided. Perhaps individuals high in agreeableness were more likely to delay responses in the
PNP condition because responses using format cuase a greater disruption to ongoing social
activities than responses in the TXT format; in contrast, perhaps individuals high in extraversion
responded more quickly in the TXT condition because they used their phones—all of which were
text-enabled, and many of which were also smartphones—more often for communication and
social media. Though we believe these to be reasonable interpretations, we emphasize that we
offer them only as possibilities, and that more targeted research will be needed to conclusively
address the relationship between personality traits and response latency/rate.
The importance of response latency is not limited to the food domain. Latency is relevant
in any assessment domain with a time-sensitive measure such as mood/emotion (Keltner &
Gross, 1999), drug craving (Sayette, Shiffman, Tiffany, Niaura, Martin, & Shadel, 2000), and
medication compliance (Claxton, Cramer, & Pierce, 2001). Despite its importance for a range of
measures, latency has been evaluated less often than compliance in comparison studies of EMA,
perhaps because of the challenges to accurately measuring the time of completion for PNP
studies. Thus, one of the main strengths of the present study is the use of tamper-proof digital
time stampers to assess the timing of responses in the PNP condition. That technique gave us a
high degree of confidence that the stamps were made at the indicated time, though there is no
guarantee that the responses were made at the same time as the stamp. For example, a participant
could have time-stamped the response sheet within minutes of the target time, then backfilled the
responses at a later time. However, we minimized this possibility by making it as easy as
17. SMS FOR FOOD INTAKE 17
possible to complete the three rating items on the PNP survey: participants only needed to write
three numbers; each assessment point had a designated place in the packet; and the packet, time
stamper, and a pen were provided in a single baggie to participants so that if they had the
stamper and the packet then they also had a pen with which to make the ratings. Thus, we find it
unlikely that participants regularly remembered and took the time to imprint a timestamp, but
then later backfilled responses.
The present study has some additional limitations. First, the sample size (N=44) is
relatively small, but the effect sizes of the main comparison of response rate/latency between
groups was large (Cohen’s d > 1.0 in both cases), so the study was adequately powered to detect
and estimate these effects. Second, the age range and demographics of the sample is also
relatively limited, which may limit the generalizability of the findings. Future work could
investigate how response rate/latency varies between the two EMA methods in different
populations (e.g., school aged adolescents, older adults, etc.) Third, a key difference between the
two methods was the presence of an audible prompt in the TXT condition. We deliberately chose
not to add a response prompt so that our PNP condition would be representative of PNP as it is
most commonly deployed in the literature. We believe the use of a pre-scheduled booklet (in the
absence of reminder signals) in the PNP condition is a strength of the study because it provides
an explicit schedule to the participants in the PNP condition without directly prompting them at a
particular time (e.g., with an auditory signal). Lastly, because we chose to schedule our prompts
to occur after mealtimes and before bed, the conclusions of the present study are limited to
ratings made on a fixed schedule. Further research is needed to compare the response
rate/latency of the two methods when used with a random schedule or with ratings that are event-
contingent.
18. SMS FOR FOOD INTAKE 18
We close by echoing the conclusion of others (e.g., Tennen et al., 2006) that the overall
feasibility to TXT EMA might be highly dependent on the research domain and context. Here,
we saw outstanding response rates and short response latencies for numeric ratings of food
craving and intake—measures that are relatively easily quantified and fluctuate rather quickly,
lending themselves to a fast and short (e.g., 6 character) response format. However, it is not hard
to imagine a slightly different research question, for example, regarding the social context in
which energy-dense eating occurs, that is less easily quantified using a Likert-style question and
instead lends itself to a brief textual response. There, even though text messaging may be
feasible (i.e., that a text response could fit under 160 characters such as, “I was with friends at a
party”), participants might find a PNP diary to be more convenient depending on their level of
facility with typing whole sentences into a mobile phone. Other applications might require less
awkward response entry than the alphanumeric code used here, or skip logic where later queries
depend on earlier responses. Smartphones might be preferable for those purposes. Better still,
high-resolution cameras on mobile phones might be a new frontier for research questions
involving food intake (Martin, Correa, Han, Allen, Rood, Champagne, et al., 2012), superseding
both PNP and other electronic formats as a fast and reliable way of gathering EMA data for that
purpose. The degree of variability in response rates, and likely in response latencies, is likely
attributable at least in part to the extent to which the particular research question is amenable to
assessment using the chosen method. In turn, this implies the need for further studies such as this
one that compare various forms of EMA in specific research domains.
19. SMS FOR FOOD INTAKE 19
References
Augner, C., & Hacker, G. W. (2012). Associations between problematic mobile phone use and
psychological parameters in young adults. International Journal of Public Health, 57(2),
437-441.
Berkman, E. T., Dickenson, J., Falk, E. B., & Lieberman, M. D. (2011). Using SMS text
messaging to assess moderators of smoking reduction: Validating a new tool for
ecological measurement of health behaviors. Health Psychology, 30(2), 186–194.
Broderick, J. E., & Stone, A. A. (2006). Paper and electronic diaries: Too early for conclusions
on compliance rates and their effects—Comment on Green, Rafaeli, Bolger, Shrout, and
Reis (2006). Psychological Methods, 11(1), 106–111.
Broderick, J. E., Schwartz, J. E., Shiffman, S., Hufford, M. R., & Stone, A. A. (2003). Signaling
does not adequately improve diary compliance. Annals of Behavioral, 26(2), 139–148.
Burke, L. E., Conroy, M. B., Sereika, S. M., Elci, O. U., Styn, M. A., Acharya, S. D., et al.
(2009). The effect of electronic self-monitoring on weight loss and dietary intake: A
randomized behavioral weight loss trial. Obesity, 19(2), 338–344.
Burke, L. E., Wang, J., & Sevick, M. A. (2011). Self-monitoring in weight loss: A systematic
review of the literature. Journal of the American Dietetic Association, 111(1), 92–102.
Claxton, A. J., Cramer, J., & Pierce, C. (2001). A systematic review of the associations between
dose regimens and medication compliance. Clinical Therapeutics, 23(8), 1296–1310.
Cole-Lewis, H., & Kershaw, T. (2010). Text messaging as a tool for behavior change in disease
prevention and management. Epidemiologic Reviews, 32(1), 56–69.
Courvoisier, D. S., Eid, M., & Lischetzke, T. (2012). Compliance to a cell phone-based
ecological momentary assessment study: The effect of time and personality
20. SMS FOR FOOD INTAKE 20
characteristics. Psychological Assessment, 24(3), 713–720.
Ebner-Priemer, U. W., & Trull, T. J. (2009). Ecological momentary assessment of mood
disorders and mood dysregulation. Psychological Assessment, 21(4), 463–475.
Feldman Barrett, L., & Barrett, D. J. (2001). An introduction to computerized experience
sampling in psychology. Social Science Computer Review, 19(2), 175–185.
Gerber, B. S., Stolley, M. R., Thompson, A. L., Sharp, L. K., & Fitzgibbon, M. L. (2009).
Mobile phone text messaging to promote healthy behaviors and weight loss maintenance:
a feasibility study. Health Informatics Journal, 15(1), 17–25.
Green, A. S., Rafaeli, E., Bolger, N., Shrout, P. E., & Reis, H. T. (2006). Paper or plastic? Data
equivalence in paper and electronic diaries. Psychological Methods, 11(1), 87–105.
Heron, K. E., & Smyth, J. M. (2011). Ecological momentary interventions: Incorporating mobile
technology into psychosocial and health behaviour treatments. British journal of health
psychology, 15(1), 1–39.
John, O. P., Donahue, E. M., & Kentle, R. L. (1991). The Big Five Inventory – Versions 4a and
5. Berkeley, CA: University of California, Berkeley, Institute of Personality and Social
research.
Keltner, D., & Gross, J. (1999). Functional accounts of emotions. Cognition and Emotion, 13(5),
467–480.
Larson, R., & Csikszentmihalyi, M. (1983). The experience sampling method. New Directions
for Methodology of Social & Behavioral Science, 15, 41-56.
Laurenceau, J.-P., & Bolger, N. (2005). Using Diary Methods to Study Marital and Family
Processes. Journal of Family Psychology, 19(1), 86–97.
Martin, C. K., Correa, J. B., Han, H., Allen, H. R., Rood, J. C., Champagne, C. M., et al. (2012).
21. SMS FOR FOOD INTAKE 21
Validity of the Remote Food Photography Method (RFPM) for estimating energy and
nutrient intake in near real-time. Obesity, 20(4), 891–899.
Napolitano, M. A., Hayes, S., Bennett, G. G., Ives, A. K., & Foster, G. D. (2012). Using
Facebook and text messaging to deliver a weight loss program to college students.
Obesity, (21)1, 25-31.
Patrick, K., Raab, F., Adams, M. A., Dillon, L., Zabinski, M., Rock, C. L., et al. (2009). A text
message–based intervention for weight loss: Randomized controlled trial. Journal of
Medical Internet Research, 11(1), e1.
Patton, J. H., Stanford, M. S., & Barratt, E. S. (1995). Factor structure of the Barratt
impulsiveness scale. Journal of Clinical Psychology, 51(6), 768–774.
Sayette, M. A., Shiffman, S., Tiffany, S. T., Niaura, R. S., Martin, C. S., & Shadel, W. G. (2002).
The measurement of drug craving. Addiction, 95(Supplement 2), S189–S210.
Schembre, S. M., & Yuen, J. (2011). Project TwEATs. A feasibility study testing the use of
automated text messaging to monitor appetite ratings in a free-living population. Appetite,
56(2), 465–468.
Shapiro, J. R., Bauer, S., Hamer, R. M., Kordy, H., Ward, D., & Bulik, C. M. (2008). Use of text
messaging for monitoring sugar-sweetened beverages, physical activity, and screen time
in children: A pilot study. Journal of Nutrition Education and Behavior, 40(6), 385–391.
Shiffman, S. (1993). Assessing smoking patterns and motives. Journal of Consulting and
Clinical Psychology, 61(5), 732–742.
Shiffman, S., Stone, A. A., & Hufford, M. R. (2008). Ecological momentary assessment. Annual
Review of Clinical Psychology, (4), 1–32.
22. SMS FOR FOOD INTAKE 22
Smith, A. (2013). Smartphone Ownership — 2013 Update (pp. 1–12). Washington, D.C.: Pew
Research Center’s Internet & American Life Project.
Stone, A. A., Shiffman, S., Schwartz, J. E., Broderick, J. E., & Hufford, M. R. (2002). Patient
non-compliance with paper diaries. British Journal of Medicine, 324, 1193–1194.
Takao, M., Takahashi, S., & Kitamura, M. (2009). Addictive personality and problematic mobile
phone use. CyberPsychology & Behavior, 12(5), 501–507.
Tangney, J. P., Baumeister, R. F., & Boone, A. L. (2004). High self-control predicts good
adjustment, less pathology, better grades, and interpersonal success. Journal of
Personality, 72(2), 271–324.
Tennen, H., Affleck, G., Coyne, J. C., Larsen, R. J., & DeLongis, A. (2006). Paper and plastic in
daily diary research: Comment on Green, Rafaeli, Bolger, Shrout, and Reis (2006).
Psychological Methods, 11(1), 112–118.
Thomas, J. G., Doshi, S., Crosby, R. D., & Lowe, M. R. (2009). Ecological momentary
assessment of obesogenic eating behavior: Combining person-specific and environmental
predictors. Obesity, 19(8), 1574–1579.
Trull, T. J., & Ebner-Priemer, U. (2013). Ambulatory assessment. Annual Review of Clinical
Psychology, 9(1), 151–176.
Walsh, S. P., White, K. M., & Young, R. M. (2008). Over-connected? A qualitative exploration
of the relationship between Australian youth and their mobile phones. Journal of
Adolescence, 31(1), 77–92.
Werthmann, J., Roefs, A., Nederkoorn, C., Mogg, K., Bradley, B. P., & Jansen, A. (2011).
Can(not) take my eyes off it: Attention bias for food in overweight participants. Health
Psychology, 30(5), 561–569.
23. SMS FOR FOOD INTAKE 23
Table 1. Demographics for each group and for the total sample.
Paper and Pencil Text messaging Total
Number of subjects 19 25 44
# Female / Male
% Female / % Male
13 F / 6 M
68.4 F / 31.6 M
17 F / 8 M
68 F / 32 M
30 F / 14 M
68.2 F / 31.8 M
Age (SD) 20.26 (1.098) 22.00 (2.722) 21.25 (2.324)
Response rate (SD) 69.91% (29.5) 95.87% (3.78) 84.66% (23.27)
Response latency (SD) 78.93 m (40.56) 29.02 m (16.09) 50.58 m (38.19)
24. SMS FOR FOOD INTAKE 24
Table 2. Correlations between response rate/latency and individual differences by group.
Method: PNP Response
Latency
Self-
Control
Impulsivity E A C N O BMI
Response Rate -.2 -.05 -.17 -.25 -.22 .15 .21 -.17 -.49*
Response Latency -.28 -.17 .10 .52* .07 -.36 .17 .49*
Self-Control .02 .04 -.13 .17 -.14 -.08 -.27
Impulsivity .24 -.18 -.05 .37 .05 .01
Extraversion -.13 -.13 -.56* -.10 .16
Agreeableness .54* -.33 .63* .44
Conscientiousness -.03 .30 -.15
Neuroticism -.19 -.12
Openness .09
Method: TXT Response
Latency
Self-
Control
Impulsivity E A C N O BMI
Response Rate -.44* .01 .02 .16 -.02 .19 -.15 -.33 -.24
Response Latency .07 .21 -.44* .06 -.13 .14 -.08 .40
Self-Control -.04 .36 .14 .64* -.56* -.01 .17
Impulsivity .14 .18 .18 .10 .33 .51*
Extraversion .29 .33 -.35 .33 -.23
Agreeableness .13 -.21 .24 -.12
Conscientiousness -.52* .15 .32
Neuroticism -.11 -.08
Openness -.05
Note. Values listed are Pearson’s r values. A = agreeableness; BMI = Body mass index; C =
conscientiousness; E = extraversion; Imp = impulsivity; N = neuroticism; O = openness.
* p < .05. Correlations in bold are significantly different between the two EMA groups.
25. SMS FOR FOOD INTAKE 25
Figure captions
Figure 1. A representative page from the 14-page paper-and-pencil packet. The cover page
included full wordings for each of the three rating items as described in the text. (A) Each page
was prefilled by the experimenter at the baseline session to include the four assessment points
based on each participant’s meal times and bedtime. (B) A representative page from a completed
packet with one missing response. Note that response latencies can be calculated by comparing
the time stamp with the target time for each prompt.
Figure 2. The “cheat sheet” laminated card that was provided to electronic EMA participants.
(Left) The front of the card contained a description of the six-digit alphanumeric code for that
participants used to respond to the three items at each prompt. (Right) The back of the card
contained the full rating item for craving, food intake (“eating”), and hunger.
Figure 3. Histogram of the number of responses that the PNP (left) and TXT EMA (right) group
made within each 30-minute time bin relative to the target time.
26. SMS FOR FOOD INTAKE 26
Figure 1. A representative page from the 14-page paper-and-pencil packet. The cover page
included full wordings for each of the three rating items as described in the text. (A) Each page
was prefilled by the experimenter at the baseline session to include the four assessment points
based on each participant’s meal times and bedtime. (B) A representative page from a completed
packet with one missing response. Note that response latencies can be calculated by comparing
the time stamp with the target time for each prompt.
27. SMS FOR FOOD INTAKE 27
Figure 2. The “cheat sheet” laminated card that was provided to electronic EMA participants.
(Left) The front of the card contained a description of the six-digit alphanumeric code for that
participants used to respond to the three items at each prompt. (Right) The back of the card
contained the full rating item for craving, food intake (“eating”), and hunger.
28. SMS FOR FOOD INTAKE 28
Figure 3. Histogram of the number of responses that the PNP (left) and TXT EMA (right) group
made within each 30-minute time bin relative to the target time.