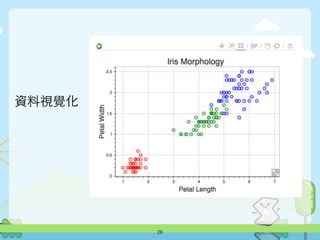
List vs Series
8
importnumpy as np
import pandas as pd
sample_series = pd.Series(np.random.sample(1000000))
sample_list = list(np.random.sample(1000000))
%timeit sample_series+sample_series
1000 loops, best of 3: 1.04 ms per loop
10 loops, best of 3: 136 ms per loop
%timeit [i+i for i in sample_list]
1.04
136


![integer-based indexing
6
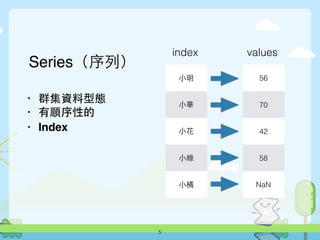
height = pd.Series([150, 175, 143, 174, 158])
weight = pd.Series([56, 70, 42, 58, np.nan])
bmi = weight / (height / 100) ** 2
0 24.888889
1 22.857143
2 20.538902
3 19.157088
4 NaN
以Series運算為例](https://image.slidesharecdn.com/sitcon-160614125430/85/Pandas-6-320.jpg)

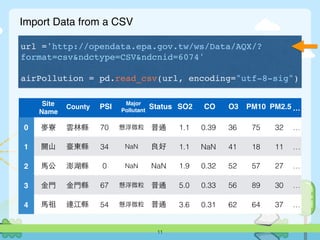
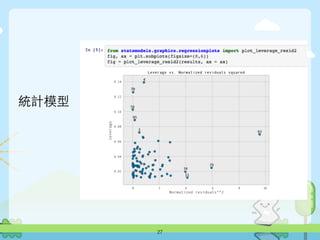
![List vs Series
8
import numpy as np
import pandas as pd
sample_series = pd.Series(np.random.sample(1000000))
sample_list = list(np.random.sample(1000000))
%timeit sample_series+sample_series
1000 loops, best of 3: 1.04 ms per loop
10 loops, best of 3: 136 ms per loop
%timeit [i+i for i in sample_list]
1.04
136](https://image.slidesharecdn.com/sitcon-160614125430/85/Pandas-8-320.jpg)


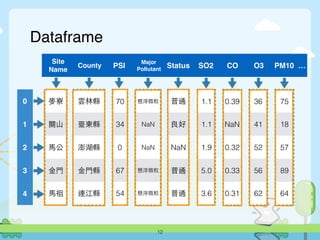
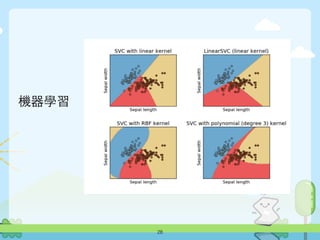
![Select Series from a Dataframe
13
SiteName County PSI
MajorPoll
utant
Status SO2 CO O3 PM10 ... psi2
0 ⿆麥寮 雲林縣 70 懸浮微粒 普通 1.1 0.39 36 75 … 122.09
1 關⼭山 臺東縣 34 NaN 良好 1.1 NaN 41 18 … NaN
2 ⾺馬公 澎湖縣 0 NaN NaN 1.9 0.32 52 57 … 113.82
3 ⾦金⾨門 ⾦金⾨門縣 67 懸浮微粒 普通 5.0 0.33 56 89 … 156.33
4 ⾺馬祖 連江縣 54 懸浮微粒 普通 3.6 0.31 62 64 … 133.31
airPollution['psi2'] = (
airPollution['PM10'] +
airPollution['SO2'] +
airPollution['CO'] +
airPollution['O3'] +
airPollution['NO2'] )](https://image.slidesharecdn.com/sitcon-160614125430/85/Pandas-13-320.jpg)
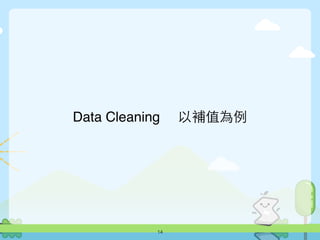

![以補值為例
16
0 1 2 3 4 5 6 …
0
臺中市政府
核准⽴立案⽼老
⼈人福利機構
名冊 更新⽇日
期: ......
NaN NaN NaN NaN NaN NaN …
1 ⾏行政 區域 機構名稱 負責⼈人 地址 電話 床型/床數
⺫⽬目前收
容⼈人數
…
2 中區
台中市私
⽴立溫興⻑⾧長
期照顧...
賴興建
臺中市中區
雙⼗十路⼀一段
19巷6號
04-22230
938
養護15床
(含插2管7床)
養護12
⼈人
…
url = 'http://www.society.taichung.gov.tw/section/index-1.asp?
Parser=99,16,257,,,,3807,589,,,,42,,3'
careCenter = pd.read_html(url)[1]](https://image.slidesharecdn.com/sitcon-160614125430/85/Pandas-16-320.jpg)
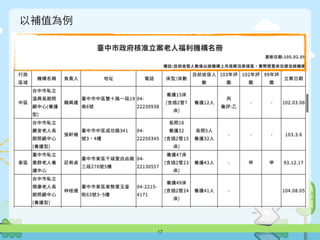
![以補值為例
18
1 ⾏行政區域 機構名稱 負責⼈人 地址 電話 床型/床數
⺫⽬目前收容
⼈人數 …
2 中區
台中市私⽴立溫
興⻑⾧長期照顧中
⼼心(養護型)
賴興建
臺中市中區
雙⼗十路⼀一段
19巷6號
04-22230
938
養護15床
(含插2管7床)
養護12⼈人 …
3 NaN
台中市私⽴立麗
安⽼老⼈人⻑⾧長期照
顧中⼼心(養護型)
張軒維
臺中市中區
成功路341
號3、4樓
04-22250
345
⻑⾧長照16 養
護32
(含插2管15床)
⻑⾧長照5⼈人
養護32⼈人
…
4 東區
臺中市私⽴立惠
群⽼老⼈人養護中
⼼心
莊俐貞
臺中市東區干
城⾥里⾃自由路三
段276號5樓
04-22130
557
養護47床
(含插2管23床)
養護43⼈人 …
5 NaN
台中市私⽴立德
康⽼老⼈人⻑⾧長期照
顧中⼼心(養護型)
林桂連
臺中市東區東
勢⾥里⽟玉皇街63
號3~5樓
04-2215-4
171
養護49床
(含插2管24床)
養護41⼈人
careCenter.columns = careCenter.ix[1]
careCenter = careCenter[2:]](https://image.slidesharecdn.com/sitcon-160614125430/85/Pandas-18-320.jpg)
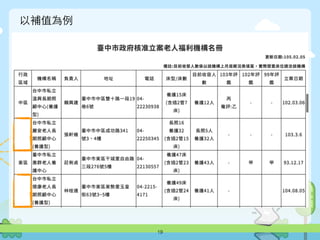
![以補值為例
20
1 ⾏行政區域 機構名稱 負責⼈人 地址 電話 床型/床數
⺫⽬目前收容
⼈人數 …
2 中區
台中市私⽴立溫
興⻑⾧長期照顧中
⼼心(養護型)
賴興建
臺中市中區
雙⼗十路⼀一段
19巷6號
04-22230
938
養護15床
(含插2管7床)
養護12⼈人 …
3 中區
台中市私⽴立麗
安⽼老⼈人⻑⾧長期照
顧中⼼心(養護型)
張軒維
臺中市中區
成功路341
號3、4樓
04-22250
345
⻑⾧長照16 養
護32
(含插2管15床)
⻑⾧長照5⼈人
養護32⼈人
…
4 東區
臺中市私⽴立惠
群⽼老⼈人養護中
⼼心
莊俐貞
臺中市東區干
城⾥里⾃自由路三
段276號5樓
04-22130
557
養護47床
(含插2管23床)
養護43⼈人 …
5 東區
台中市私⽴立德
康⽼老⼈人⻑⾧長期照
顧中⼼心(養護型)
林桂連
臺中市東區東
勢⾥里⽟玉皇街63
號3~5樓
04-2215-4
171
養護49床
(含插2管24床)
養護41⼈人
careCenter['⾏行政區域'] = (
careCenter[‘⾏行政區域'].fillna(method='ffill')
) # http://pandas.pydata.org/pandas-docs/stable/missing_data.html](https://image.slidesharecdn.com/sitcon-160614125430/85/Pandas-20-320.jpg)
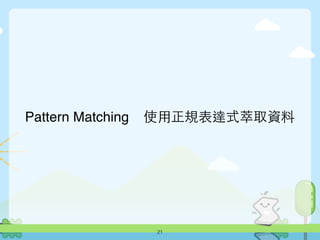
![使⽤用正規表達式萃取資料
22
1 ⾏行政區域 機構名稱 負責⼈人 地址 電話 床型/床數
⺫⽬目前收容
⼈人數 …
2 中區
台中市私⽴立溫
興⻑⾧長期照顧中
⼼心(養護型)
賴興建
臺中市中區
雙⼗十路⼀一段
19巷6號
04-22230
938
養護15床
(含插2管7床)
養護12⼈人 …
3 中區
台中市私⽴立麗
安⽼老⼈人⻑⾧長期照
顧中⼼心(養護型)
張軒維
臺中市中區
成功路341
號3、4樓
04-22250
345
⻑⾧長照16 養
護32
(含插2管15床)
⻑⾧長照5⼈人
養護32⼈人
…
def 養護(t):
match = re.findall('養護(d+)', t)
if match:
return int(match[0])
else:
return None
careCenter['⺫⽬目前收容⼈人數(養護)'] = careCenter['⺫⽬目前收容⼈人數'].apply(養護)
careCenter['床型/床數(養護)'] = careCenter['床型/床數'].apply(養護)](https://image.slidesharecdn.com/sitcon-160614125430/85/Pandas-22-320.jpg)


![[DSC 2016] 系列活動:許懷中 / R 語言資料探勘實務](https://cdn.slidesharecdn.com/ss_thumbnails/rdatamining-161030010840-thumbnail.jpg?width=640&height=640&fit=bounds)


