

Recommended
More Related Content
Viewers also liked
Viewers also liked (11)
Recently uploaded
Recently uploaded (20)
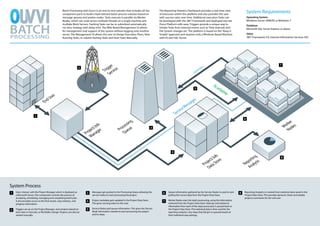
Ouvvi Datasheet
- 1. Batch Processing with Ouvvi is an end-to-end solution that includes all the component parts to build a fault tolerant batch process solution based on The Reporting Statistics Dashboard provides a real-time view of execution within the platform and also provides the user System Requirements message queues and worker nodes. Tasks execute in parallel via Worker with success rates over time. Additional execution Tasks can Operating System Nodes, which can scale across multiple threads on a single machine and be developed with the .NET Framework and deployed into the Windows Server 2008/R2 or Windows 7 multiple Work Servers. Faulting Tasks can be re-submitted automatically Ouvvi Platform with ease. Triggers provide a unique way to Database via retry strategy with delay time. The Web Based Management UI allows Initiate Tasks from external events such as Time Intervals and Microsoft SQL Server Express or above for management and support of the system without logging onto another File System changes etc. The platform is based on the “Keep it server. The Management UI allows the user to Design Execution Plans, View Simple” approach and requires only a Windows Based Machine Other Running Tasks, re-submit faulting Tasks and Start Tasks Manually. with IIS and SQL Server. .NET Framework 4.0, Internet Information Services (IIS) NO DE NO 7 rv r 2 S e ge NO NO ry DE et DE DE g ice eR Tri eu Qu NO NO DE NO DE DE NO DE Sc NO DE 5 ala NO ble NO DE NO DE DE NO NO r se DE NO DE DE dU s ge En ssa NO DE Me ice rv Se 1 6 e g de r No rke eu sin ge b Qu oces Wo s na t/Jo 3 Pr Ma ojec r Pr 4 8 St ob sis g aly tin ta t/J e An por Da ojec or Re Pr System Process 1 Users interact with the Project Manager which is deployed on 3 Messages get pushed to the Processing Queue allowing the 6 Queue information gathered by the Service Nodes is used to start 8 Reporting Analytics is created from statistical data saved in the a Microsoft Server. This component controls the process of service nodes to start processing the project. pulling the correct data from the Project Data Store. Project Data Store. This provides dynamic charts and weekly accepting, scheduling, managing and completing batch jobs. projects summaries for the end user It also provides access to the final results, step statistics, and 4 Project metadata gets updated in the Project Data Store. 7 Worker Nodes start the batch processing, using the information progress information. This gives running status to the user. retrieved from the Project Data Store. Statuses and statistical information from each of the steps processed, is passed back to Triggers set up on the Project Manager, start projects based on 5 Service Nodes pull queue information. This gives the Service the Project Data Store. This statistical data is then used for the 2 Node information needed to start processing the project time slots or intervals, or file/folder change. Projects can also be reporting analytics. Any steps that fail get re-queued based on started manually. and its steps. their individual step settings.