Eesti tööandjate ja töötajate tööturu- ja palgauuring Sügis-Talv 2015/16 tutvustusmaterjal. Labour market and salary survey of employers and employees in Estonia.
Väljaanne „Tööturu jatasustamise trendid
Sügis-Talv 2015/16“
Novembris 2015 läbiviidud tööandjate ja töötajate tööturu- ja
palgauuringu tulemuste kokkuvõte
54 lk, A4, pdf-formaat
Sisukord
• Tööturu ja palgastatistika, prognoosid
• Trendid värbamises, töö asukohaga seotud tõmbe- ja tõuketegurid
• Töökorraldus, töötajate tervis ja motivatsioon
• Töötasud ja soodustused – ootused ja rahulolu
• Kokkuvõte ja järeldused
• Palgainfo Agentuuri uuringute metoodika
Tasuta uuringu tulemuste kokkuvõte
4.
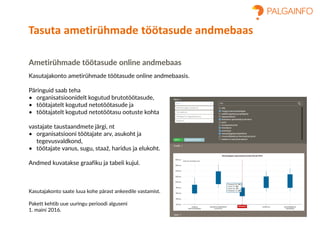
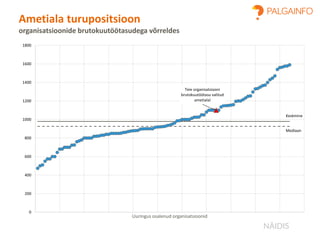
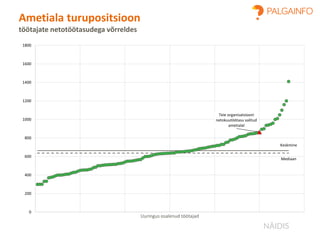
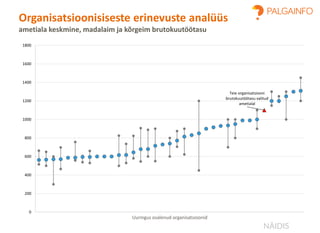
Ametirühmade töötasude onlineandmebaas
Kasutajakonto ametirühmade töötasude online andmebaasis.
Päringuid saab teha
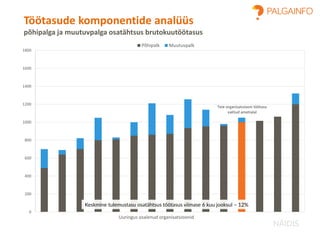
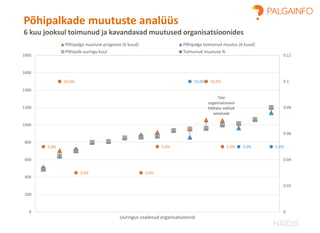
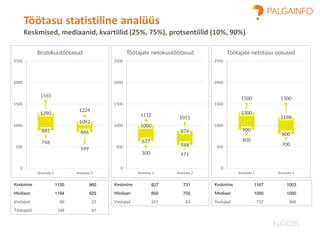
• organisatsioonidelt kogutud brutotöötasude,
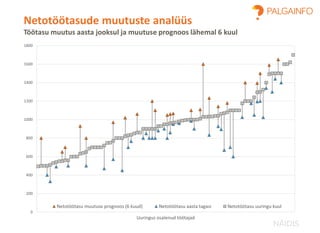
• töötajatelt kogutud netotöötasude ja
• töötajatelt kogutud netotöötasu ootuste kohta
vastajate taustaandmete järgi, nt
• organisatsiooni töötajate arv, asukoht ja
tegevusvaldkond,
• töötajate vanus, sugu, staaž, haridus ja elukoht.
Andmed kuvatakse graafiku ja tabeli kujul.
Kasutajakonto saate luua kohe pärast ankeedile vastamist.
Pakett kehtib uue uuringu perioodi alguseni
1. maini 2016.
Tasuta ametirühmade töötasude andmebaas
Uuring koosneb:
• Palgauuringehk töötasude turuvõrdlus
• Tööturuküsitlus veebis
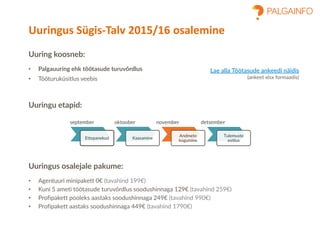
Uuringu etapid:
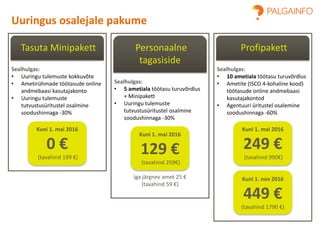
Uuringus osalejale pakume:
• Agentuuri minipakett 0€ (tavahind 199€)
• Kuni 5 ameti töötasude turuvõrdlus soodushinnaga 129€ (tavahind 259€)
• Profipakett pooleks aastaks soodushinnaga 249€ (tavahind 990€)
• Profipakett aastaks soodushinnaga 449€ (tavahind 1790€)
Uuringus Sügis-Talv 2015/16 osalemine
Ettepanekud Kaasamine
Andmete
kogumine
Tulemuste
esitlus
september november detsemberoktoober
Lae alla Töötasude ankeedi näidis
(ankeet xlsx formaadis)
7.
Väljaanne „Tööturu jatasustamise trendid Sügis-Talv
2015/16“
Novembris 2015 läbiviidud tööandjate ja töötajate tööturu- ja palgauuringu tulemuste kokkuvõte
54 lk, A4, pdf-formaat
Sisukord
• Trendid tööturul
• Tõmbe- ja tõuketegurid värbamises, tööandja maine
• Töötajate tervis ja töökeskkonna korraldus
• Trendid tasustamises
• Kokkuvõte ja järeldused
• Palgainfo Agentuuri uuringud
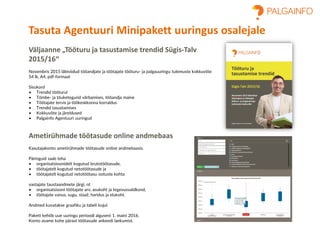
Ametirühmade töötasude online andmebaas
Kasutajakonto ametirühmade töötasude online andmebaasis.
Päringuid saab teha
• organisatsioonidelt kogutud brutotöötasude,
• töötajatelt kogutud netotöötasude ja
• töötajatelt kogutud netotöötasu ootuste kohta
vastajate taustaandmete järgi, nt
• organisatsiooni töötajate arv, asukoht ja tegevusvaldkond,
• töötajate vanus, sugu, staaž, haridus ja elukoht.
Andmed kuvatakse graafiku ja tabeli kujul.
Pakett kehtib uue uuringu perioodi alguseni 1. maini 2016.
Konto avame kohe pärast töötasude ankeedi laekumist.
Tasuta Agentuuri Minipakett uuringus osalejale