More Related Content

PPTX
Kim Larsen on State of Open RAN 2025 v5.pptx 
PDF
How to build high performance 5G networks with vRAN and O-RAN 
PDF
X-Haul: towards an integrated 5G transport network architecture 
PPT
Huawei telecom i+d 2010v4 
PDF

PDF
Evolving to an open C-RAN Architecture for 5G 
PDF

PPTX
O_RAN.pptxklllkioouuuuyyyvvvvvvccccgtyyybb Similar to ORAN and NextGen xHaul TCO Analysis.pptx

PPTX
Cloud RAN for Mobile Networks_Final 
PDF
Seesion2_Arnab Das_Capgemini Engineering Open RAN India.pdf 
PPTX

PPTX
Mavenir: RAN Evolution for 5G 
PDF
Getting to the Edge – Exploring 4G/5G Cloud-RAN Deployable Solutions 
PDF
Beginners: TCO of a Mobile Network 
PDF
Aleyggfffhhfoggcccccccccccccjlvvcxddi.pdf 
PDF
A fresh approach to remote IoT Connectivity by Podsystem 
PDF
A fresh approach to remote IoT connectivity | by Podsystem 
PPTX
Global Telecom Equipment market update 19_9.pptx 
PDF
PLNOG 22 - Aleksandra Chećko, Robert Cieloch - 5G: wydatek czy oszczędność? 
PDF
Reducing RAN infrastructure resources by leveraging 5G RAN Transport Technolo... 
PDF
3GPP Standards for the Internet-of-Things 
PDF
5G: Why Wait? - 5G Observatory 2016 
PDF
5G: Why Wait? - 5G Observatory 2016 
PDF
IoT connectivity and solutions 
PDF
5G Network Managament for Inteligent Transport Systems 
PDF

PDF
LTE-M & NB-IoT Roadmap at LPWAN Conference 2018 
PDF
Role and REvolution of Radio Acsses Networks Recently uploaded

PPT
HDTV and DTV Standards: The United States Opts for a Digital HDTV Standard 
PDF
कम्प्यूटर.pdf for all computer examination 
PPTX
Spacecraft Guidance Quick Research Guide by Arthur Morgan 
PPTX
Corporate AI Training to AI Enable a Company Workforce 
PDF
Digital Marketing Trends in 2026: AI, Data, Content & Future Growth 
PDF
Artificial Intelligence(AI) full Book.pdf 
PPTX
AI Bot Traffic Surge: Retail Fraud Threat for Age-Restricted Websites 
PDF
Industrial RFID Landscape for 2025 - Readers, Tags, Antennas, Printers, etc 
PDF
A Brief Introduction About Christopher Elwell Woburn 
PPTX
Why 2026 Could Be a Turning Point for Decentralized Exchanges.pptx 
PPT
Carole BirdCarole BirdCarole BirdCarole Bird.ppt 
PDF
The map to conquer linear algebra for IT engineer 
PDF
Navigating the Spectrum of Advanced AI – Agentic, Autonomous, and Autopoietic... 
PDF
250 Prompts - ChatGPT acting as your Assistant 
PDF
IAI-Unit1-notes useful............................. 
PPTX
AN Introduction to UNIX File System—An Approach 
PDF
Ai In Courts Ai in courts AI in court AI in court 
PDF
How Application Performance Monitoring Tools Are Used in Performance Testing 
PDF
Benefits of Using the IAC 500 Sensor for Ambient Conditions 
PDF
Huawei Datacom – How To Pass H12-892 On Your First Try ORAN and NextGen xHaul TCO Analysis.pptx
- 1.
O-RAN and NextGenxHaul
TCO Analysis
Dimas Noriega, Ricky Perry, Hendry Tong
Converged Access and Device Technology
Updated 9-13-19
Based on TCO worksheet ver. 2.61
© 2019 AT&T Intellectual Property. AT&T, Globe logo, and DIRECTV are registered trademarks and service marks of
AT&T Intellectual Property and/or AT&T affiliated companies. All other marks are the property of their respective owners.
- 2.
Presentation title here—editon Slide Master
© 2019 AT&T Intellectual Property. All rights reserved. AT&T, Globe logo, Mobilizing Your World and DIRECTV are registered trademarks and service marks of AT&T Intellectual Property and/or
AT&T affiliated companies. All other marks are the property of their respective owners.
2
Executive Summary
Target architecture
Disaggregated, Containerized RAN SW running
on
Centralized,
O-RAN compliant,
Non-proprietary, and
Pooled hardware
Pivot year Disaggregate LTE + 5G Disaggregate 5G only
2021 $220M $205M
2022 $193M $176M
2023 $113M $90M
Recommendations:
Issue RFP for FHG/CAS in 2019, targeting for 2021 deployment
•FHG PIZ in 4Q 2019 in NYC – already funded and in motion
•RFP FHG/CAS 4Q2019, Recommendation 1Q2020
•2020 TechDev, Validation, Certification, and FFA 4Q
•RoE Phase 1Q2021, L-PHY phase 1Q2022 (aim to accelerate L-PHY to 2021)
Issue RFI/RFP for whitebox O-DU/O-BBU in late 2019-early 2020,
targeting for 2020-2021 trial/PIZ and 2021-2022 deployment
•Drive ecosystem to develop O-RAN compliant O-DU/O-BBU product
•Start with incumbent vendors’ disaggregated HW and SW
•Trial O-RAN– start with O-CU & O-DU (Sub6) in 2020, then O-DU/O-BBU (sub6, mmW)
in 2021
Conduct a more thorough modeling for the whole NYC and LA
markets
Conclusions:
Lower TCO w/ Centralized O-RAN : 7 year cost saving $159M~$220M
for 4 markets
• Nationwide estimate: ~$350- $500M including extra cost on RAN SW, TechDev,
eCOMP.
Benefit mostly from BBU pooling (CAPEX) & Transport (OPEX) for OOR
markets
• Higher the site density, greater the saving
Sooner we pivot, higher is saving
Present Target
Based on 4 market (NYC, LV, ATL, SF)
- 3.
Presentation title here—editon Slide Master
© 2019 AT&T Intellectual Property. All rights reserved. AT&T, Globe logo, Mobilizing Your World and DIRECTV are registered trademarks and service marks of AT&T Intellectual Property and/or
AT&T affiliated companies. All other marks are the property of their respective owners.
3
RAN: (BBU / vBBU)
• BBU pooling in Urban/Dense Urban areas only
• DSS works when regardless if LTE is disaggregated or not;
• Only 5G BBU are subject to upgrade/replacement, after 5 years
placed in services
• Legacy LTE BBU write-off applied in case of LTE SW disaggregated
• E/// 5216, Nokia ABIA/ASIA.
• Newer BBU (E/// 6630, Nokia ABIL/ASIK) is re-deployable.
Transport
Capital Data Views:
• SIAD Types, cost, and logic are normalized across IR and
OOR averages.
• Data are rolled up into a market level view
• Output is based on RAN configuration and BBU capacity
modeled.
Network Cloud:
• Assume multi-tenancy/linear scalability supported in 2021
Key Assumptions and Parameters
2028 target ATL NYC LV SF
Smallcell sites per Macro site (Core) 4 7 5 7
Smallcell site per Macto site (non core) 3 3 3 3
vDU-vCU on WB BBU - E/// LTE SW cost mark up on BAU SWBO 50%
vDU-vCU on WB BBU - E/// 5G SW cost mark up on BAU SWBO 50%
vDU-vCU on WB BBU - Nokia LTE SW cost mark up on BAU SWBO 50%
vDU-vCU on WB BBU - Nokia 5G SW cost mark up on BAU SWBO 50%
Deployment start (Year) 2021
LTE disaggregated year 2029
5G50% take up rate 2024
Smallcell perMarco site mid-point year 2024
Macro -mmW % mid-point year 2024
densification 50% rate (smallcell mmW % mid-point year) 2024
% of Marco site deploying mmW (Core) - by 2028 30%
% of Marco site deploying mmW (non Core) - by 2028 10%
% of cRAN smallcell deployed mmW (Core) - by 2028 70%
% of cRAN smallcell deploye mmW (non Core) - by 2028 20%
- 4.
Presentation title here—editon Slide Master
© 2019 AT&T Intellectual Property. All rights reserved. AT&T, Globe logo, Mobilizing Your World and DIRECTV are registered trademarks and service marks of AT&T Intellectual Property and/or
AT&T affiliated companies. All other marks are the property of their respective owners.
TCO Cost: 7 year NPV starting year 2021
cluster
O-BBU & Pooling
(LTE
Disaggregated)
Transport Other total
ATL $13.2 M -$13.2 M -$10.7 M -$10.7 M
SF $32.9 M -$21.7 M -$15.7 M -$4.5 M
LV $19.6 M $40.9 M -$11.1 M $49.4 M
NYC $133.6 M $98.3 M -$46.1 M $185.8 M
Sum $199.3 M $104.3 M -$83.6 M $220.0 M
TCO Cost: 7 year NPV starting year 2021
cluster
O-BBU & Pooling
(LTE
Disaggregated)
Transport Other total
ATL $13.2 M $46.7 M -$10.7 M $49.2 M
SF $32.9 M $66.3 M -$15.7 M $83.5 M
LV $19.6 M $40.9 M -$11.1 M $49.4 M
NYC $133.6 M $98.3 M -$46.1 M $185.8 M
Sum $199.3 M $252.2 M -$83.6 M $368.0 M
4
Transport Savings Assumptions:
• OOR markets (e.g.: NYC, LV) have significant
saving opportunities w/ O-RAN arch.
• IR markets based on telco service MRC
o “Grey Dollar (Budget Savings)” Telco service
MRC
o “Green Dollar (Cost of Business)” Deployment
cost and LRIC (i.e. Depreciation, Tax,
Maintenance)
• Mobility realizes budget savings for IR by
moving to O-RAN
— ATL and SF realized $107M in budget savings
• IR Budget savings does not contribute to NPV
and IRR calculations.
Additional Savings view – With Gray $$$ included
7 year NPV Saving: O-RAN w/ both 5G and LTE Disaggregated
With out Mobility IR Gray $$$ Included
7 year NPV Saving: O-RAN w/ both 5G and LTE Disaggregated
With Mobility IR Gray $$$ Included
Compared to Present Mode of Operation
Note: results assumes 2x cost multiplier for HUB cost on C&I and
Materials for macro site compared to current HUB cost for cRAN site.
ATL-SF
Cost of Business
ATL-SF
Budget Savings
- 5.
Presentation title here—editon Slide Master
© 2019 AT&T Intellectual Property. All rights reserved. AT&T, Globe logo, Mobilizing Your World and DIRECTV are registered trademarks and service marks of AT&T Intellectual Property and/or
AT&T affiliated companies. All other marks are the property of their respective owners.
5
• RAN performance & reliability improvement due to
centralized scheduler , optimized mobility/layer
management, UL CoMP/Multi TRP, Intersite CA etc
• Potential saving for 1: many macro-cRAN mmW site
deployment (~$4M saving for 4 markets studied
assuming 2021 pivot)
• Inter site FR1-FR2 CA/DC is easier to implement
• Synergy with Edge Core, MEC
• RU-BBU remapping (carrier growth driven) made
easier
• Synergy in wireless/wireline transport convergence
and potential cost saving for wireline business
• Potential maintenance saving with more advanced
troubleshooting capability using FHG/CAS
The “Intangibles”…
Operation complexity in
• managing disaggregated BBU - lessons learned
from vEPC operation and D1D2 transition in
• RAN SW feature management in disaggregated CU
and DU
• Using ECOMP instead of vendor OSS
• Cost for geo-redundancy
Risk in:
• Incumbent vendors’ support for CPRI eCPRI
conversion on FHG
• Incumbent vendor’s support for disaggregated LTE
SW and DSS SW using non disaggregated LTE SW
• Readiness of O-RAN compliant Whitebox BBU
• CO/HUB’s reliability: 5-9 desired but may be difficult
to achieve?
Benefit Cost & Risk
- 6.
Presentation title here—editon Slide Master
© 2019 AT&T Intellectual Property. All rights reserved. AT&T, Globe logo, Mobilizing Your World and DIRECTV are registered trademarks and service marks of AT&T Intellectual Property and/or
AT&T affiliated companies. All other marks are the property of their respective owners.
6
What critical network capabilities are needed to realize the cost
saving?
1. Whitebox O-RAN compliant BBU (“O-BBU”)
• O-RAN support of AT&T ‘s WB concept
2. Incumbent vendors support RAN SW virtualization on WB O-BBU
• In case of LTE not disaggregated : support DSS with classical LTE and virtual 5G BBU
3. O-RAN compliant FHG/CAS product capable of converting CPRI to eCPRI
• RAN Supplier to provide Low-PHY software module
• Incumbent vendors’ continuous support for FHG/CAS
4. Tools to manage packetized transport network
• we already have such architecture and skillset
5. Efficient way to manage cRAN HUB planning and build-out
• organizationally we may need a dedicated team for this purpose;
• Lesson learned for Edge core build
Critical Enablers
- 7.
Presentation title here—editon Slide Master
© 2019 AT&T Intellectual Property. All rights reserved. AT&T, Globe logo, Mobilizing Your World and DIRECTV are registered trademarks and service marks of AT&T Intellectual Property and/or
AT&T affiliated companies. All other marks are the property of their respective owners.
7
FHG/CAS
How Do We Get There From Here?
2019
Explore & Drive
2020
Design and Trial
2021
Develop & Deploy
2022
Deploy & Optimize
2023
Expand & Scale
2H 1H 2H 1H 2H 1H 2H 1H 2H
O-DU/BBU
+ RAN SW
TechDev &
Internal
tools
Refine O-DU POR
Drive O-RAN WG6
roadmap
Initiate RAN roadmap
plan with
incumbents
Refine FH_G
POR
Issue RFP
Issue RFI/RPF
Refine RAN
roadmap
Define requirements
0-DU PIZ (Rel. 1)
(Sub-3, single server
pooling)
PIZ (RoE)
O-DU/CU FFA + limited
deployment
RoE FFA
LoPhy FFA
RoE
Deployment
LoPhy
Deployment
Scale Up
Funding /Planning for
FHG/CAS
Development for
FHG/CAS
Deployment for
FHG/CAS
Development for
O-DU/BBU
Deployment for
O-DU/BBU
Funding /Planning
for
O-DU/BBU
Continual support...................
PIZ
(LoPhy)
O-DU PIZ (Rel. 2)
(mmWave)
Optimize
Potentially: begin w/ Incumbent vendors’ O-BBU+disagg. SW, then transition to true mixed vendor
O-BBU + SW
O-CU PIZ
- 8.
Presentation title here—editon Slide Master
© 2019 AT&T Intellectual Property. All rights reserved. AT&T, Globe logo, Mobilizing Your World and DIRECTV are registered trademarks and service marks of AT&T Intellectual Property and/or
AT&T affiliated companies. All other marks are the property of their respective owners.
8
Scenario 1: dRAN/cRAN + mmW
RU
Round 2 - Scenarios Compared (2 & 3, 3-a as New)
Scenario 2: dRAN/cRAN + mmW AU Scenario 3 / 3-a: Class I O-
RAN pooling w/
incumbent BBU HW +
mmW AU / mmW RU
Circuit Switch (TDM) based Transport
FH Interface:
• LTE/5G Sub-6: CPRI;
• 5G mmWave: native eCPRI
mmW RU used
Scenario 4: O-RAN + mmW RU
xHaul: Packetized Transport Network
DU + CU containerized @ O-RAN class 2b poolin
FH Interface:
• FH_GW convert/aggregate CPRI to eCPRI for
• 5G mmWave: eCPRI native
xHaul: Packetized Transport Network
Incumbent vendors’ BBU @ class I pooling
3: mmW AU (integrated RU/DU) used
3-a: mmW RU used
Circuit Switch (TDM) based Transport
FH Interface:
• LTE/5G Sub-6: CPRI;
• 5G mmWave: native eCPRI
mmW AU (integrated RU/DU) used
New New
- 9.
Presentation title here—editon Slide Master
© 2019 AT&T Intellectual Property. All rights reserved. AT&T, Globe logo, Mobilizing Your World and DIRECTV are registered trademarks and service marks of AT&T Intellectual Property and/or
AT&T affiliated companies. All other marks are the property of their respective owners.
© 2019 AT&T Intellectual Property. All rights reserved. AT&T, Globe logo, Mobilizing Your World and DIRECTV are registered trademarks and service marks of AT&T Intellectual Property and/or
AT&T affiliated companies. All other marks are the property of their respective owners.
Appendix
…..
- 10.
Presentation title here—editon Slide Master
© 2019 AT&T Intellectual Property. All rights reserved. AT&T, Globe logo, Mobilizing Your World and DIRECTV are registered trademarks and service marks of AT&T Intellectual Property and/or
AT&T affiliated companies. All other marks are the property of their respective owners.
10
TCO Fiberwise Value (Preliminary)
TCO Cost: 7 year NPV starting year 2021
Cluster
O-BBU &
Pooling (LTE
disaggregated)
Transport Other total
ATL $13.2 M -$13.2 M -$10.7 M -$10.7 M
SF $32.9 M -$21.7 M -$15.7 M -$4.5 M
LV $19.6 M $40.9 M -$11.1 M $49.4 M
NYC $133.6 M $98.3 M -$46.1 M $185.8 M
Sum $199.3 M $104.3 M -$83.6 M $220.0 M
Fiberwise (IR)
-$47 M to -$35M
$12M Saved
Non-Fiberwise Assumptions:
Dark Fiber estimate per site is $47.0K per site (F1 + F2)
• (Shared) F1 Feeder portion estimate $22K per site
o Splice work, Cable reinforcement, etc…
• (Mobility) F2 Drop to site estimate $25K per site
o F2 drop has to be built
Mobility Optics
• Gray optics
o CRAN Radio / BBU Gray optics ($84 10G ea, $459 25G ea)
o FHG 100G uplinks Gray optics ($1500 100G ea)
Fiberwise Assumptions:
Dark Fiber estimate per site is $25.3K per site (F1 + F2)
• F1 Feeder portion estimate $5.3K (FW UC reduction 85%)
o SFCM placement in FAP, No additional Spice work, No cable
reinforcement
• F2 Drop to site estimate $25K per site
o F2 drop has to be built
Mobility Optics
• DWDM Color optics
o CRAN Radio / BBU DWDM (ST) optics (Incr RRU $616 10G,
$241 25G ea)
o FHG 100G uplinks DWDM optics ($2K 100G ea)
o Passive Mux (assume per wave channel $375 ($12/32 waves)
Not Fiberwise (IR)
26%
Net Avg Per Pico
Site FW Savings: ~$13K
Net Avg Per Macro
Site FW Savings: ~$16K
Note: Mobility Fiber 2018 estimates are based on the affiliate
license program. Estimates provided by Historical CFAS Project
Data (Cecil Lara)
TCO Cost: 7 year NPV starting year 2021
cluster
O-BBU &
Pooling (LTE
disaggregated)
Transport Other total
ATL $13.2 M -$18.5 M -$10.7 M -$15.9 M
SF $32.9 M -$28.7 M -$15.7 M -$11.5 M
LV $19.6 M $40.9 M -$11.1 M $49.4 M
NYC $133.6 M $98.3 M -$46.1 M $185.8 M
Sum $199.3 M $92.0 M -$83.6 M $207.7 M
- 11.
Presentation title here—editon Slide Master
© 2019 AT&T Intellectual Property. All rights reserved. AT&T, Globe logo, Mobilizing Your World and DIRECTV are registered trademarks and service marks of AT&T Intellectual Property and/or
AT&T affiliated companies. All other marks are the property of their respective owners.
11
Fiberwise Historical Data
CFAS Projects
(2019)
Fiber
Jobs Mobility (F2) Shared (F1)
$100 and $1K 3 $.0 M $.0 M
$1K and $5K 29 $.1 M $.0 M
$5K and $10K 106 $.4 M $.4 M
$10K and $25K 420 $3.4 M $3.6 M
$25K and $50K 272 $5.2 M $4.2 M
$50K and $75K 104 $3.8 M $2.5 M
$75K and $100K 33 $1.5 M $1.3 M
$100K and $500K 38 $2.5 M $3.1 M
> $1M 2 $1.0 M $1.9 M
Grand Total 1007 $17.9 M $17.0 M
76%Total Spend
$13.0 M
CFAS Projects (2019)
(F1)
Unit cost
(F2)
Unit Cost
Total
Unit Cost
$100 and $1K $0.3K $0.3K $0.6K
$1K and $5K $1.3K $2.1K $3.4K
$5K and $10K $3.8K $4.2K $8.1K
$10K and $25K $8.5K $8.1K $16.6K
$25K and $50K $15.5K $19.3K $34.8K
$50K and $75K $23.8K $36.3K $60.1K
$75K and $100K $38.4K $46.5K $84.8K
$100K and $500K $81.1K $65.7K $146.7K
> $1M $965.5K $483.0K $1,448.4K
Average Unit Cost $16.9K $17.8K $34.7K
Unit Cost
$60 K
Mobility
Note: Mobility Fiber 2018 estimates are based on the affiliate
license program. Estimates provided by Historical CFAS Project
Data (Cecil Lara)
PMO (IR)
Fiberwise (IR)
• Dedicated fibers (6 per Pico)
• No shared fiber asset
• Longer Time to market
• Builds on DaFi solution (F2 Fiber savings)
• F1 Fiber Savings (Splice, cable jobs)
• 85% less cost per unit
• Impacts 70% of the Mobility triggered
spend
Assumed
Averaged
Fiber Cost
$47 K
- 12.
Presentation title here—editon Slide Master
© 2019 AT&T Intellectual Property. All rights reserved. AT&T, Globe logo, Mobilizing Your World and DIRECTV are registered trademarks and service marks of AT&T Intellectual Property and/or
AT&T affiliated companies. All other marks are the property of their respective owners.
12
Overall:
• OOR markets (e.g.: NYC, LV) have significant saving
opportunities w/ O-RAN arch.
• Greater saving if LTE is also disaggregated ($20M more)
• Similar outcome is expected for other markets
RAN (BBU related):
• All markets have saving opportunities w/ O-RAN
architecture
• Higher the site density, greater the saving (NYC the
greatest)
Transport: (FHG, CAS)
• OOR has significant saving while IR markets have higher
cost
Others: (C&I, Services, NC, Utilities, maintenance, site Acq. Etc)
• Higher spending required to enable O-RAN vBBU, as expected
• Operational /Life cycle impact are not included
Results Summary (4 markets view)
7 year NPV Saving: O-RAN w/ both 5G and LTE virtualized
7 year NPV Saving: O-RAN w/ only 5G virtualized
Compared to Present Mode of Operation
Note: results assumes 2x cost multiplier for HUB cost on C&I and
Materials for macro site compared to current HUB cost for cRAN site.
TCO Cost: 7 year NPV starting year 2021
cluster
O-BBU & Pooling
(LTE
Disaggregated)
Transport Other total
ATL $13.2 M -$13.2 M -$10.7 M -$10.7 M
SF $32.9 M -$21.7 M -$15.7 M -$4.5 M
LV $19.6 M $40.9 M -$11.1 M $49.4 M
NYC $133.6 M $98.3 M -$46.1 M $185.8 M
Sum $199.3 M $104.3 M -$83.6 M $220.0 M
TCO Cost: 7 year NPV starting year 2021
cluster
O-BBU & Pooling
(LTE not
Disaggregated)
Transport Other total
ATL $18.3 M -$17.1 M -$11.6 M -$10.4 M
SF $40.4 M -$29.4 M -$16.6 M -$5.6 M
LV $21.1 M $44.0 M -$12.1 M $53.0 M
NYC $139.1 M $78.0 M -$49.2 M $167.9 M
Sum $218.8 M $75.5 M -$89.5 M $204.9 M
- 13.
Presentation title here—editon Slide Master
© 2019 AT&T Intellectual Property. All rights reserved. AT&T, Globe logo, Mobilizing Your World and DIRECTV are registered trademarks and service marks of AT&T Intellectual Property and/or
AT&T affiliated companies. All other marks are the property of their respective owners.
13
SW cost ~ $440M not accounted, default scenario: 2660 sites/39 hubs
TCO savings, 4 market scenario ($440 M SW charge not included) TCO savings extrapolation @ 16384 sites: expected savings > $350M
Network wide extrapolation @ 16384 cell sites, 240 Hubs
RAN (BBU related):
• All markets have saving opportunities w/ O-RAN architecture
• Higher the site density, greater the saving (NYC the greatest)
Transport: (FHG, CAS)
• OOR has significant saving while IR markets have higher cost
TCO Cost: 7 year NPV starting year 2021
cluster
O-BBU & Pooling (LTE
Disaggregated)
Transport Other total
ATL $13.2 M -$13.2 M -$10.7 M -$10.7 M
SF $32.9 M -$21.7 M -$15.7 M -$4.5 M
LV $19.6 M $40.9 M -$11.1 M $49.4 M
NYC $133.6 M $98.3 M -$46.1 M $185.8 M
Sum $199.3 M $104.3 M -$83.6 M $220.0 M
- 14.
Presentation title here—editon Slide Master
© 2019 AT&T Intellectual Property. All rights reserved. AT&T, Globe logo, Mobilizing Your World and DIRECTV are registered trademarks and service marks of AT&T Intellectual Property and/or
AT&T affiliated companies. All other marks are the property of their respective owners.
14
Cost saving reduces if OBBU Pivot is later:
(4 markets combined)
If start in 2021: $220M saving
If start in 2022: $193M saving $27M missed
If start in 2023: $113M saving $80M missed
$107M missed
(OOR market only: NYC, LV)
If start in 2021: $235M saving
If start in 2022: $208M saving $27M missed
If start in 2023: $144M saving $64M missed
$91M missed
Timing Sensitivity: Sooner we pull the trigger, higher is saving
Sooner we pivot, Greater the saving: 2021 ideal, 2022 latest.
TCO Cost: 7 year NPV starting year 2021
cluster
O-BBU & Pooling
(LTE
Disaggregated)
Transport Other total
ATL $13.2 M -$13.2 M -$10.7 M -$10.7 M
SF $32.9 M -$21.7 M -$15.7 M -$4.5 M
LV $19.6 M $40.9 M -$11.1 M $49.4 M
NYC $133.6 M $98.3 M -$46.1 M $185.8 M
Sum $199.3 M $104.3 M -$83.6 M $220.0 M
TCO Cost: 7 year NPV starting year 2022
cluster
O-BBU & Pooling
(LTE
Disaggregated)
Transport Other total
ATL $13.5 M -$14.2 M -$10.5 M -$11.1 M
SF $34.4 M -$23.8 M -$15.4 M -$4.8 M
LV $19.7 M $37.0 M -$10.7 M $46.0 M
NYC $136.0 M $70.4 M -$44.1 M $162.3 M
Sum $203.7 M $69.4 M -$80.6 M $192.5 M
TCO Cost: 7 year NPV starting year 2023
cluster
O-BBU & Pooling
(LTE
Disaggregated)
Transport Other total
ATL $14.1 M -$14.9 M -$16.2 M -$17.0 M
SF $35.2 M -$25.6 M -$23.8 M -$14.2 M
LV $19.9 M $34.0 M -$17.2 M $36.8 M
NYC $135.9 M $46.9 M -$75.7 M $107.1 M
Sum $205.1 M $40.4 M -$132.9 M $112.6 M
- 15.
Presentation title here—editon Slide Master
© 2019 AT&T Intellectual Property. All rights reserved. AT&T, Globe logo, Mobilizing Your World and DIRECTV are registered trademarks and service marks of AT&T Intellectual Property and/or
AT&T affiliated companies. All other marks are the property of their respective owners.
15
RAN SW Cost:
vendor support for O-RAN SW and
integration w/ O-BBU platform
(assuming 40~50% incremental cost on annual
SWBO)
TechDev & EMS Cost
• Internal IT cost to support O-BBU,
FHG/CAS platform
• Expect O-BBU/FHG/CAS are ECOMP/O-RAN
compliant, to minimize OSS cost and avoid
using supplier’s EMS
National Level Cost: shared among ALL markets per vendor
LTE not disaggregated/aggregated
o-BBU
FHG/CAS
$310 M / $400 M
o-BBU
$34.6 M
$12.4 M
- 16.
Presentation title here—editon Slide Master
© 2019 AT&T Intellectual Property. All rights reserved. AT&T, Globe logo, Mobilizing Your World and DIRECTV are registered trademarks and service marks of AT&T Intellectual Property and/or
AT&T affiliated companies. All other marks are the property of their respective owners.
16
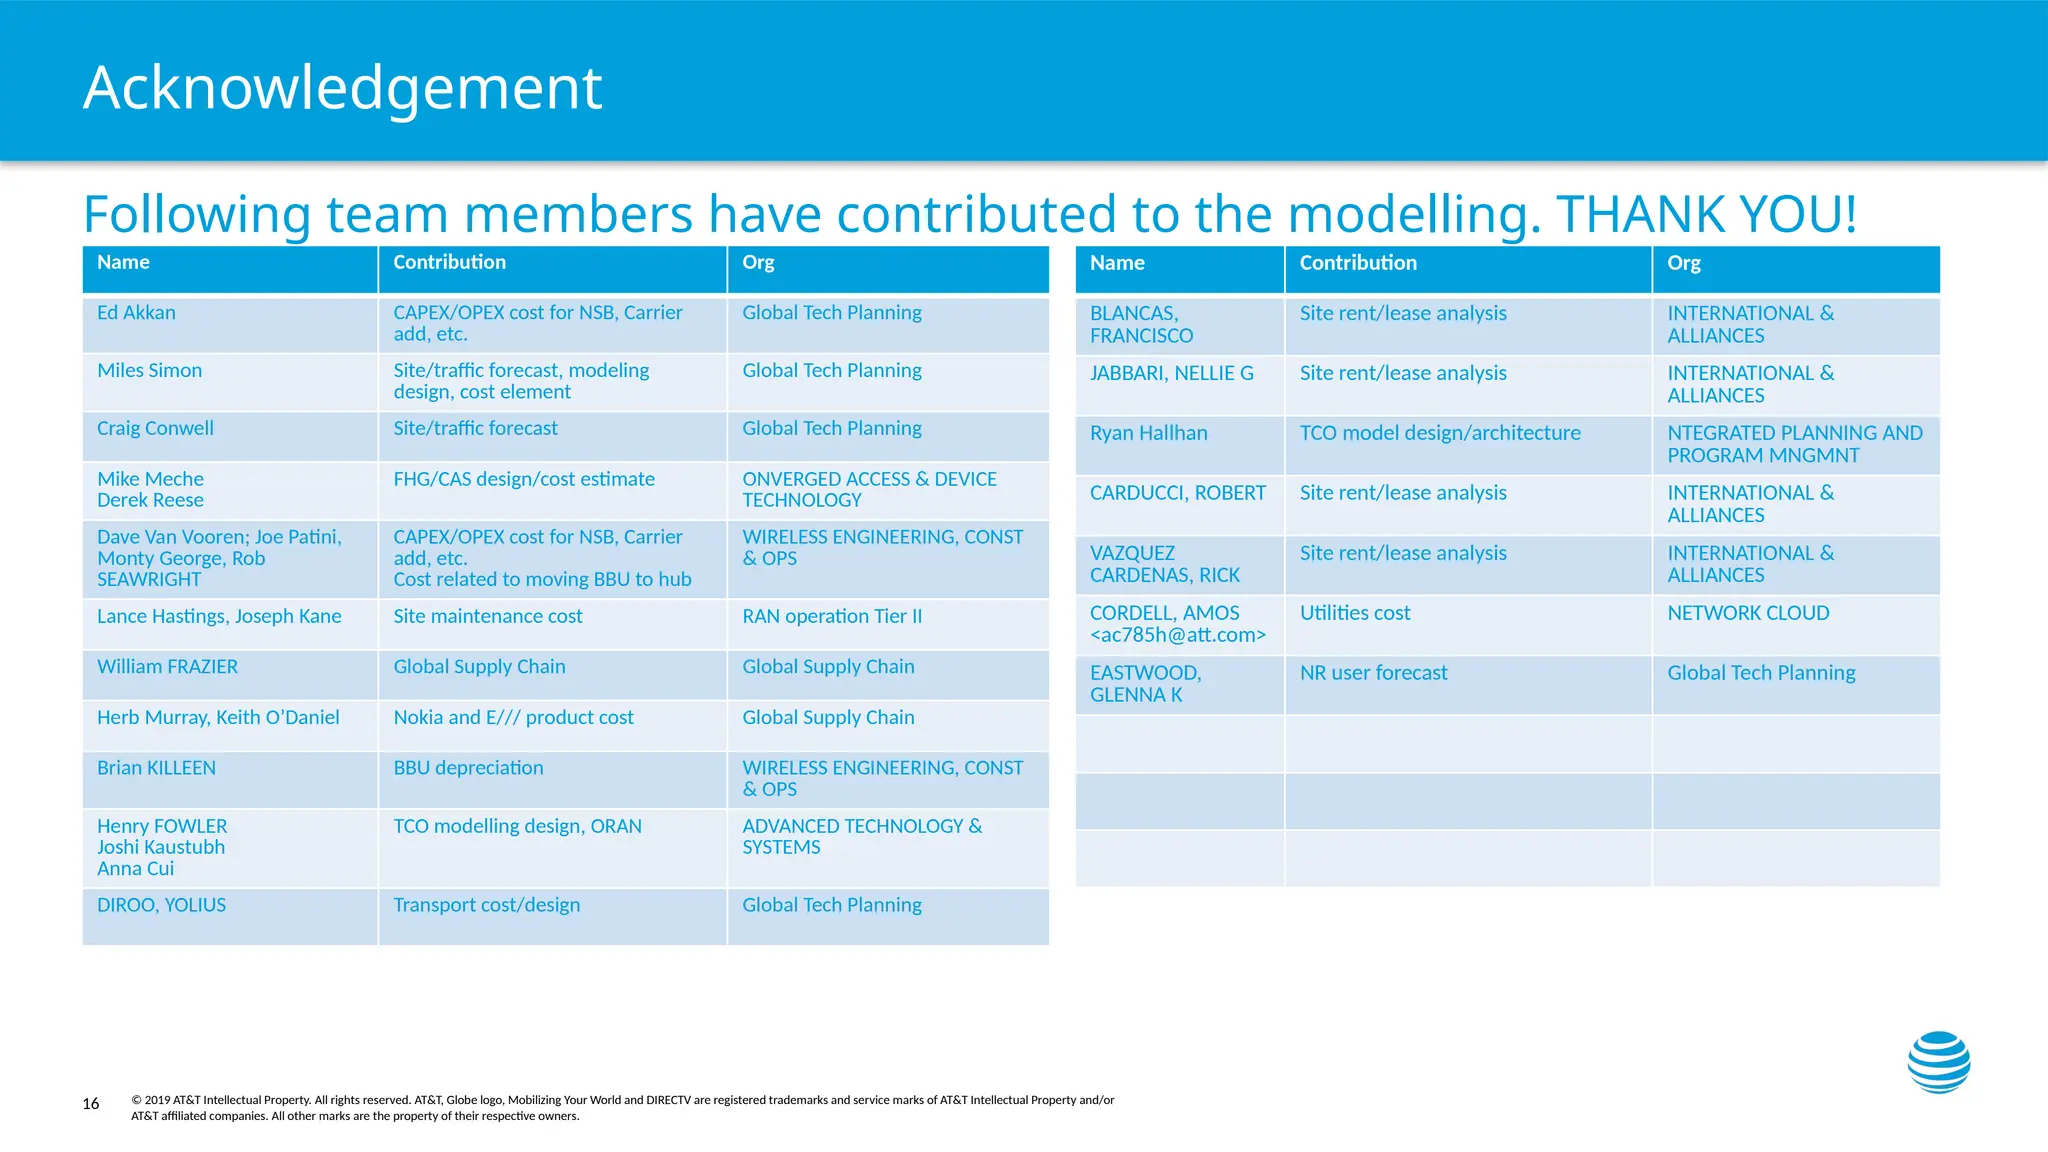
Following team members have contributed to the modelling. THANK YOU!
Acknowledgement
Name Contribution Org
Ed Akkan CAPEX/OPEX cost for NSB, Carrier
add, etc.
Global Tech Planning
Miles Simon Site/traffic forecast, modeling
design, cost element
Global Tech Planning
Craig Conwell Site/traffic forecast Global Tech Planning
Mike Meche
Derek Reese
FHG/CAS design/cost estimate ONVERGED ACCESS & DEVICE
TECHNOLOGY
Dave Van Vooren; Joe Patini,
Monty George, Rob
SEAWRIGHT
CAPEX/OPEX cost for NSB, Carrier
add, etc.
Cost related to moving BBU to hub
WIRELESS ENGINEERING, CONST
& OPS
Lance Hastings, Joseph Kane Site maintenance cost RAN operation Tier II
William FRAZIER Global Supply Chain Global Supply Chain
Herb Murray, Keith O’Daniel Nokia and E/// product cost Global Supply Chain
Brian KILLEEN BBU depreciation WIRELESS ENGINEERING, CONST
& OPS
Henry FOWLER
Joshi Kaustubh
Anna Cui
TCO modelling design, ORAN ADVANCED TECHNOLOGY &
SYSTEMS
DIROO, YOLIUS Transport cost/design Global Tech Planning
Name Contribution Org
BLANCAS,
FRANCISCO
Site rent/lease analysis INTERNATIONAL &
ALLIANCES
JABBARI, NELLIE G Site rent/lease analysis INTERNATIONAL &
ALLIANCES
Ryan Hallhan TCO model design/architecture NTEGRATED PLANNING AND
PROGRAM MNGMNT
CARDUCCI, ROBERT Site rent/lease analysis INTERNATIONAL &
ALLIANCES
VAZQUEZ
CARDENAS, RICK
Site rent/lease analysis INTERNATIONAL &
ALLIANCES
CORDELL, AMOS
<ac785h@att.com>
Utilities cost NETWORK CLOUD
EASTWOOD,
GLENNA K
NR user forecast Global Tech Planning
- 17.
Presentation title here—editon Slide Master
© 2019 AT&T Intellectual Property. All rights reserved. AT&T, Globe logo, Mobilizing Your World and DIRECTV are registered trademarks and service marks of AT&T Intellectual Property and/or
AT&T affiliated companies. All other marks are the property of their respective owners.
17
Objective: compare TCO on Present & Target Architecture
• Compare and Contrast BAU (Present) and O-RAN (target) mode
of operation
• Understand the difference of
• In-region vs Out-of-Region
• LTE-disaggregated and LTE-Not-disaggregated
WHY?
Potentially lower Cost in long term
due to:
• BBU Pooling gain
• Avoid costly BBU replacement
• Transport cost reduction w/
FHG/CAS
Introduce Open RAN competition and
reduce dependency on incumbent
vendors
Target architecture is:
Disaggregated, Containerized RAN SW running
on Centralized, O-RAN compliant,
non-proprietary and pooled Hardware
- 18.
Presentation title here—editon Slide Master
© 2019 AT&T Intellectual Property. All rights reserved. AT&T, Globe logo, Mobilizing Your World and DIRECTV are registered trademarks and service marks of AT&T Intellectual Property and/or
AT&T affiliated companies. All other marks are the property of their respective owners.
18
7 year NPV based
4 Markets: In-region: ATL, SF; Out-of-Region: NYC, LV
Urban and Dense urban sites (meet Fronthaul latency restriction)
LTE touched: LTE need to be collocated with 5G sub6 BBU to support Dynamic
Spectrum Sharing
Scope of Work
ATL NYC LV SF
CAPEX: material, radio, C&I, Site Acq.,
BBU/BBU upgrade, Services, Transport,
Network Cloud, RAN SW, TechDec
OPEX: Lease/Rent, Utilities, Transport,
Maintenance, RAN SW, BBU upgrade;
anything removed from site
319 cell sites, 7 hubs
46 average sites per hub
1536 cell sites, 12 hubs
128 average sites per hub
389 cell sites, 8 hubs
48 average sites per hub
420 cell sites, 7 hubs
53 average cells per hub
- 19.
Presentation title here—editon Slide Master
© 2019 AT&T Intellectual Property. All rights reserved. AT&T, Globe logo, Mobilizing Your World and DIRECTV are registered trademarks and service marks of AT&T Intellectual Property and/or
AT&T affiliated companies. All other marks are the property of their respective owners.
19
Scenarios
1 2 3A (LNV) 3B (LV) 4A (LNV) 4B (LV)
Macro Site dRAN, BBU at cell site w/ backhual same as 1 Whitebox (WB) DU at HUB Whitebox (WB) DU at HUB
Smallcell BBU at cRAN HUB w/ fronthaul same as 1 Whitebox (WB) DU at HUB Whitebox (WB) DU at HUB
Sub6 FH CPRI CPRI converted to eCPRI w/ FHG converted to eCPRI w/ FHG
mmW FH eCPRI eCPRI eCPRI eCPRI
virtual LTE NO NO NO YES, vCU at NC (MTSO) NO YES. vCU in vBBU at HUB
virtual 5G NO YES YES YES, vCU at NC (MTSO) YES YES. vCU in vBBU at HUB
Main focus is the Comparison of the scenario 1 and 4A&4B
- 20.
Presentation title here—editon Slide Master
© 2019 AT&T Intellectual Property. All rights reserved. AT&T, Globe logo, Mobilizing Your World and DIRECTV are registered trademarks and service marks of AT&T Intellectual Property and/or
AT&T affiliated companies. All other marks are the property of their respective owners.
20
O-RAN v0-DU platform supports Load balancing Optimization, load sharing
Traffic per TRP: a R.V. with generalized
gamma distribution, μ<< peak value
vo-DU a flow switching pooling capable
Node
oDU node abstracted model
• The traffic profiles for Macro, Micro,
DAS and indoor layers have distinct σ
(standard deviation) and μ (mean
value)
• oDU N TRPs access K DSP tiles
• Research ongoing to address flow
relocation / “failover”
CAS family
LLS_DU accelerator 1
vCU + UP Anchor + Crypto
LLS_DU accelerator L
gNB 1
gNB N
Packet
FH, TSN
64 x 100 Gbps Ethernet Switch
Packet
backhaul
DSP array 1, 1600
Mhz
DSP array K, 1600
Mhz
DSP ...
CM+Ethernet Switch
Load
Balancer
Load
Balancer
GPP1 GPP
NPU
CM+Ethernet Switch
UP
anchor
&
Crypt
o
UP
anchor
&
Crypt
o
DSP array 1, 1600
Mhz
DSP array K, 1600
Mhz
DSP ...
CM+Ethernet Switch
Load
Balancer
Load
Balancer
gNB 96
gNB
• AKRAINO SW stream
• POD baseline
• Dual TOR flow switching optimized
• (M+1) GPP/GPU servers, NvRAM
SSD memory
• K Acceleration blades “DSP array label”
may comprise DSPs, FPGAs, ASICs
INDOOR
DSP
array
PHY MAC/RLC CU_CP CU_UP
Layer PRB_LOAD
Scheduler
Load
RRC_CU PPS
Reference 100% 100% 256 16384
MACRO 40% 50% 64 2560
CRAN 15% 20% 16 768
DAS 30% 40% 48 1280
INDOOR 10% 15% 16 768
How?
Needs updating
- 21.
Presentation title here—editon Slide Master
© 2019 AT&T Intellectual Property. All rights reserved. AT&T, Globe logo, Mobilizing Your World and DIRECTV are registered trademarks and service marks of AT&T Intellectual Property and/or
AT&T affiliated companies. All other marks are the property of their respective owners.
© 2019 AT&T Intellectual Property. All rights reserved. AT&T, Globe logo, Mobilizing Your World and DIRECTV are registered trademarks and service marks of AT&T Intellectual Property and/or
AT&T affiliated companies. All other marks are the property of their respective owners.
21
vo-DU, o-RAN
compliant DU,
Akraino Stream
Vo-DU a pooling capable Node: a heterogeneous HPC/high reliability /real
time node
S/W
H/W Cloud stack (containers/VMs), OS, cloud m-plane
O-CU O-DU O-RU
Centralized CU/DU
(C-RAN)
CU/DU split Distributed
CU/DU
(D-RAN)
Blackbox
BBU
Multitude of deployment
models: CloudRAN,
CU-DU split,
dRAN on whitebox or DC
All RAN modules
Acceleration abstraction layer
Flexible
Orch.
Inventory,
Discovery,
Registration
Policy,
Metrics
Support 10,000s
of distributed
cloud sites
Multitude of silicon
accelerators
Common LCM
mechanisms
across VNF &
PNFs
Cloudification
Orchestration
- 22.
Presentation title here—editon Slide Master
© 2019 AT&T Intellectual Property. All rights reserved. AT&T, Globe logo, Mobilizing Your World and DIRECTV are registered trademarks and service marks of AT&T Intellectual Property and/or
AT&T affiliated companies. All other marks are the property of their respective owners.
22
TCO Polygon Area - Example
New York City
Core
Non-Core
Core
Non-Core
Atlanta
• Polygons were computed based on a Matlab program
• Core polygons sites closer together (Dense Urban)
• Non-Core polygons sites are more spread out (Urban)
• IR Existing Hubs in ATL are Telco COs, MTSOs
• OOR Existing Hubs In NYC are Macro Sites and MTSOs
• OOR Telco COs are explored as Candidates Hubs
2,693 10,323
Polygon
Core
Macros
per hub
Hubs Core Pico
to Macro
Non-Core
Macro
per hub
Non-Core
Hubs
Non-Core
Pico to
Macro
Total
Macros
Total
Picos
Atlanta 60 1 4 48 6 2 348 816
San Fran 132 1 7 96 3 3 420 1788
New York 256 2 7 128 10 3 1536 6656
Las Vegas 95 1 5 42 7 2 389 1063
(4) Markets Polygon Assumptions
Model Assumptions still under review with FNP
Existing Hubs
Telco COs
Possible
New Hubs
- 23.
Presentation title here—editon Slide Master
© 2019 AT&T Intellectual Property. All rights reserved. AT&T, Globe logo, Mobilizing Your World and DIRECTV are registered trademarks and service marks of AT&T Intellectual Property and/or
AT&T affiliated companies. All other marks are the property of their respective owners.
FHG and CAS: RoE/Low PHY
LTE
NR NR
LTE
NR NR
Tower HUB
RoE (Radio over Ethernet)
• CPRI over ethernet using 1914.3 standard
• Tunneling Mode
• Line Code Aware
• Structure Aware
Low Phy in FHG
• Convert CPIR to eCPRI
• Functional 7.2x split from O-RAN Standard
Tower HUB
ROE
TSN
Ethernet
5G BBU
CPRI
eCPRI
5G BBU
5G BBU
5G BBU
5G BBU
4G BBU
ROE
TSN
FHG WB
FHG WB
CAS WB
LPHY
TSN
Ethernet
TSN
FHG WB
FHG WB
CAS WB
TSN
5G BBU
5G BBU
vDU
CPRI
eCPRI
eCPRI
CPRI
eCPRI
- 24.
Presentation title here—editon Slide Master
© 2019 AT&T Intellectual Property. All rights reserved. AT&T, Globe logo, Mobilizing Your World and DIRECTV are registered trademarks and service marks of AT&T Intellectual Property and/or
AT&T affiliated companies. All other marks are the property of their respective owners.
24
AT&T CAS Solution with RoE
CAS Cellsite (ROE)
CAS Aggregation
CAS Distribution (ROE/L-PHY)
Macro/Micro Cellsite
CRAN HUB/CO
mmW
LTE
LTE
mmW
LTE
LTE
mmW
LTE
LTE
Macro1 Macro2 Macro3
mmW
LTE
LTE
mmW
LTE
LTE
mmW
LTE
LTE
Macro4 Macro5 Macro6
mmW
LTE
LTE
mmW
LTE
LTE
mmW
LTE
LTE
Macro7 Macro8 Macro9
BBU
BBU
BBU
BBU
BBU
BBU BBU
BBU
BBU
BBU
BBU
BBU
Ethernet
Dark Fiber
SIAD/MSN
CAS(RoE/LPHY)
CAS(RoE/LPHY)
CAS(RoE/LPHY)
CAS(RoE/LPHY)
CAS(RoE/LPHY)
CAS(RoE/LPHY)
CAS(RoE/LPHY)
CAS(RoE/LPHY)
CAS(RoE/LPHY)
CAS(RoE/LPHY)
CAS(RoE/LPHY)
CAS(RoE/LPHY)
CAS CAS CAS CAS CAS CAS CAS CAS CAS
CAS CAS CAS CAS CAS CAS CAS CAS CAS
vDU
vDU
vDU
vDU
vDU
Pending update from Mike M.
- 25.
Presentation title here—editon Slide Master
© 2019 AT&T Intellectual Property. All rights reserved. AT&T, Globe logo, Mobilizing Your World and DIRECTV are registered trademarks and service marks of AT&T Intellectual Property and/or
AT&T affiliated companies. All other marks are the property of their respective owners.
25
FHG Transport Architecture
- 26.
Presentation title here—editon Slide Master
© 2019 AT&T Intellectual Property. All rights reserved. AT&T, Globe logo, Mobilizing Your World and DIRECTV are registered trademarks and service marks of AT&T Intellectual Property and/or
AT&T affiliated companies. All other marks are the property of their respective owners.
26
FHG/CAS Timeline
- 27.
Presentation title here—editon Slide Master
© 2019 AT&T Intellectual Property. All rights reserved. AT&T, Globe logo, Mobilizing Your World and DIRECTV are registered trademarks and service marks of AT&T Intellectual Property and/or
AT&T affiliated companies. All other marks are the property of their respective owners.
27
Transport Assumptions
Capital Data Views:
• SIAD Types, cost, and logic are normalized across IR and
OOR averages.
• Data are rolled up into a market level view
• CapEx (one time cost) and Opex (reoccurring monthly
cost) are considered
• Output is based on RAN configuration and BBU capacity
modeled.
High Level Assumptions:
Cost:
• Existing HW (i.e. SIADs, DaFi..) -
Based on collaboration with FNP
• New HW (i.e. FHG/CAS, vDU..) –
Based on equivalent solutions
and Vendor quotes
Deployment:
• Existing HW based on current
PMO deployment strategies.
• New HW based Target
Architecture (i.e. aggregation
Hierarchy, solution density,
technology strategy)
Hardware:
In region:
• Ethernet Backhaul based on
deployment cost and Long
Range Incremental Cost (LRIC)
“Real Green $$”
• Fiber based on AT&T Fiber
License estimates and calculated
LRIC
Out of Region:
• Ethernet Backhaul based on 3rd
party telco averaged pricing data
from NAM
• Fiber based on 3rd
party
averaged pricing data from NAM
Transport Cost:
Base Line
• PMO - dRAN for Macro and cRAN
for Pico
• Macro SIAD upgrade triggered
by mmW
• Macro Transport is 1Gbps
Target Architecture
• FMO – Macro and Pico are cRAN
(Fronthaul)
• xHaul fronthaul solution
comparison include Fronthaul
Gateway (FHG), DWDM, Fiber,
virtualized and Non Virtualized
BBU/DU
Solution Comparison
• Maximum OpEx savings with least amount of Capital
spend
• Leverage fiber wise strategies (IR) for least amount of
OSP Impact
• Leverage resource sharing (i.e. Backhaul, HW etc.) to
optimize cost
Analysis Strategy:
- 28.
Presentation title here—editon Slide Master
© 2019 AT&T Intellectual Property. All rights reserved. AT&T, Globe logo, Mobilizing Your World and DIRECTV are registered trademarks and service marks of AT&T Intellectual Property and/or
AT&T affiliated companies. All other marks are the property of their respective owners.
28
Transport OOR OpEx Savings Example
SIAD
SIAD
SIAD
MTSO
CO
MSN
CO
CO
Ethernet
BBU
BBU
BBU
RRU
RRU
RRU
1Gbps
Hub
SIAD
BBU
BBU
BBU
MTSO
MSN
CO
CO
Ethernet
RRU
RRU
RRU
FH Fiber
2Gbps
Hub
SIAD
MTSO
MSN
CO
CO
Ethernet
RRU
RRU
RRU
1Gbps
vDU
POD
dRAN
3x 1G BH = $9K per month
12 Mth * $9K = $108K per year
cRAN BBU Hub
3x fiber FH = $250 per month
12 Mth * $250 = $3K per year
1x 2G BH = $5K per month
12 Mth * $5K = $60K per year
FH $3K + BH $60K = $63K per year
O-RAN vDU Hub
3x fiber FH = $250 per month
12 Mth * $250 = $3K per year
1x 1G BH = $3K per month
12 Mth * $3K = $36K per year
FH $3K + BH $36K = $39K per year
Distributed Ran (dRAN)
• Point to Point architecture
• Back Haul to each site
• BBU and SIAD at each site
Centralized RAN (cRAN)
• Point to Point architecture
• Shared Back Haul at Hub
• Shared SIAD at Hub
• $45K per year OpEx savings
• 42% OpEx reduction
Open RAN (O-RAN)
• Point to Point architecture
• Shared Back Haul at Hub
• Shared BBU and SIAD at Hub
• $72K per year OpEx savings
• 64% OpEx reduction
Backhaul
Backhaul
Fronthaul
FH Fiber
FH Fiber
1Gbps
1Gbps
FH Fiber
FH Fiber
FH Fiber
Backhaul
Fronthaul
Share SIAD and
Backhaul
Share DU, SIAD
and Backhaul
- 29.
Presentation title here—editon Slide Master
© 2019 AT&T Intellectual Property. All rights reserved. AT&T, Globe logo, Mobilizing Your World and DIRECTV are registered trademarks and service marks of AT&T Intellectual Property and/or
AT&T affiliated companies. All other marks are the property of their respective owners.
29
Gray vs Green $$: Explained
$100 LRIC
AT&T Mobility
Pays: MRC
AT&T Telco
Transport
(Service)
Transport Up
speed (Service)
AT&T Bank
Suppliers,
Labor, Tax,
Maint…
$1K Capex
$23K Capex
Cost of
Business
Gray Dollars
Inter Org Transfer
$2K MRC
AT&T Mobility
Pays: MRC
OOR Telco
Transport
(Service)
Transport Up
speed (Service)
AT&T Bank
Green Dollars
$10K MRC
Capex $0
(included in MRC)
In Region (IR) Out of Region (OOR)
Upgrade Upgrade
Budget
Budget
Expense Expense
Revenue less
(Cost of Business)
OOR Telco
LRIC – Long Term Incremental Cost
MRC – Monthly Reoccurring Cost
Editor's Notes
- #8 Target architecture : Disaggregated, Containerized RAN SW running on Centralized, O-RAN compliant, Non-proprietary, and Pooled hardware