Download as PDF, PPTX


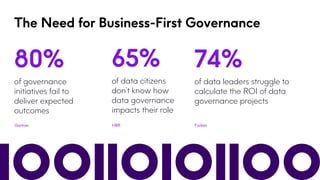
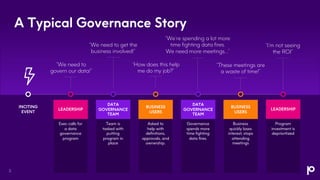


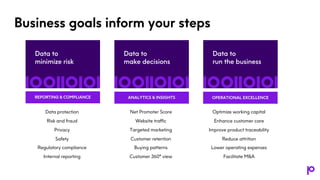
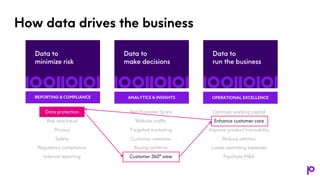
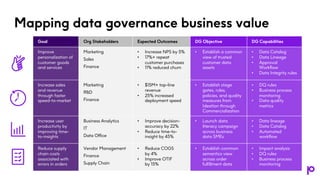
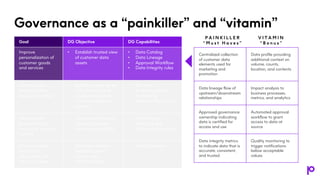

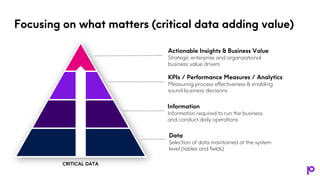
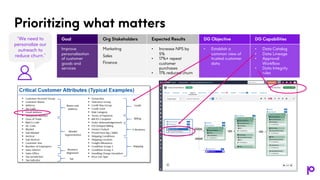

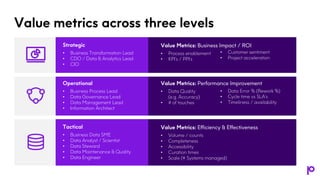
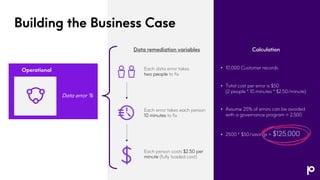
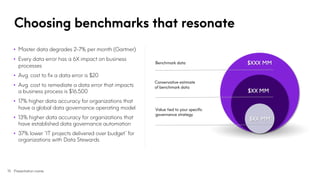
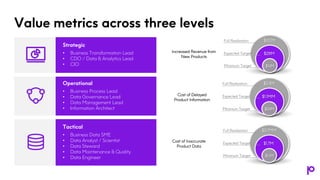
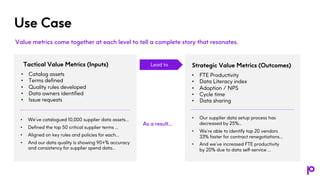
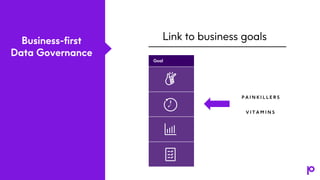
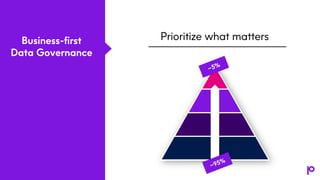
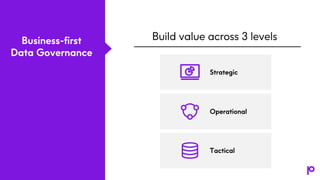


The document discusses the importance of a business-first approach to data governance, highlighting that 65% of data citizens are unaware of its impact on their roles and 80% of governance initiatives fail to meet expectations. It emphasizes linking data governance to business value drivers, enhancing organizational performance through improved data management, and prioritizing critical data to achieve measurable outcomes. Successful governance programs focus on metrics at strategic, operational, and tactical levels to demonstrate the ROI of data governance initiatives.


![제 23회 보아즈(BOAZ) 빅데이터 컨퍼런스 - [MBOAX] : ABSA를 활용한 소비자 반응 분석 기반 운영 효율화 대시보드 설계](https://cdn.slidesharecdn.com/ss_thumbnails/3-1boaz23rdconferencemboax-260203102709-9d519923-thumbnail.jpg?width=640&height=640&fit=bounds)
![7.__Developing_a_Research_Proposal[1].pptx](https://cdn.slidesharecdn.com/ss_thumbnails/7-260131073037-df92dd7d-thumbnail.jpg?width=640&height=640&fit=bounds)


![Hacking-Uncovered-How-People-Get-Hacked-and-How-to-Stay-Safe[1].pptx](https://cdn.slidesharecdn.com/ss_thumbnails/hacking-uncovered-how-people-get-hacked-and-how-to-stay-safe1-260130170011-4883a9c7-thumbnail.jpg?width=640&height=640&fit=bounds)


