SlideShare a Scribd company logo
1 of 81
Download to read offline
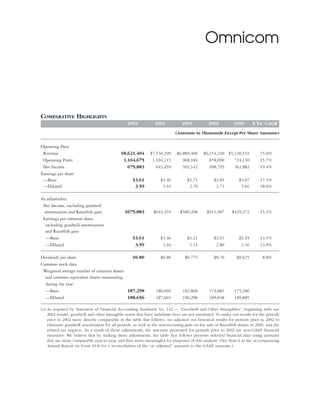
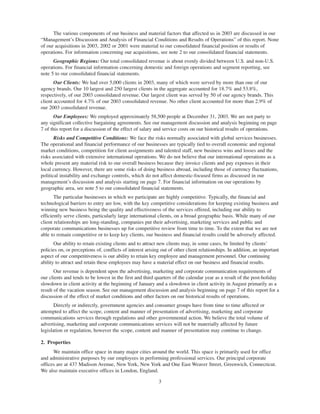
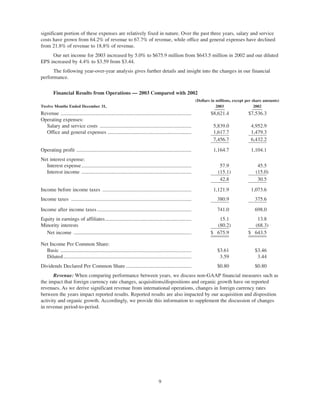
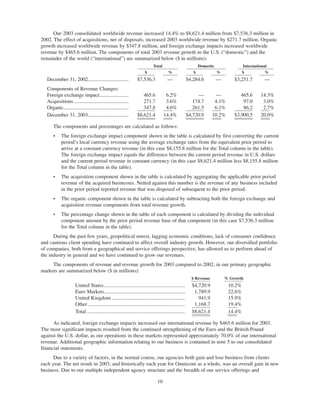
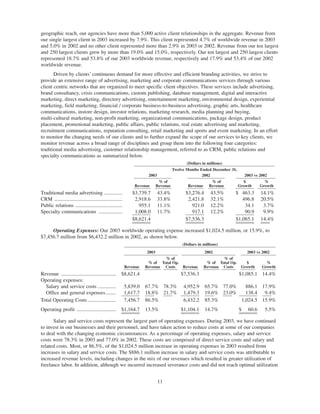
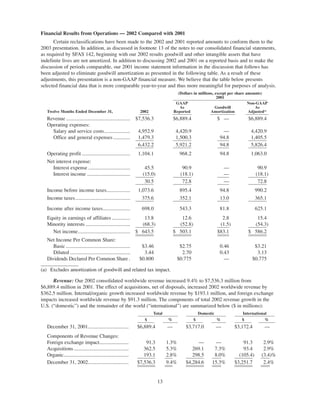
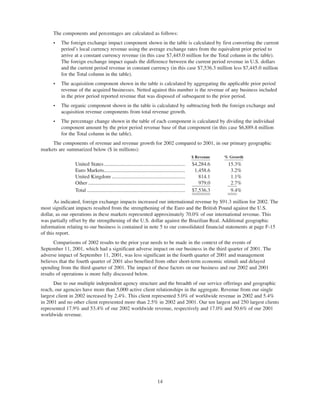
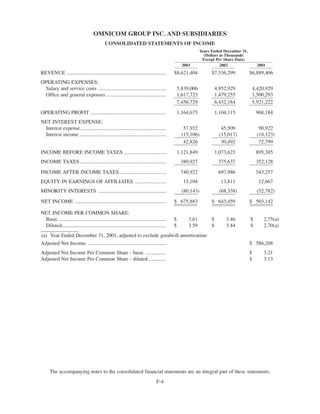
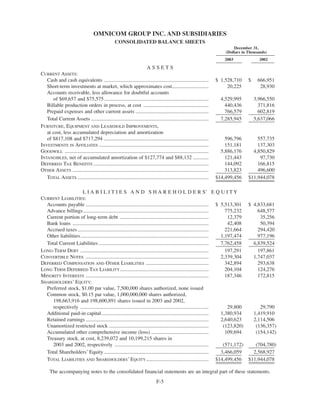
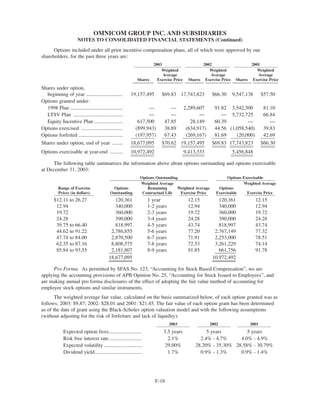
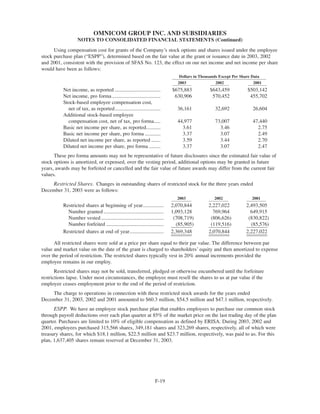
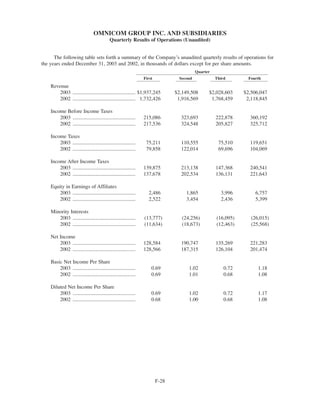
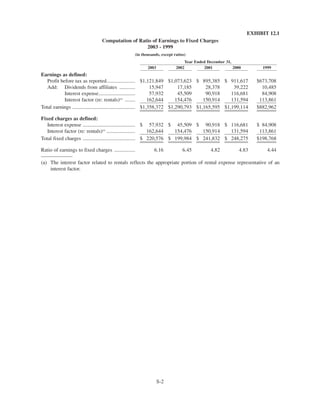
Omnicom


 ANNUAL   REPORT


2003
Omnicom


COMPARATIVE HIGHLIGHTS
                                                 2003           2002            2001           2000           1999       5 YR. CAGR

                                                                            (Amounts in Thousands Except Per Share Amounts)


Operating Data
                                             $8,621,404
 Revenue                                                      $7,536,299     $6,889,406     $6,154,230 $5,130,545            15.0%
                                              1,164,675
 Operating Profit                                              1,104,115        968,184        878,090    724,130            15.7%
                                                675,883
 Net Income                                                      643,459        503,142        498,795    362,882            19.4%
Earnings per share
                                                    $3.61
 —Basic                                                             $3.46          $2.75          $2.85          $2.07       17.5%
                                                     3.59
 —Diluted                                                            3.44           2.70           2.73           2.01       18.0%

As adjusted(a):
 Net Income, excluding goodwill
                                               $675,883
 amortization and Razorfish gain                                $643,459       $586,208       $511,487       $429,372        15.2%
 Earnings per common share,
  excluding goodwill amortization
  and Razorfish gain
                                                    $3.61
  —Basic                                                            $3.46          $3.21          $2.93          $2.45       13.5%
                                                     3.59
  —Diluted                                                           3.44           3.13           2.80           2.36       13.9%

                                             $0.80
Dividends per share                                                 $0.80         $0.775          $0.70        $0.625         8.8%
Common stock data
 Weighted average number of common shares
  and common equivalent shares outstanding
  during the year
                                           187,258
  —Basic                                                         186,094        182,868         174,881       175,286
                                           188,656
  —Diluted                                                       187,603        190,290         189,038       189,885

(a) As required by Statement of Financial Accounting Standards No. 142 — “Goodwill and Other Intangibles”, beginning with our
    2002 results, goodwill and other intangible assets that have indefinite lives are not amortized. To make our results for the periods
    prior to 2002 more directly comparable in the table that follows, we adjusted our historical results for periods prior to 2002 to
    eliminate goodwill amortization for all periods, as well as the non-recurring gain on the sale of Razorfish shares in 2000, and the
    related tax impacts. As a result of these adjustments, the amounts presented for periods prior to 2002 are non-GAAP financial
    measures. We believe that by making these adjustments, the table that follows presents selected financial data using amounts
    that are more comparable year-to-year and thus more meaningful for purposes of this analysis. (See Item 6 in the accompanying
    Annual Report on Form 10-K for a reconciliation of the “as adjusted” amounts to the GAAP amounts.)
Letter from the President


Dear Fellow Shareholders

Omnicom’s strategy of seeking consistent returns from a diversified
portfolio of businesses proved its value for shareholders again in
2003. Many things done very well by a great many employees
enabled us to record our seventeenth consecutive year of increased
revenues and earnings.

The significance of this accomplishment is underscored by the fact
that 2003 was not simply a tough year. It was the third consecutive
year of difficult and often uneven economic conditions for the
global advertising and marketing industries. Our people made the
necessary decisions to align their staffing and facilities with
sustainable levels of business. They worked with us to minimize
increases in operating expenses. And they never faltered in their
commitment to creative excellence, which enabled our agencies to
win more than $4 billion in net new business as well as the leading
share of the world’s most prestigious creative awards.

Solid financial performance
Omnicom recorded $8.6 billion in worldwide revenues in 2003, a
14 percent increase from $7.5 billion in 2002. Domestic revenue
increased 10 percent to $4.7 billion, while international revenues
rose 20 percent to $3.9 billion. The major portion of the increase in
international revenues was due to foreign exchange translation,
which benefited us for the first time in recent memory. Excluding
foreign exchange gains, revenues from international markets
advanced 6 percent.

All disciplines contributed to revenue growth in 2003. Traditional
media advertising, which accounted for 43 percent of total revenues,
grew 14 percent. Customer relationship management (CRM)
disciplines experienced a strong renewal in client spending on brand
building, advancing more than 20 percent. Revenues from specialty
communications rose 10 percent. Our public relations businesses,
buoyed by a resurgence in financial services assignments and new
product introductions, contributed a 4 percent increase in revenues
compared to a 6 percent decline in the prior year.
Letter from the President


Net income was $675.9 million in 2003, a 5 percent increase from
the $643.5 million earned in 2002. Diluted earnings per share for
2003 rose 4 percent to $3.59 compared to $3.44 in the prior year.
Operating margins decreased 1.2 percent to 13.5 percent in 2003.
The margin decline resulted primarily from changes in the mix of
Omnicom’s business, increased severance costs and less-than-
optimal utilization rates across our networks. We believe our
networks have done a good job of offsetting investments required
to build revenues with ongoing efforts to align permanent staffing
and facilities with current work levels. This was especially true in
Europe during 2003. Though severance costs are now mostly
behind us, our efforts to control operating expenses remain a key
priority in all locations.

Given the continuing strength in the Company’s financial
performance, in February 2004 the Board raised the annual dividend
to $0.90 per share from $0.80 per share. The increase began with
the first-quarter dividend of 2004.

From our clients’ perspective
A fundamental premise of Omnicom’s business is that clients’
objectives should be the central focus in how we structure our
business. Our agencies may operate under different disciplines –
traditional advertising, marketing communications, public relations
or media buying, for example – but we organize our services to
clients across those lines. We can bring together any marketing skill
to create a customized, multi-disciplinary matrix of expertise capable
of delivering consistent brand messages in virtually any market in
the world, and do so in a way that is transparent to the client. This
is a significant advantage for clients wanting greater efficiency and
effectiveness from their marketing dollars.

It is also a distinctive competitive advantage for Omnicom. We have
a balanced complement of top-quality agencies in each marketing
discipline in all major markets. We believe this to be a key factor in
our net new business wins, which totaled $4.1 billion in 2003 and
an impressive $12.7 billion over the past three years.
Letter from the President


Omnicom’s fundamental strategy is to seek consistent returns from
a diversified portfolio of businesses linked through our largest
clients. While every client relationship is important to us, one of
Omnicom’s primary objectives is to serve more of the needs of our
largest clients. In 2003, as in 2002, revenues from our top 250
clients increased by more than 15 percent, outpacing total revenue
gains in both years. These clients now account for over half of
worldwide revenues. We have said this before and it bears
repeating: broadening our business with our largest clients by
expanding the Company’s service capabilities and geographic reach
creates overlapping client relationships among our agencies that not
only strengthens revenues but also adds stability to Omnicom’s
financial performance.

Large client or small, creative excellence – backed by service
quality and measurable results – must be the defining characteristic
of the relationship between agencies and their clients. Our
networks again demonstrated their creative leadership in 2003.
For the second consecutive year, and the third time in four years,
BBDO Worldwide was the most recognized agency network in the
world according to the annual Gunn Report on global advertising
awards. TBWA Worldwide took second place on the Gunn list, with
an unprecedented three agencies among the world’s top ten.
Advertising Age gave DDB Worldwide its 2003 Global Agency
Network of the Year award. And our specialty marketing companies,
always very highly regarded within their specialties, continued to
demonstrate their leadership in annual compilations of creative
excellence.

OMD Worldwide completed its first full year as a unified, global
operation. The business continued to deliver on the promise
underlying its launch in 2002, winning more than 400 new
assignments around the world.

Investing in our relationships
During 2003, our agencies took advantage of attractive opportunities
to make substantial investments in their creative bench strength.
Letter from the President


They hired senior creative people and their account teams
primarily with an eye to winning future business. That strategy
began to pay off in new client assignments by the end of the year,
and we expect to see a substantial return on these investments in
2004 and 2005.

Investing in our people has a long and successful history at
Omnicom. We believe that our employees have tremendous
“embedded knowledge,” or collective business experience, that
should be made available to Omnicom employees around the
world. In this sense, we are a learning and a teaching organization
in which the sharing of our business knowledge is both a core
competency and a competitive advantage.

In 1995, for example, we founded Omnicom University and
created the Senior Management Program (SMP) with Harvard
Business School professor Len Schlesinger. The SMP is a global
leadership program that uses the case study approach to explore
the best contemporary thinking on the management of professional
service firms. More than 700 CEOs and senior managers of
Omnicom companies have completed their two-year commitment.

DAS University’s Business Learning Program was founded in 1997 to
disseminate the essential skills required in a professional services
firm. The program is open to all managers at Omnicom companies
and, to date, 2,200 of our colleagues have attended programs in the
U.S., United Kingdom and Latin America.

In September 2003, ten recent graduates of top business schools
began our new MBA Residency Program. During the 30 months of
the program, they will rotate through six of our disciplines, guided
by a management-level mentor within each operating company. By
getting cross-training experience at this early stage in their careers,
we believe participants will not only find the right placement within
the Company but also develop the skills required to serve clients in
multiple disciplines.
Letter from the President


We also believe in sharing our skills with the communities which
support our businesses. Each year, our agencies and networks
invest considerable time and resources in support of charitable and
not-for-profit activities. This pro bono work, comprising many
thousands of hours of professional time each year, is driven by
individual agencies in their local communities without direction
from Omnicom. This ‘giving back’ is a compelling testimonial to the
generous spirit that animates our agencies and their employees.

The return on these investments comes to us in many ways. An
independent benchmarking study showed that, between 1995 and
2002, the cost savings attributable to reduced senior management
turnover more than reimbursed us for all our learning activities.
The same study also identified a critical feature of the successful
professional services firm that we have discussed previously: those
offices with a strong corporate culture, solid leadership and high
employee morale are also the most profitable.

Governance and stock-based compensation
I can say with unequivocal certainty that the shareholders of
Omnicom have been very well served over the years by the
governance of the Board of Directors. During 2002 and 2003, the
Board made a number of proactive changes in response to evolving
standards of corporate governance, and it is making additional
changes in 2004. Specifically, the Board has approved Omnicom’s
election, in advance of requirements by the Financial Accounting
Standards Board, to record as an expense on the Company’s income
statement the fair value of stock options awarded to employees.
The election became effective January 1, 2004.

An important point: This change in accounting in no way alters our
philosophy with regard to incentive compensation for employees.
We have already changed our mix of compensation, and we may
consider more changes. We intend to preserve the flexibility to
design competitive compensation packages that enable us to attract
and retain the very best talent in each of our business disciplines.
Letter from the President


Looking ahead
We entered 2004 with good momentum on several fronts. Global
economic growth has generally resumed – Europe being slower to
get under way – and clients are again investing in brand building
after three years of maintenance spending. The difficult job of
matching personnel and facilities to work levels was substantially
completed last year, and we can now focus our attention on
building revenues on a more cost-effective foundation, especially in
Europe. That said, we will continue the challenging work of helping
agencies fine-tune their cost structures. We also expect incentive
compensation, which was scaled back in recent years, to become a
more prominent expense in order to ensure that we continue to
provide key personnel with competitive compensation packages.

Client-centered networks, exceptional creative talent, industry-
leading breadth in all disciplines, global capability in all major
markets – these are the perennial drivers of revenues at Omnicom
agencies. We believe these capabilities make a compelling case to
clients that are seeking ways to ensure their marketing dollars are
well spent. Our businesses plan to make that case aggressively
during 2004 in order to build our growing share of markets around
the world.

Our objectives for 2004 will be very familiar to those who know
Omnicom: growth of revenues and earnings, balance in a diversified
portfolio of businesses, and stability of returns for shareholders.
The strategy underpinning those objectives has delivered steady
increases in shareholder value for 17 years. We intend to keep the
record going.

Sincerely,


John D. Wren
President & Chief Executive Officer
April 2004
UNITED STATES
                            SECURITIES AND EXCHANGE COMMISSION
                                                                            Washington, D.C. 20549

[X]   ANNUAL REPORT PURSUANT TO SECTION 13 OR 15(d) OF THE
      SECURITIES EXCHANGE ACT OF 1934
      For the fiscal year ended: December 31, 2003
                                          OR
[]    TRANSITION REPORT PURSUANT TO SECTION 13 OR 15(d) OF THE
      SECURITIES EXCHANGE ACT OF 1934

                                                          Commission File Number: 1-10551


                                  OMNICOM GROUP INC.      (Exact name of registrant as specified in its charter)

                              New York                                                                             13-1514814
                (State or other jurisdiction of                                                    (I.R.S. Employer Identification No.)
               incorporation or organization)

      437 Madison Avenue, New York, NY                                                                                   10022
         (Address of principal executive offices)                                                                     (Zip Code)

                               Registrant’s telephone number, including area code: (212) 415-3600

                                          Securities Registered Pursuant to Section 12(b) of the Act:
                                                                                                      Name of each Exchange
                      Title of each class                                                                 on which Registered
          _______________________________________________________________                           ________________________________________________________
          Common Stock, $.15 Par Value                                                               New York Stock Exchange

                                    Securities Registered Pursuant to Section 12(g) of the Act: None


      The registrant has (1) filed all reports required to be filed by Section 13 or 15(d) of the Securities
Exchange Act of 1934 during the preceding 12 months and (2) been subject to such filing requirements
for the past 90 days.
      Disclosure of delinquent filers pursuant to Item 405 of Regulations S-K is not contained herein and
will not be contained in the definitive proxy or information statements incorporated by reference in Part
III of this form 10-K or any amendment to this Form 10-K.
     Indicate by check mark whether the registrant is an accelerated filer (as defined in Exchange Act
Rule 12b-2): Yes X No


      At March 1, 2004, 190,531,541 shares of Omnicom Common Stock, $.15 par value, were
outstanding; the aggregate market value of the voting stock held by nonaffiliates as of the last business
day of the registrant’s most recently completed second fiscal quarter was $13,173,641,000.
     Certain portions of Omnicom’s definitive proxy statement relating to its annual meeting of
shareholders scheduled to be held on May 25, 2004 are incorporated by reference into Part III of this
report.
OMNICOM GROUP INC.

                                                 ANNUAL REPORT ON FORM 10-K FOR
                                                 THE YEAR ENDED DECEMBER 31, 2003
                                                                 TABLE OF CONTENTS
                                                                                                                                                            Page
                                                                                                                                                            ____
PART I
Item 1.              Business ..........................................................................................................................     1
Item 2.              Properties ........................................................................................................................     3
Item 3.              Legal Proceedings ..........................................................................................................            4
Item 4.              Submission of Matters to a Vote of Security Holders....................................................                                 4

PART II
Item 5.     Market for Registrant’s Common Equity and Related Stockholder Matters ................                                                           5
Item 6.     Selected Financial Data ..................................................................................................                       6
Items 7/7A. Management’s Discussion and Analysis of Financial Condition and Results of
                 Operations: Critical Accounting Policies; and Quantitative and Qualitative
                 Disclosures about Market Risk ..............................................................................                                8
Item 8.     Financial Statements and Supplementary Data..............................................................                                       24
Item 9.     Changes and Disagreements with Accountants on Accounting and
                 Financial Disclosure ..............................................................................................                        24
Item 9A.    Controls and Disclosure ................................................................................................                        24

PART III
Item 10.             Directors and Executive Officers of the Registrant........................................................                             25
Item 11.             Executive Compensation ................................................................................................                 *
Item 12.             Security Ownership of Certain Beneficial Owners and Management ..........................                                               *
Item 13.             Certain Relationships and Related Transactions ............................................................                             *

PART IV
Item 15.        Exhibits, Financial Statement Schedules and Reports on Form 8-K ............................                                                 26
                Index to Financial Statements ........................................................................................                       26
                Index to Financial Statements Schedules ......................................................................                               26
                Exhibit Index ..................................................................................................................             26
Signatures ..............................................................................................................................................    29
Management Report ..............................................................................................................................            F-1
Independent Auditors’ Report ..............................................................................................................                 F-2
Consolidated Financial Statements ......................................................................................................                    F-4
Notes to Consolidated Financial Statements ........................................................................................                         F-8
Certifications of Senior Executive Officers ..........................................................................................                      S-4

* The information called for by Items 10, 11, 12 and 13, to the extent not included in this document, is
  incorporated herein by reference to the information to be included under the captions “Election of Directors”,
  “Stock Ownership”, “Director Compensation” and “Executive Compensation” in Omnicom’s definitive proxy
  statement, which is expected to be filed by April 23, 2004.
PART I

Introduction
      This report is both our 2003 annual report to shareholders and our 2003 annual report on Form 10-K
required under federal securities laws.
      We are a holding company. Our business is conducted through subsidiaries. For simplicity, however, the
terms “Omnicom”, “we”, “our” and “us” each refer to Omnicom Group Inc. and our subsidiaries unless the
context indicates otherwise.
      Statements of our beliefs or expectations regarding future events are “forward-looking statements” within
the meaning of the federal securities laws. These statements are subject to various risks and uncertainties,
including as a result of the specific factors identified under the captions “Risks and Competitive Conditions” and
“Management’s Discussion and Analysis of Financial Condition and Results of Operations” on pages 3 and 7
and elsewhere in this report. There can be no assurance that these beliefs or expectations will not change or be
affected by actual future events.

1. Business
      Our Business: We are one of the largest advertising, marketing and corporate communications companies
in the world. Our company was formed through a 1986 combination of three advertising, marketing and
corporate communications networks, BBDO, Doyle Dane Bernbach and Needham Harper.
     Since then, we have grown our strategic holdings to over 1,500 subsidiary agencies operating in all major
markets worldwide. Our agencies provide an extensive range of advertising, marketing and corporate
communications services, including:
      advertising                                                  investor relations
      brand consultancy                                            marketing research
      crisis communications                                        media planning and buying
      custom publishing                                            multi-cultural marketing
      database management                                          non-profit marketing
      digital and interactive marketing                            organizational communications
      direct marketing                                             package design
      directory advertising                                        product placement
      entertainment marketing                                      promotional marketing
      environmental design                                         public affairs
      experiential marketing                                       public relations
      field marketing                                              real estate advertising and marketing
      financial / corporate business-to-business advertising       recruitment communications
      graphic arts                                                 reputation consulting
      healthcare communications                                    retail marketing
      instore design                                               sports and event marketing


                                                               1
Advertising, marketing and corporate communications services are provided to clients through global,
pan-regional and national independent agency brands. Our brands include:
      BBDO Worldwide                                         Jump
      DDB Worldwide                                          Kaleidoscope
      TBWA Worldwide                                         Ketchum
      OMD Worldwide                                          Ketchum Directory Advertising
      Adelphi Group                                          KPR
      AGENCY.COM                                             Lieber Levett Koenig Farese Babcock
      Alcone Marketing Group                                 Lyons Lavey Nickel Swift
      Anderson DDB                                           M/A/R/C Research
      ARA Group                                              Marketing Advantage
      Arnell Group                                           MarketStar
      Atmosphere BBDO                                        Martin/Williams
      Auditoire                                              Matthews Media Group
      BDDP & Fils                                            MBA
      Bernard Hodes Group                                    Mercury Public Affairs
      Brand Architecture International                       Merkley & Partners
      Brodeur Worldwide                                      MicroMedia
      Carlson and Partners                                   Millsport
      Carré Bleu Marine                                      Moss Dragoti
      Changing Our World                                     Multi-M
      Clark & Weinstock                                      National In-Store
      Claydon Heeley Jones Mason                             New Solutions
      Clemenger Communications Limited                       Nouveau Monde
      Cline, Davis & Mann                                    Novus
      Cone                                                   Organic
      Corbett Accel Healthcare Group                         Paris Venise Design
      CPM                                                    Pentamark
      Creative Juice                                         PGC Advertising
      Davie-Brown Entertainment                              PhD
      del Rivero Messianu                                    Porter Novelli International
      Dieste, Harmel & Partners                              Proximity Worldwide
      Direct Partners                                        Radiate Sports & Entertainment Group
      Doremus                                                Rapp Collins Worldwide
      Eigen Fabrikaat                                        Russ Reid Company
      Element 79 Partners                                    Salesforce
      Etcetera Groep                                         Screen
      European Communication Consultants                     Sellbytel
      FitzGerald Communications                              Serino Coyne
      FKGB                                                   Siegel & Gale
      Fleishman-Hillard                                      Spike DDB
      Full Circle Entertainment                              Spot Plus
      G1                                                     Staniforth
      Gavin Anderson & Company                               Steiner Sports Marketing
      Goodby, Silverstein & Partners                         Targetbase
      Grizzard Communications                                TARGIS
      GSD&M                                                  Tequila
      Hall & Partners Group                                  Textuel
      Harrison & Star Business Group                         The Ant Farm
      Health Science Communications                          The Designory
      Heye & Partner                                         The Marketing Arm
      Horrow Sports Ventures                                 The Promotion Network
      ICON                                                   TPG
      Integrated Merchandising Services                      Tracy Locke Partnership
      Integer Group                                          Tribal DDB
      Interbrand                                             Washington Speakers Bureau
      InterScreen                                            Wolff Olins
      itec                                                  Zimmerman & Partners Advertising


                                                      2
The various components of our business and material factors that affected us in 2003 are discussed in our
“Management’s Discussion and Analysis of Financial Conditions and Results of Operations” of this report. None
of our acquisitions in 2003, 2002 or 2001 were material to our consolidated financial position or results of
operations. For information concerning our acquisitions, see note 2 to our consolidated financial statements.
      Geographic Regions: Our total consolidated revenue is about evenly divided between U.S. and non-U.S.
operations. For financial information concerning domestic and foreign operations and segment reporting, see
note 5 to our consolidated financial statements.
       Our Clients: We had over 5,000 clients in 2003, many of which were served by more than one of our
agency brands. Our 10 largest and 250 largest clients in the aggregate accounted for 18.7% and 53.8%,
respectively, of our 2003 consolidated revenue. Our largest client was served by 50 of our agency brands. This
client accounted for 4.7% of our 2003 consolidated revenue. No other client accounted for more than 2.9% of
our 2003 consolidated revenue.
       Our Employees: We employed approximately 58,500 people at December 31, 2003. We are not party to
any significant collective bargaining agreements. See our management discussion and analysis beginning on page
7 of this report for a discussion of the effect of salary and service costs on our historical results of operations.
       Risks and Competitive Conditions: We face the risks normally associated with global services businesses.
The operational and financial performance of our businesses are typically tied to overall economic and regional
market conditions, competition for client assignments and talented staff, new business wins and losses and the
risks associated with extensive international operations. We do not believe that our international operations as a
whole present any material risk to our overall business because they invoice clients and pay expenses in their
local currency. However, there are some risks of doing business abroad, including those of currency fluctuations,
political instability and exchange controls, which do not affect domestic-focused firms as discussed in our
management’s discussion and analysis starting on page 7. For financial information on our operations by
geographic area, see note 5 to our consolidated financial statements.
       The particular businesses in which we participate are highly competitive. Typically, the financial and
technological barriers to entry are low, with the key competitive considerations for keeping existing business and
winning new business being the quality and effectiveness of the services offered, including our ability to
efficiently serve clients, particularly large international clients, on a broad geographic basis. While many of our
client relationships are long-standing, companies put their advertising, marketing services and public and
corporate communications businesses up for competitive review from time to time. To the extent that we are not
able to remain competitive or to keep key clients, our business and financial results could be adversely affected.
       Our ability to retain existing clients and to attract new clients may, in some cases, be limited by clients’
policies on, or perceptions of, conflicts of interest arising out of other client relationships. In addition, an important
aspect of our competitiveness is our ability to retain key employee and management personnel. Our continuing
ability to attract and retain these employees may have a material effect on our business and financial results.
       Our revenue is dependent upon the advertising, marketing and corporate communication requirements of
our clients and tends to be lowest in the first and third quarters of the calendar year as a result of the post-holiday
slowdown in client activity at the beginning of January and a slowdown in client activity in August primarily as a
result of the vacation season. See our management discussion and analysis beginning on page 7 of this report for a
discussion of the effect of market conditions and other factors on our historical results of operations.
       Directly or indirectly, government agencies and consumer groups have from time to time affected or
attempted to affect the scope, content and manner of presentation of advertising, marketing and corporate
communications services through regulations and other governmental action. We believe the total volume of
advertising, marketing and corporate communications services will not be materially affected by future
legislation or regulation, however the scope, content and manner of presentation may continue to change.

2. Properties
      We maintain office space in many major cities around the world. This space is primarily used for office
and administrative purposes by our employees in performing professional services. Our principal corporate
offices are at 437 Madison Avenue, New York, New York and One East Weaver Street, Greenwich, Connecticut.
We also maintain executive offices in London, England.

                                                            3
Our office space is utilized for performing professional services and is in suitable and well-maintained
condition for our current operations. Substantially all of our office space is leased from third parties with varying
expiration dates ranging from one to 19 years. Certain of our leases are subject to rent reviews or contain various
escalation clauses and certain of our leases require our payment of various operating expenses, which may also be
subject to escalation. In addition, leases are denominated in the local currency of the operating entity and are
therefore subject to changes in foreign exchange rates. Our consolidated rent expense was $335.5 million in 2003,
$311.3 million in 2002 and $305.4 million in 2001, after reduction for rents received from subleases of
$17.3 million, $15.5 million and $8.0 million, respectively. Our obligations for future minimum base rents under
terms of non-cancelable real estate leases and other operating leases, which include primarily office furniture and
computer and technology equipment, reduced by rents receivable from non-cancelable subleases are (in millions):
                                                                                                                Net Rent
                                                                                                                ________
                 2004 . . . . . . . . . . . . . . . . . . . . . . . . . . . . . . . . . . . . . . . . . . . .   $435.9
                 2005 . . . . . . . . . . . . . . . . . . . . . . . . . . . . . . . . . . . . . . . . . . . .    362.7
                 2006 . . . . . . . . . . . . . . . . . . . . . . . . . . . . . . . . . . . . . . . . . . . .    288.4
                 2007 . . . . . . . . . . . . . . . . . . . . . . . . . . . . . . . . . . . . . . . . . . . .    231.3
                 2008 . . . . . . . . . . . . . . . . . . . . . . . . . . . . . . . . . . . . . . . . . . . .    190.9
                 Thereafter . . . . . . . . . . . . . . . . . . . . . . . . . . . . . . . . . . . . . . . . .    949.3
    See note 10 to our consolidated financial statements of this report for a discussion of our lease
commitments and our management discussion and analysis for the impact of leases on our operating expenses.

3. Legal Proceedings
      Beginning on June 13, 2002, several proposed class actions were filed against us and certain senior
executives in the United States District Court for the Southern District of New York. The actions have since been
consolidated under the caption In re Omnicom Group Inc. Securities Litigation, No. 02-CV4483 (RCC) on behalf
of a proposed class of purchasers of our common stock between February 20, 2001 and June 11, 2002. The
consolidated complaint alleges among other things that our public filings and other public statements during that
period contained false and misleading statements or omitted to state material information relating to (1) our
calculation of the organic growth component of period-to-period revenue growth, (2) our valuation of certain
internet investments made by our Communicade Group, which we contributed to Seneca Investments LLC in
2001, and (3) the existence and amount of certain contingent future obligations in respect of acquisitions. The
complaint seeks an unspecified amount of compensatory damages plus costs and attorneys’ fees. Defendants have
moved to dismiss the complaint. The court has not yet decided the motion. In addition to the proceedings
described above, a shareholder derivative action was filed on June 28, 2002 in New York State Court in New York
City by a plaintiff shareholder, purportedly on our behalf, alleging breaches of fiduciary duty, disclosure failures,
abuse of control and gross mismanagement in connection with the formation of Seneca Investments LLC.
      Management presently expects to defend these cases vigorously. Currently, we are unable to determine the
outcome of these cases and the effect on our financial position or results of operations. The outcome of any of
these matters is inherently uncertain and may be affected by future events. Accordingly, we cannot assure
investors as to the ultimate effect of these matters on our financial position or results of operations.
      We are also involved from time to time in various routine legal proceedings in the ordinary course of
business. We do not presently expect that these proceedings will have a material adverse effect on our
consolidated financial position or results of operations.
      For additional information concerning our legal proceedings, including the class action and derivative
action described above, see note 14 to our consolidated financial statements, which is incorporated into this
section by reference.

4. Submission of Matters to a Vote of Security Holders
     Our annual shareholders meeting has historically been held in the second quarter of the year. No matters
were submitted to a vote of our shareholders during the last quarter of 2003.


                                                                         4
PART II

5. Market for Registrant’s Common Equity and Related Stockholder Matters
      Our common shares are listed on the New York Stock Exchange under the symbol “OMC”. On March 1,
2004, we had 3,633 holders of record of our common shares. The table below shows the range of quarterly high
and low sales prices reported on the New York Stock Exchange Composite Tape for our common shares and the
dividends paid per share for these periods.
                                                                                                    Dividends Paid
               Period                                                   High           Low              Per Share
               ___________                                             ___________   ___________   ___________________________
               Q1 2002 ......................................          $96.30        $82.76               $0.20
               Q2 2002 ......................................           94.10         36.27                0.20
               Q3 2002 ......................................           65.61         38.54                0.20
               Q4 2002 ......................................           70.29         48.10                0.20
               Q1 2003 ......................................          $68.25        $46.50               $0.20
               Q2 2003 ......................................           76.43         53.15                0.20
               Q3 2003 ......................................           81.18         69.61                0.20
               Q4 2003 ......................................           87.60         71.80                0.20
               Q1 2004* ....................................           $88.50        $76.85               $0.20
               *      through March 1, 2004


                                                                   5
6. Selected Financial Data
      The following selected financial data should be read in conjunction with our consolidated financial
statements and related notes which begin on page F-1, as well as our management’s discussion and analysis
which begins on page 7 of this report.
                                                                          (Dollars in thousands except per share amounts)
                                                               ______________________________________________________________
                                                               2003           2002             2001            2000       1999
                                                               ________       ________         ________        ________   ________
   For the year:
      Revenue .......................................... $ 8,621,404 $ 7,536,299 $ 6,889,406              $6,154,230     $5,130,545
      Operating Profit ..............................       1,164,675  1,104,115     968,184                 878,090        724,130
      Income After Income Taxes ............                  740,922    697,987     543,257                 542,477        400,461
      Net Income ......................................       675,883    643,459     503,142                 498,795        362,882
      Net Income per common share:
         Basic............................................       3.61       3.46        2.75                     2.85            2.07
         Diluted ........................................        3.59       3.44        2.70                     2.73            2.01
      Dividends declared per common
         share ............................................     0.800      0.800       0.775                    0.700          0.625
   At year end:
      Cash, cash equivalents and
         short-term investments .............. $ 1,548,935 $ 695,881 $ 516,999                            $ 576,539      $ 600,949
      Total assets ...................................... 14,499,456 11,819,802 10,617,414                 9,853,707      9,017,637
      Long-term obligations:
         Long-term debt ..........................            197,291    197,861     490,105               1,015,419         263,149
         Convertible notes ........................         2,339,304  1,747,037     850,000                 229,968         448,483
         Deferred compensation and
            other liabilities ........................        342,894    293,638     296,980                 296,921         300,746

      As discussed in footnote 13 of the notes to our consolidated financial statements, as required by statements
of Financial Accounting Standards 142 — “Goodwill and Other Intangibles” (“SFAS 142”), beginning with our
2002 results, goodwill and other intangible assets that have indefinite lives due to a change in generally accepted
accounting principles (“GAAP”) are not amortized. To make our results for the periods prior to 2002 more
directly comparable in the table that follows, we adjusted our historical results for periods prior to 2002 to
eliminate goodwill amortization for all periods, as well as a non-recurring gain on the sale of Razorfish shares in
2000, and the related tax impacts. As a result of these exclusions, this presentation is a non-GAAP financial
measure. We believe that by excluding the items noted above, the table below presents selected financial data
using amounts that are more comparable year-to-year and thus more meaningful for purposes of this analysis.

                                                                          (Dollars in thousands except per share amounts)
                                                               ______________________________________________________________
                                                               2003           2002             2001            2000       1999
                                                               ________       ________         ________        ________   ________
   Net Income, as adjusted:
     Net Income, as reported, GAAP ........                   $675,883       $643,459       $503,142        $498,795       $362,882
     Add-back goodwill amortization,
         net of income taxes..........................              —               —          83,065          76,518         66,490
     Less: gain on sale of Razorfish
         shares, net of income taxes ............                   —              —              —         _ 63,826             —
                                                              ________       ________       __
                                                                                             _______         _______       __
                                                                                                                            _______
     Net Income, excluding goodwill
         amortization and Razorfish gain ....                 $675,883       $643,459       $586,207        $511,487       $429,372
                                                              ________       ________       __
                                                                                             _______        ________       __
                                                                                                                            _______
      Basic Net Income per share:
         as reported, GAAP ..........................            $3.61           $3.46          $2.75           $2.85           $2.07
         as adjusted ......................................      $3.61           $3.46          $3.21           $2.93           $2.45
      Diluted Net Income per share:
         as reported, GAAP ..........................            $3.59           $3.44          $2.70           $2.73           $2.01
         as adjusted ......................................      $3.59           $3.44          $3.13           $2.80           $2.36


                                                                         6
The following is a reconciliation of the “as reported” to “as adjusted” Net Income per share on a basic and
diluted basis.
                                                                           (Dollars in thousands except per share amounts)
                                                                 _____________________________________________________________
                                                                 2003            2002            2001             2000     1999
                                                                 ________        ________        ________         ________ ________
  Basic Net Income per share, as adjusted:
    Net Income per common share:
    Basic, as reported, GAAP ....................               $3.61           $3.46          $2.75           $2.85          $2.07
    Add-back goodwill amortization
        per common share, net of
        income taxes ....................................           —               —            0.46            0.44           0.38
    Less: gain on sale of Razorfish
        shares, per common share, net
        of income taxes................................              —               —              —            0.36              —
                                                                _________       _________      _________       _________      _________
    Net Income per common share,
        excluding goodwill amortization
        and Razorfish gain:
           Basic ............................................   $3.61           $3.46          $3.21           $2.93          $2.45
                                                                _________       _________      _________       _________      _________
                                                                _________       _________      _________       _________      _________
  Diluted Net Income per share, as adjusted:
     Net Income per common share:
        Diluted, as reported, GAAP ............                 $3.59           $3.44          $2.70           $2.73          $2.01
     Add-back goodwill amortization
        per common share, net of
        income taxes ....................................           —               —            0.43            0.41           0.35
     Less: gain on sale of Razorfish
        shares, per common share, net
        of income taxes................................              —               —              —            0.34              —
                                                                _________       _________      _________       _________      _________
     Net Income per common share,
        excluding goodwill amortization
        and Razorfish gain:
           Diluted ........................................     $3.59           $3.44          $3.13           $2.80          $2.36
                                                                _________       _________      _________       _________      _________
                                                                _________       _________      _________       _________      _________


                                                                            7
7/7A. Management’s Discussion and Analysis of Financial Condition and Results of Operations; Critical
      Accounting Policies; and Quantitative and Qualitative Information about Market Risk

Executive Summary
      We are a holding company. We own industry-leading advertising, marketing and corporate
communications companies that span more than 30 marketing disciplines, 100 countries, 1,500 subsidiary
agencies and 5,000 clients. On a global, pan-regional and local basis, our agencies provide traditional media
advertising services as well as marketing services including customer relationship management, public relations
and specialty communications. We continually seek to grow our business with our existing clients by
maintaining a client-centered approach, as well as expanding our existing business relationships into new
markets and new clients. In addition, we pursue selective acquisitions of complementary companies with strong,
entrepreneurial management teams that either currently serve or have the ability to serve our existing client base.
      During the past few years, overall industry and margin growth continued to be affected by geopolitical unrest,
lagging economic conditions, lack of consumer confidence and cautious client spending. All of these factors
contributed to a difficult business environment and industry-wide margin contraction. Our diversified portfolio of
companies, both from a geographical and a service offerings perspective, has allowed us to perform ahead of the
industry in general. During this period we have continued to invest in our businesses and our personnel, and have
taken action to reduce costs at some of our companies to deal with the changing economic circumstances.
      Several long-term trends continue to positively affect our business, including our clients increasingly
expanding the focus of their brand strategies from national markets to pan-regional and global markets.
Additionally, in an effort to gain greater efficiency and effectiveness from their marketing dollars, clients are
increasingly requiring greater coordination of their traditional advertising and marketing activities and
concentrating these activities with a smaller number of service providers.
      Although the overall business environment has been difficult, as a result of the diversity and balance of our
portfolio of companies and service offerings, we continued to grow our revenues. However, as a result of
changes in our business mix, increased severance costs incurred, under-utilization of staff, increased professional
fees and increased amortization of other intangible assets, our margins were lower in 2003 and in 2002 than our
historical performance. We are hopeful that with continuing improvements in the U.S. economy, combined with
the cost-reduction actions taken by our companies, margins should begin to stabilize.
      Given our size and breadth, we manage the business by monitoring several financial and non-financial
performance indicators. The key indicators that we review focus on the areas of revenues and operating
expenses.
      Revenue growth is analyzed by reviewing the components and mix of the growth, including: growth by
major geographic location; growth by major marketing discipline; growth from currency changes; growth from
acquisition and growth from our largest clients.
      In recent years, our revenue has been divided almost evenly between domestic and international operations.
In 2003, our overall revenue growth was 14.4%, of which 6.2% was related to changes in foreign exchange rates
and 3.6% was related to acquired entities. The remainder, 4.6%, was organic growth.
     In 2003, traditional media advertising represented about 44% of the total revenue and grew by 14.1%.
Marketing services represented about 56% of total revenue and grew by 14.6% over the previous year.
      We believe that our ability to increase revenues as a result of our client-centered approach to the business
is demonstrated most clearly in our relationships with our largest clients. While consolidated revenues on a U.S.
dollar basis increased 14.4% in 2003, revenue from our ten largest clients increased 19.3%. By expanding the
breadth of our relationships with these clients we not only increase revenues, but we also enhance the overall
consistency and stability of our operations, which in turn drives our financial performance.
      We measure operating expenses in two distinct cost categories, salary and service costs, and office and
general expenses. Because we are a service business, we monitor these costs on a percentage of revenue basis.
Salary and service costs tend to fluctuate in conjunction with changes in revenues, whereas office and general
expenses, which are not directly related to servicing clients, tend to decrease as revenues increase because a


                                                          8
significant portion of these expenses are relatively fixed in nature. Over the past three years, salary and service
costs have grown from 64.2% of revenue to 67.7% of revenue, while office and general expenses have declined
from 21.8% of revenue to 18.8% of revenue.
     Our net income for 2003 increased by 5.0% to $675.9 million from $643.5 million in 2002 and our diluted
EPS increased by 4.4% to $3.59 from $3.44.
      The following year-over-year analysis gives further details and insight into the changes in our financial
performance.


        Financial Results from Operations — 2003 Compared with 2002
                                                                                                               (Dollars in millions, except per share amounts)
Twelve Months Ended December 31,                                                                                           2003                  2002
                                                                                                                          _____                 _____
Revenue ....................................................................................................           $8,621.4             $7,536.3
Operating expenses:
  Salary and service costs ......................................................................                        5,839.0              4,952.9
  Office and general expenses ................................................................                           1,617.7              1,479.3
                                                                                                                       ______________       ______________
                                                                                                                         7,456.7              6,432.2
                                                                                                                       ______________       ______________
Operating profit ........................................................................................                1,164.7              1,104.1
Net interest expense:
  Interest expense ....................................................................................                       57.9                 45.5
  Interest income ....................................................................................                       (15.1)               (15.0)
                                                                                                                       ______________       ______________
                                                                                                                              42.8                 30.5
                                                                                                                       ______________       ______________
Income before income taxes ....................................................................                          1,121.9              1,073.6
Income taxes ............................................................................................                   380.9                375.6
                                                                                                                       ______________       ______________
Income after income taxes ........................................................................                          741.0                698.0
Equity in earnings of affiliates..................................................................                            15.1                 13.8
Minority interests                                                                                                           (80.2)               (68.3)
                                                                                                                       ______________       ______________
  Net income ..........................................................................................                $ 675.9              $ 643.5
                                                                                                                       ______________       ______________
                                                                                                                       ______________       ______________
Net Income Per Common Share:
  Basic ....................................................................................................                $3.61                $3.46
  Diluted ..................................................................................................                 3.59                 3.44
Dividends Declared Per Common Share ..................................................                                      $0.80                $0.80
       Revenue: When comparing performance between years, we discuss non-GAAP financial measures such as
the impact that foreign currency rate changes, acquisitions/dispositions and organic growth have on reported
revenues. As we derive significant revenue from international operations, changes in foreign currency rates
between the years impact reported results. Reported results are also impacted by our acquisition and disposition
activity and organic growth. Accordingly, we provide this information to supplement the discussion of changes
in revenue period-to-period.


                                                                                    9
Our 2003 consolidated worldwide revenue increased 14.4% to $8,621.4 million from $7,536.3 million in
2002. The effect of acquisitions, net of disposals, increased 2003 worldwide revenue by $271.7 million. Organic
growth increased worldwide revenue by $347.8 million, and foreign exchange impacts increased worldwide
revenue by $465.6 million. The components of total 2003 revenue growth in the U.S. (“domestic”) and the
remainder of the world (“international”) are summarized below ($ in millions):
                                                                          Total                                 Domestic                        International
                                                                   ___________________                    ___________________                 _________________
                                                                       $           %                          $          %                      $           %
                                                                   ________     _______                   ________    _______               ________     _______
  December 31, 2002................................                $7,536.3               —               $4,284.6              —           $3,251.7          —
  Components of Revenue Changes:
  Foreign exchange impact.......................                        465.6              6.2%                     —             —              465.6       14.3%
  Acquisitions ...........................................              271.7              3.6%                174.7             4.1%              97.0        3.0%
  Organic...................................................            347.8              4.6%                261.5             6.1%              86.2        2.7%
                                                                   ______________        _______          ______________       _______      ______________   _______
  December 31, 2003................................                $8,621.4              14.4%            $4,720.9             10.2%        $3,900.5         20.0%
                                                                   ______________        _______          ______________       _______      ______________   _______
                                                                   ______________        _______          ______________       _______      ______________   _______
      The components and percentages are calculated as follows:
      •     The foreign exchange impact component shown in the table is calculated by first converting the current
            period’s local currency revenue using the average exchange rates from the equivalent prior period to
            arrive at a constant currency revenue (in this case $8,155.8 million for the Total column in the table).
            The foreign exchange impact equals the difference between the current period revenue in U.S. dollars
            and the current period revenue in constant currency (in this case $8,621.4 million less $8,155.8 million
            for the Total column in the table).
      •     The acquisition component shown in the table is calculated by aggregating the applicable prior period
            revenue of the acquired businesses. Netted against this number is the revenue of any business included
            in the prior period reported revenue that was disposed of subsequent to the prior period.
      •     The organic component shown in the table is calculated by subtracting both the foreign exchange and
            acquisition revenue components from total revenue growth.
      •     The percentage change shown in the table of each component is calculated by dividing the individual
            component amount by the prior period revenue base of that component (in this case $7,536.3 million
            for the Total column in the table).
      During the past few years, geopolitical unrest, lagging economic conditions, lack of consumer confidence
and cautious client spending have continued to affect overall industry growth. However, our diversified portfolio
of companies, both from a geographical and service offerings perspective, has allowed us to perform ahead of
the industry in general and we have continued to grow our revenues.
     The components of revenue and revenue growth for 2003 compared to 2002, in our primary geographic
markets are summarized below ($ in millions):
                                                                                                              $ Revenue              % Growth
                                                                                                              _________              _________
                      United States ..............................................................            $4,720.9                   10.2%
                      Euro Markets..............................................................                1,789.9                  22.6%
                      United Kingdom ........................................................                      941.9                 15.9%
                      Other ..........................................................................          1,168.7                  19.4%
                                                                                                              ______________             _______
                      Total ...........................................................................       $8,621.4                   14.4%
                                                                                                              ______________             _______
                                                                                                              ______________             _______
      As indicated, foreign exchange impacts increased our international revenue by $465.6 million for 2003.
The most significant impacts resulted from the continued strengthening of the Euro and the British Pound
against the U.S. dollar, as our operations in these markets represented approximately 70.0% of our international
revenue. Additional geographic information relating to our business is contained in note 5 to our consolidated
financial statements.
      Due to a variety of factors, in the normal course, our agencies both gain and lose business from clients
each year. The net result in 2003, and historically each year for Omnicom as a whole, was an overall gain in new
business. Due to our multiple independent agency structure and the breadth of our service offerings and

                                                                                    10
geographic reach, our agencies have more than 5,000 active client relationships in the aggregate. Revenue from
our single largest client in 2003 increased by 7.9%. This client represented 4.7% of worldwide revenue in 2003
and 5.0% in 2002 and no other client represented more than 2.9% in 2003 or 2002. Revenue from our ten largest
and 250 largest clients grew by more than 19.0% and 15.0%, respectively. Our ten largest and 250 largest clients
represented 18.7% and 53.8% of our 2003 worldwide revenue, respectively and 17.9% and 53.4% of our 2002
worldwide revenue.
       Driven by clients’ continuous demand for more effective and efficient branding activities, we strive to
provide an extensive range of advertising, marketing and corporate communications services through various
client centric networks that are organized to meet specific client objectives. These services include advertising,
brand consultancy, crisis communications, custom publishing, database management, digital and interactive
marketing, direct marketing, directory advertising, entertainment marketing, environmental design, experiential
marketing, field marketing, financial / corporate business-to-business advertising, graphic arts, healthcare
communications, instore design, investor relations, marketing research, media planning and buying,
multi-cultural marketing, non-profit marketing, organizational communications, package design, product
placement, promotional marketing, public affairs, public relations, real estate advertising and marketing,
recruitment communications, reputation consulting, retail marketing and sports and event marketing. In an effort
to monitor the changing needs of our clients and to further expand the scope of our services to key clients, we
monitor revenue across a broad range of disciplines and group them into the following four categories:
traditional media advertising, customer relationship management, referred to as CRM, public relations and
specialty communications as summarized below.
                                                                                          (Dollars in millions)
                                                                ____________________________________________________________________
                                                                                   Twelve Months Ended December 31,
                                                                       2003                        2002                2003 vs 2002
                                                                __________________         __________________     ___________________
                                                                            % of                         % of         $           %
                                                                Revenue Revenue            Revenue Revenue          Growth      Growth
                                                                ________ ________         ________ ________       _________ _________
Traditional media advertising ..............                   $3,739.7         43.4%       $3,276.4           43.5%       $ 463.3            14.1%
CRM ....................................................         2,918.6        33.8%         2,421.8          32.1%            496.8         20.5%
Public relations ....................................               955.1       11.1%            921.0         12.2%              34.1          3.7%
Specialty communications ..................                      1,008.0        11.7%            917.1         12.2%              90.9          9.9%
                                                               ______________               ______________                 ______________
                                                               $8,621.4                     $7,536.3                       $1,085.1           14.4%
                                                               ______________               ______________                 ______________     _______
                                                               ______________               ______________                 ______________     _______
     Operating Expenses: Our 2003 worldwide operating expense increased $1,024.5 million, or 15.9%, to
$7,456.7 million from $6,432.2 million in 2002, as shown below.
                                                                                       (Dollars in millions)
                                                           _________________________________________________________________________
                                                                      2003                       2002               2003 vs 2002
                                                           __________________________ __________________________ _________________
                                                                               % of                       % of
                                                                       % of Total Op.             % of Total Op.    $          %
                                                           Revenue Revenue Costs       Revenue Revenue Costs     Growth     Growth
                                                           ________ ________ _______ ________ ________ _______ _______      _______
Revenue .......................................... $8,621.4                              $7,536.3                            $1,085.1 14.4%
Operating expenses:
  Salary and service costs ..............           5,839.0             67.7% 78.3% 4,952.9                  65.7% 77.0%       886.1 17.9%
  Office and general expenses........ ______________1,617.7             18.8% 21.7% ______________
                                                                                        1,479.3              19.6% 23.0% ______________ _______
                                                                                                                               138.4 9.4%
                                                                        _______ _______                      _______ _______
Total Operating Costs......................         7,456.7             86.5%           6,432.2              85.3%           1,024.5 15.9%
Operating profit .............................. ______________
                                                $1,164.7                13.5%            $1,104.1            14.7%           $ 60.6             5.5%
                                                                                         ______________                      ______________
                                                ______________                           ______________                      ______________
      Salary and service costs represent the largest part of operating expenses. During 2003, we have continued
to invest in our businesses and their personnel, and have taken action to reduce costs at some of our companies
to deal with the changing economic circumstances. As a percentage of operating expenses, salary and service
costs were 78.3% in 2003 and 77.0% in 2002. These costs are comprised of direct service costs and salary and
related costs. Most, or 86.5%, of the $1,024.5 million increase in operating expenses in 2003 resulted from
increases in salary and service costs. The $886.1 million increase in salary and service costs was attributable to
increased revenue levels, including changes in the mix of our revenues which resulted in greater utilization of
freelance labor. In addition, although we incurred increased severance costs and did not reach optimal utilization


                                                                                11
levels for our staff, we continued to make investments in new key personnel. Furthermore, we increased
incentive compensation where performance dictated. As a result, salary and service costs as a percentage of
revenues increased year-to-year from 65.7% in 2002 to 67.7% in 2003.
       Office and general expenses represented 21.7% and 23.0% of our operating expenses in 2003 and 2002,
respectively. These costs are comprised of office and equipment rent, depreciation and amortization of other
intangibles, professional fees and other overhead expenses. As a percentage of revenue, office and general
expenses decreased in 2003 from 19.6% to 18.8%. This year-over-year decrease, which was offset by increases
in professional fees and amortization of other intangible assets, resulted from our continuing efforts to better
align these costs with business levels on a location-by-location basis, as well as from increased revenue levels.
       For the foregoing reasons, as well as changes in our business mix, our operating margin decreased from
14.7% in 2002 to 13.5% in 2003.
       We expect our efforts to control operating expenses will continue, but we anticipate that it will remain
difficult. Accordingly, we continue to look for ways to increase the variability of our cost structure. We are
hopeful that with the continuing improvements in the U.S. economy combined with the cost reduction actions
taken by our companies, margins should begin to stabilize.
       Net Interest Expense: Our net interest expense increased in 2003 to $42.8 million, as compared to
$30.5 million in 2002. Our gross interest expense increased by $12.4 million to $57.9 million. This increase
resulted from the additional interest costs associated with our payments on February 21, 2003, of $30 per $1,000
principal amount of our Liquid Yield Option Notes due 2031 and, on August 6, 2003, of $7.50 per $1,000
principal amount of our Zero Coupon Zero Yield Convertible Notes due 2032 as incentives to the holders not to
exercise their put rights. These payments to qualified noteholders amounted to $25.4 million and $6.7 million,
respectively, and are being amortized ratably over 12-month periods. In addition, interest expense relative to the
€152.4 million 5.20% Euro note increased by $2.2 million due to the change in the value of the Euro relative to
the U.S. dollar in 2003. These increases were partially offset by marginally lower short-term interest rates and
cash management efforts during the course of the year.
      The amortization of the February and August 2003 payments increased interest expense by $25.4 million
for the full-year 2003 compared to 2002. These payments will also impact 2004 by approximately $6.7 million.
      See “Liquidity and Capital Resources” for a discussion of our indebtedness and related matters.
      Income Taxes: Our consolidated effective income tax rate was 34.0% in 2003 as compared to 35.0% in
2002. This reduction reflects the realization of our ongoing focus on tax planning initiatives including a
reduction of the inefficiencies of our international and state tax structures.


                                                       12
Financial Results from Operations — 2002 Compared with 2001
      Certain reclassifications have been made to the 2002 and 2001 reported amounts to conform them to the
2003 presentation. In addition, as discussed in footnote 13 of the notes to our consolidated financial statements,
as required by SFAS 142, beginning with our 2002 results goodwill and other intangible assets that have
indefinite lives are not amortized. In addition to discussing 2002 and 2001 on a reported basis and to make the
discussion of periods comparable, our 2001 income statement information in the discussion that follows has
been adjusted to eliminate goodwill amortization as presented in the following table. As a result of these
adjustments, this presentation is a non-GAAP financial measure. We believe that the table below presents
selected financial data that is more comparable year-to-year and thus more meaningful for purposes of analysis.
                                                                                              (Dollars in millions, except per share amounts)
                                                                                                                     2001
                                                                                           _____________________________________________
                                                                                             GAAP                                     Non-GAAP
                                                                                               As                   Goodwill             As
   Twelve Months Ended December 31,                              2002                       Reported             Amortization         Adjusted(a)
                                                                 _____                     _________             ____________        ___________
   Revenue ................................................. $7,536.3                      $6,889.4                    $—                   $6,889.4
   Operating expenses:
     Salary and service costs....................              4,952.9                       4,420.9                        —                 4,420.9
     Office and general expenses ............. ______________  1,479.3                       1,500.3                     94.8                 1,405.5
                                                                                           ______________              _________            ______________
                                                               6,432.2                       5,921.2                     94.8                 5,826.4
                                                             ______________                ______________              _________            ______________
   Operating profit .....................................   1,104.1                             968.2                    94.8                 1,063.0
   Net interest expense:
     Interest expense ................................           45.5                             90.9                      —                      90.9
     Interest income ................................. ______________
                                                                (15.0)                           (18.1)                     —                     (18.1)
                                                                                           ______________              _________            ______________
                                                                 30.5                             72.8                      —                      72.8
                                                          ______________                   ______________              _________            ______________
   Income before income taxes..................             1,073.6                             895.4                    94.8                    990.2
   Income taxes.......................................... ______________
                                                               375.6                            352.1                    13.0                    365.1
                                                                                           ______________              _________            ______________
   Income after income taxes.....................                  698.0                        543.3                    81.8                       625.1
   Equity in earnings of affiliates ..............                   13.8                         12.6                     2.8                     15.4
   Minority interests .................................. ______________
                                                                    (68.3)                       (52.8)                   (1.5)                   (54.3)
                                                                                           ______________              _________            ______________
      Net income........................................ $ 643.5                           $ 503.1                     $83.1                $ 586.2
                                                              ______________               ______________              _________            ______________
                                                              ______________               ______________              _________            ______________
   Net Income Per Common Share:
      Basic .................................................      $3.46                        $2.75                    0.46                   $3.21
      Diluted ..............................................         3.44                        2.70                    0.43                    3.13
   Dividends Declared Per Common Share .                         $0.800                        $0.775                      —                   $0.775

(a) Excludes amortization of goodwill and related tax impact.

      Revenue: Our 2002 consolidated worldwide revenue increased 9.4% to $7,536.3 million from
$6,889.4 million in 2001. The effect of acquisitions, net of disposals, increased 2002 worldwide revenue by
$362.5 million. Internal/organic growth increased worldwide revenue by $193.1 million, and foreign exchange
impacts increased worldwide revenue by $91.3 million. The components of total 2002 revenue growth in the
U.S. (“domestic”) and the remainder of the world (“international”) are summarized below ($ in millions):
                                                                       Total                              Domestic                     International
                                                                ___________________                 ___________________            ___________________
                                                                    $           %                       $          %                   $           %
                                                                ________     _______                ________    _______            ________     ________
   December 31, 2001................................            $6,889.4               —            $3,717.0          —            $3,172.4             —
   Components of Revenue Changes:
   Foreign exchange impact.......................                      91.3            1.3%                   —         —                 91.3          2.9%
   Acquisitions ...........................................          362.5             5.3%              269.1         7.3%               93.4          2.9%
   Organic...................................................        193.1             2.8%              298.5         8.0%            (105.4)         (3.4)%
                                                                ______________        ______        ______________   _______       ______________     _______
   December 31, 2002................................            $7,536.3               9.4%         $4,284.6         15.3%         $3,251.7             2.4%
                                                                ______________        ______        ______________   _______       ______________     _______
                                                                ______________        ______        ______________   _______       ______________     _______


                                                                                 13
The components and percentages are calculated as follows:
     •   The foreign exchange impact component shown in the table is calculated by first converting the current
         period’s local currency revenue using the average exchange rates from the equivalent prior period to
         arrive at a constant currency revenue (in this case $7,445.0 million for the Total column in the table).
         The foreign exchange impact equals the difference between the current period revenue in U.S. dollars
         and the current period revenue in constant currency (in this case $7,536.3 million less $7,445.0 million
         for the Total column in the table).
     •   The acquisition component shown in the table is calculated by aggregating the applicable prior period
         revenue of the acquired businesses. Netted against this number is the revenue of any business included
         in the prior period reported revenue that was disposed of subsequent to the prior period.
     •   The organic component shown in the table is calculated by subtracting both the foreign exchange and
         acquisition revenue components from total revenue growth.
     •   The percentage change shown in the table of each component is calculated by dividing the individual
         component amount by the prior period revenue base of that component (in this case $6,889.4 million
         for the Total column in the table).
     The components of revenue and revenue growth for 2002 compared to 2001, in our primary geographic
markets are summarized below ($ in millions):
                                                                                                    $ Revenue        % Growth
                                                                                                    _________        _________
                United States ..............................................................        $4,284.6          15.3%
                Euro Markets..............................................................            1,458.6           3.2%
                United Kingdom ........................................................                  814.1          1.1%
                Other ..........................................................................         979.0          2.7%
                                                                                                    ______________    _______
                Total ...........................................................................   $7,536.3            9.4%
                                                                                                    ______________    _______
                                                                                                    ______________    _______
       As indicated, foreign exchange impacts increased our international revenue by $91.3 million for 2002. The
most significant impacts resulted from the strengthening of the Euro and the British Pound against the U.S.
dollar, as our operations in these markets represented approximately 70.0% of our international revenue. This
was partially offset by the strengthening of the U.S. dollar against the Brazilian Real. Additional geographic
information relating to our business is contained in note 5 to our consolidated financial statements at page F-15
of this report.
      Comparisons of 2002 results to the prior year needs to be made in the context of the events of
September 11, 2001, which had a significant adverse impact on our business in the third quarter of 2001. The
adverse impact of September 11, 2001, was less significant in the fourth quarter of 2001 and management
believes that the fourth quarter of 2001 also benefited from other short-term economic stimuli and delayed
spending from the third quarter of 2001. The impact of these factors on our business and our 2002 and 2001
results of operations is more fully discussed below.
      Due to our multiple independent agency structure and the breadth of our service offerings and geographic
reach, our agencies have more than 5,000 active client relationships in the aggregate. Revenue from our single
largest client in 2002 increased by 2.4%. This client represented 5.0% of worldwide revenue in 2002 and 5.4%
in 2001 and no other client represented more than 2.5% in 2002 and 2001. Our ten largest and 250 largest clients
represented 17.9% and 53.4% of our 2002 worldwide revenue, respectively and 17.0% and 50.6% of our 2001
worldwide revenue.


                                                                            14
omnicare annual reports 2003

More Related Content

What's hot

alltel 2q 07_Supplement
alltel  2q 07_Supplementalltel  2q 07_Supplement
alltel 2q 07_Supplementfinance27
 
Q1 2009 Earning Report of Baldor Electric Company
Q1 2009 Earning Report of Baldor Electric Company Q1 2009 Earning Report of Baldor Electric Company
Q1 2009 Earning Report of Baldor Electric Company earningreport earningreport
 
omnicom group Q3 2005 Investor Presentation
omnicom group  Q3 2005 Investor Presentationomnicom group  Q3 2005 Investor Presentation
omnicom group Q3 2005 Investor Presentationfinance22
 
burlington northern santa fe 4Q 2008 Investors Report
 burlington northern santa fe 4Q 2008 Investors Report burlington northern santa fe 4Q 2008 Investors Report
burlington northern santa fe 4Q 2008 Investors Reportfinance16
 
3q07_Supplement
3q07_Supplement3q07_Supplement
3q07_Supplementfinance27
 
Yahoo! 2 Q 2007 Earnings Presentation
Yahoo! 2 Q 2007 Earnings PresentationYahoo! 2 Q 2007 Earnings Presentation
Yahoo! 2 Q 2007 Earnings Presentationeraz
 
clearchannel 33
clearchannel 33clearchannel 33
clearchannel 33finance31
 
clearchannel 35
clearchannel 35clearchannel 35
clearchannel 35finance31
 
bnsf 3Q 2008 Investors Report
bnsf 3Q 2008 Investors Reportbnsf 3Q 2008 Investors Report
bnsf 3Q 2008 Investors Reportfinance16
 
bnsf 3Q 2007 investors_Report
bnsf 3Q 2007 investors_Reportbnsf 3Q 2007 investors_Report
bnsf 3Q 2007 investors_Reportfinance16
 
JPMorgan Chase Second Quarter 2008 Financial Results Conference Call
JPMorgan Chase Second Quarter 2008 Financial Results Conference CallJPMorgan Chase Second Quarter 2008 Financial Results Conference Call
JPMorgan Chase Second Quarter 2008 Financial Results Conference Callfinance2
 
alltel 1q 07_Supplement
alltel  1q 07_Supplementalltel  1q 07_Supplement
alltel 1q 07_Supplementfinance27
 
bnsf 4Q 2006 Investors Report
bnsf 4Q 2006 Investors Reportbnsf 4Q 2006 Investors Report
bnsf 4Q 2006 Investors Reportfinance16
 
raytheon Q3 Earnings Release
raytheon Q3 Earnings Releaseraytheon Q3 Earnings Release
raytheon Q3 Earnings Releasefinance12
 
4Q_2005_Investors_Report
4Q_2005_Investors_Report4Q_2005_Investors_Report
4Q_2005_Investors_Reportfinance16
 
omnicom group Q3 2006 Earnings Release
omnicom group  Q3 2006 Earnings Releaseomnicom group  Q3 2006 Earnings Release
omnicom group Q3 2006 Earnings Releasefinance22
 
bnsf 4Q 2007 Investors Report
bnsf 4Q 2007 Investors Reportbnsf 4Q 2007 Investors Report
bnsf 4Q 2007 Investors Reportfinance16
 

What's hot (17)

alltel 2q 07_Supplement
alltel  2q 07_Supplementalltel  2q 07_Supplement
alltel 2q 07_Supplement
 
Q1 2009 Earning Report of Baldor Electric Company
Q1 2009 Earning Report of Baldor Electric Company Q1 2009 Earning Report of Baldor Electric Company
Q1 2009 Earning Report of Baldor Electric Company
 
omnicom group Q3 2005 Investor Presentation
omnicom group  Q3 2005 Investor Presentationomnicom group  Q3 2005 Investor Presentation
omnicom group Q3 2005 Investor Presentation
 
burlington northern santa fe 4Q 2008 Investors Report
 burlington northern santa fe 4Q 2008 Investors Report burlington northern santa fe 4Q 2008 Investors Report
burlington northern santa fe 4Q 2008 Investors Report
 
3q07_Supplement
3q07_Supplement3q07_Supplement
3q07_Supplement
 
Yahoo! 2 Q 2007 Earnings Presentation
Yahoo! 2 Q 2007 Earnings PresentationYahoo! 2 Q 2007 Earnings Presentation
Yahoo! 2 Q 2007 Earnings Presentation
 
clearchannel 33
clearchannel 33clearchannel 33
clearchannel 33
 
clearchannel 35
clearchannel 35clearchannel 35
clearchannel 35
 
bnsf 3Q 2008 Investors Report
bnsf 3Q 2008 Investors Reportbnsf 3Q 2008 Investors Report
bnsf 3Q 2008 Investors Report
 
bnsf 3Q 2007 investors_Report
bnsf 3Q 2007 investors_Reportbnsf 3Q 2007 investors_Report
bnsf 3Q 2007 investors_Report
 
JPMorgan Chase Second Quarter 2008 Financial Results Conference Call
JPMorgan Chase Second Quarter 2008 Financial Results Conference CallJPMorgan Chase Second Quarter 2008 Financial Results Conference Call
JPMorgan Chase Second Quarter 2008 Financial Results Conference Call
 
alltel 1q 07_Supplement
alltel  1q 07_Supplementalltel  1q 07_Supplement
alltel 1q 07_Supplement
 
bnsf 4Q 2006 Investors Report
bnsf 4Q 2006 Investors Reportbnsf 4Q 2006 Investors Report
bnsf 4Q 2006 Investors Report
 
raytheon Q3 Earnings Release
raytheon Q3 Earnings Releaseraytheon Q3 Earnings Release
raytheon Q3 Earnings Release
 
4Q_2005_Investors_Report
4Q_2005_Investors_Report4Q_2005_Investors_Report
4Q_2005_Investors_Report
 
omnicom group Q3 2006 Earnings Release
omnicom group  Q3 2006 Earnings Releaseomnicom group  Q3 2006 Earnings Release
omnicom group Q3 2006 Earnings Release
 
bnsf 4Q 2007 Investors Report
bnsf 4Q 2007 Investors Reportbnsf 4Q 2007 Investors Report
bnsf 4Q 2007 Investors Report
 

Viewers also liked

Optimize your Content - SEO Your Site
Optimize your Content - SEO Your SiteOptimize your Content - SEO Your Site
Optimize your Content - SEO Your SiteCaitlin Jeansonne
 
J Greene Portfolio 2008
J Greene Portfolio 2008J Greene Portfolio 2008
J Greene Portfolio 2008archisonic
 
Credit Suisse Presentation
Credit Suisse PresentationCredit Suisse Presentation
Credit Suisse Presentationfinance48
 
CloroxAR08_Editorial
CloroxAR08_EditorialCloroxAR08_Editorial
CloroxAR08_Editorialfinance48
 
Jahresrückblick 2012 PHP Usergroup Hamburg
Jahresrückblick 2012 PHP Usergroup HamburgJahresrückblick 2012 PHP Usergroup Hamburg
Jahresrückblick 2012 PHP Usergroup HamburgFrank Sons
 
Trabalho De Matematica Completo
Trabalho De Matematica CompletoTrabalho De Matematica Completo
Trabalho De Matematica Completogueste1a09a
 
SEO Content Strategy for 2012 & Beyond - Presentation to Little Rock Chapter ...
SEO Content Strategy for 2012 & Beyond - Presentation to Little Rock Chapter ...SEO Content Strategy for 2012 & Beyond - Presentation to Little Rock Chapter ...
SEO Content Strategy for 2012 & Beyond - Presentation to Little Rock Chapter ...Caitlin Jeansonne
 
Lessons in Website Management for PR Pros - PRSA Southwest District Conference
Lessons in Website Management for PR Pros - PRSA Southwest District ConferenceLessons in Website Management for PR Pros - PRSA Southwest District Conference
Lessons in Website Management for PR Pros - PRSA Southwest District ConferenceCaitlin Jeansonne
 
Digital business #2
Digital business #2Digital business #2
Digital business #2finanzas_uca
 
Leermeester Centraal Leermeesterdag NN 8-3-2011
Leermeester Centraal Leermeesterdag NN 8-3-2011Leermeester Centraal Leermeesterdag NN 8-3-2011
Leermeester Centraal Leermeesterdag NN 8-3-2011Johan Lapidaire
 
SVH In Vogelvlucht Voor Albeda
SVH In Vogelvlucht Voor AlbedaSVH In Vogelvlucht Voor Albeda
SVH In Vogelvlucht Voor AlbedaJohan Lapidaire
 
Intro to Search Engine Optimization - Association of Proposal Management Prof...
Intro to Search Engine Optimization - Association of Proposal Management Prof...Intro to Search Engine Optimization - Association of Proposal Management Prof...
Intro to Search Engine Optimization - Association of Proposal Management Prof...Caitlin Jeansonne
 
Прототип сайта Paymantix 06 2014(ver.3)
Прототип сайта Paymantix 06 2014(ver.3)Прототип сайта Paymantix 06 2014(ver.3)
Прототип сайта Paymantix 06 2014(ver.3)Vadim Andreev
 
やはり日本の技術基準適合証明はまちがっている?
やはり日本の技術基準適合証明はまちがっている?やはり日本の技術基準適合証明はまちがっている?
やはり日本の技術基準適合証明はまちがっている?Yoshitake Takata
 
PM processing 03 2015(eng)
PM processing 03 2015(eng)PM processing 03 2015(eng)
PM processing 03 2015(eng)Vadim Andreev
 
S Pr Ookjes Rsg Lingecollege 2 2011
S Pr Ookjes Rsg Lingecollege 2 2011S Pr Ookjes Rsg Lingecollege 2 2011
S Pr Ookjes Rsg Lingecollege 2 2011Johan Lapidaire
 

Viewers also liked (20)

Optimize your Content - SEO Your Site
Optimize your Content - SEO Your SiteOptimize your Content - SEO Your Site
Optimize your Content - SEO Your Site
 
J Greene Portfolio 2008
J Greene Portfolio 2008J Greene Portfolio 2008
J Greene Portfolio 2008
 
Credit Suisse Presentation
Credit Suisse PresentationCredit Suisse Presentation
Credit Suisse Presentation
 
The Americas 2
The Americas 2The Americas 2
The Americas 2
 
CloroxAR08_Editorial
CloroxAR08_EditorialCloroxAR08_Editorial
CloroxAR08_Editorial
 
Oof Epowerpoint
Oof EpowerpointOof Epowerpoint
Oof Epowerpoint
 
Jahresrückblick 2012 PHP Usergroup Hamburg
Jahresrückblick 2012 PHP Usergroup HamburgJahresrückblick 2012 PHP Usergroup Hamburg
Jahresrückblick 2012 PHP Usergroup Hamburg
 
Trabalho De Matematica Completo
Trabalho De Matematica CompletoTrabalho De Matematica Completo
Trabalho De Matematica Completo
 
Wishes
WishesWishes
Wishes
 
SEO Content Strategy for 2012 & Beyond - Presentation to Little Rock Chapter ...
SEO Content Strategy for 2012 & Beyond - Presentation to Little Rock Chapter ...SEO Content Strategy for 2012 & Beyond - Presentation to Little Rock Chapter ...
SEO Content Strategy for 2012 & Beyond - Presentation to Little Rock Chapter ...
 
Lessons in Website Management for PR Pros - PRSA Southwest District Conference
Lessons in Website Management for PR Pros - PRSA Southwest District ConferenceLessons in Website Management for PR Pros - PRSA Southwest District Conference
Lessons in Website Management for PR Pros - PRSA Southwest District Conference
 
Digital business #2
Digital business #2Digital business #2
Digital business #2
 
Leermeester Centraal Leermeesterdag NN 8-3-2011
Leermeester Centraal Leermeesterdag NN 8-3-2011Leermeester Centraal Leermeesterdag NN 8-3-2011
Leermeester Centraal Leermeesterdag NN 8-3-2011
 
SVH In Vogelvlucht Voor Albeda
SVH In Vogelvlucht Voor AlbedaSVH In Vogelvlucht Voor Albeda
SVH In Vogelvlucht Voor Albeda
 
Intro to Search Engine Optimization - Association of Proposal Management Prof...
Intro to Search Engine Optimization - Association of Proposal Management Prof...Intro to Search Engine Optimization - Association of Proposal Management Prof...
Intro to Search Engine Optimization - Association of Proposal Management Prof...
 
Прототип сайта Paymantix 06 2014(ver.3)
Прототип сайта Paymantix 06 2014(ver.3)Прототип сайта Paymantix 06 2014(ver.3)
Прототип сайта Paymantix 06 2014(ver.3)
 
Educational Podcasting
Educational PodcastingEducational Podcasting
Educational Podcasting
 
やはり日本の技術基準適合証明はまちがっている?
やはり日本の技術基準適合証明はまちがっている?やはり日本の技術基準適合証明はまちがっている?
やはり日本の技術基準適合証明はまちがっている?
 
PM processing 03 2015(eng)
PM processing 03 2015(eng)PM processing 03 2015(eng)
PM processing 03 2015(eng)
 
S Pr Ookjes Rsg Lingecollege 2 2011
S Pr Ookjes Rsg Lingecollege 2 2011S Pr Ookjes Rsg Lingecollege 2 2011
S Pr Ookjes Rsg Lingecollege 2 2011
 

Similar to omnicare annual reports 2003

omnicare annual reports 2002
omnicare annual reports 2002omnicare annual reports 2002
omnicare annual reports 2002finance46
 
omnicare annual reports 2004
omnicare annual reports 2004omnicare annual reports 2004
omnicare annual reports 2004finance46
 
omnicare annual reports 2005
omnicare annual reports 2005omnicare annual reports 2005
omnicare annual reports 2005finance46
 
Progressive 1Q 05 QSR
Progressive 1Q 05 QSRProgressive 1Q 05 QSR
Progressive 1Q 05 QSRfinance18
 
Progressive 1Q 05 QSR
Progressive 1Q 05 QSRProgressive 1Q 05 QSR
Progressive 1Q 05 QSRfinance18
 
dollar general annual reports 2002
dollar general annual reports 2002dollar general annual reports 2002
dollar general annual reports 2002finance41
 
bed bath&beyond 2002ar
bed bath&beyond 2002arbed bath&beyond 2002ar
bed bath&beyond 2002arfinance44
 
bed bath&beyond 2002ar
bed bath&beyond 2002arbed bath&beyond 2002ar
bed bath&beyond 2002arfinance44
 
omnicom group annual reports 2006
omnicom group annual reports 2006omnicom group annual reports 2006
omnicom group annual reports 2006finance22
 
omnicare annual reports 2006
omnicare annual reports 2006omnicare annual reports 2006
omnicare annual reports 2006finance46
 
Progressive 2Q 05 QSR
Progressive 2Q 05 QSRProgressive 2Q 05 QSR
Progressive 2Q 05 QSRfinance18
 
Progressive 2Q 05 QSR
Progressive 2Q 05 QSRProgressive 2Q 05 QSR
Progressive 2Q 05 QSRfinance18
 
Progressive 2Q04 QSR
Progressive  2Q04 QSRProgressive  2Q04 QSR
Progressive 2Q04 QSRfinance18
 
Progressive 2Q04 QSR
Progressive 2Q04 QSRProgressive 2Q04 QSR
Progressive 2Q04 QSRfinance18
 
omnicom group 2007 Annual Report
omnicom group 2007 Annual Reportomnicom group 2007 Annual Report
omnicom group 2007 Annual Reportfinance22
 
omnicare annual reports 2007
omnicare annual reports 2007omnicare annual reports 2007
omnicare annual reports 2007finance46
 
Final earnings presentation_conf_call_slides_1_q2013
Final earnings presentation_conf_call_slides_1_q2013Final earnings presentation_conf_call_slides_1_q2013
Final earnings presentation_conf_call_slides_1_q2013United_Stationers
 
Masco Annual Report2003
Masco Annual Report2003Masco Annual Report2003
Masco Annual Report2003finance23
 
Progressive-1Q 06 QSR
Progressive-1Q 06 QSRProgressive-1Q 06 QSR
Progressive-1Q 06 QSRfinance18
 
Progressive-1Q 06 QSR
Progressive-1Q 06 QSRProgressive-1Q 06 QSR
Progressive-1Q 06 QSRfinance18
 

Similar to omnicare annual reports 2003 (20)

omnicare annual reports 2002
omnicare annual reports 2002omnicare annual reports 2002
omnicare annual reports 2002
 
omnicare annual reports 2004
omnicare annual reports 2004omnicare annual reports 2004
omnicare annual reports 2004
 
omnicare annual reports 2005
omnicare annual reports 2005omnicare annual reports 2005
omnicare annual reports 2005
 
Progressive 1Q 05 QSR
Progressive 1Q 05 QSRProgressive 1Q 05 QSR
Progressive 1Q 05 QSR
 
Progressive 1Q 05 QSR
Progressive 1Q 05 QSRProgressive 1Q 05 QSR
Progressive 1Q 05 QSR
 
dollar general annual reports 2002
dollar general annual reports 2002dollar general annual reports 2002
dollar general annual reports 2002
 
bed bath&beyond 2002ar
bed bath&beyond 2002arbed bath&beyond 2002ar
bed bath&beyond 2002ar
 
bed bath&beyond 2002ar
bed bath&beyond 2002arbed bath&beyond 2002ar
bed bath&beyond 2002ar
 
omnicom group annual reports 2006
omnicom group annual reports 2006omnicom group annual reports 2006
omnicom group annual reports 2006
 
omnicare annual reports 2006
omnicare annual reports 2006omnicare annual reports 2006
omnicare annual reports 2006
 
Progressive 2Q 05 QSR
Progressive 2Q 05 QSRProgressive 2Q 05 QSR
Progressive 2Q 05 QSR
 
Progressive 2Q 05 QSR
Progressive 2Q 05 QSRProgressive 2Q 05 QSR
Progressive 2Q 05 QSR
 
Progressive 2Q04 QSR
Progressive  2Q04 QSRProgressive  2Q04 QSR
Progressive 2Q04 QSR
 
Progressive 2Q04 QSR
Progressive 2Q04 QSRProgressive 2Q04 QSR
Progressive 2Q04 QSR
 
omnicom group 2007 Annual Report
omnicom group 2007 Annual Reportomnicom group 2007 Annual Report
omnicom group 2007 Annual Report
 
omnicare annual reports 2007
omnicare annual reports 2007omnicare annual reports 2007
omnicare annual reports 2007
 
Final earnings presentation_conf_call_slides_1_q2013
Final earnings presentation_conf_call_slides_1_q2013Final earnings presentation_conf_call_slides_1_q2013
Final earnings presentation_conf_call_slides_1_q2013
 
Masco Annual Report2003
Masco Annual Report2003Masco Annual Report2003
Masco Annual Report2003
 
Progressive-1Q 06 QSR
Progressive-1Q 06 QSRProgressive-1Q 06 QSR
Progressive-1Q 06 QSR
 
Progressive-1Q 06 QSR
Progressive-1Q 06 QSRProgressive-1Q 06 QSR
Progressive-1Q 06 QSR
 

More from finance46

autozone Ethicsmodel
autozone  Ethicsmodelautozone  Ethicsmodel
autozone Ethicsmodelfinance46
 
autozone Ethicsmodel
autozone  Ethicsmodelautozone  Ethicsmodel
autozone Ethicsmodelfinance46
 
autozone articles
autozone  articlesautozone  articles
autozone articlesfinance46
 
autozone articles
autozone  articlesautozone  articles
autozone articlesfinance46
 
autozone Bylaws4
autozone  Bylaws4autozone  Bylaws4
autozone Bylaws4finance46
 
autozone CorpGovernanceOverview020507
autozone  CorpGovernanceOverview020507autozone  CorpGovernanceOverview020507
autozone CorpGovernanceOverview020507finance46
 
autozone Bylaws4
autozone  Bylaws4autozone  Bylaws4
autozone Bylaws4finance46
 
autozone CorpGovernanceOverview020507
autozone  CorpGovernanceOverview020507autozone  CorpGovernanceOverview020507
autozone CorpGovernanceOverview020507finance46
 
autozone CodeofConductFY2008_Spanish
autozone  CodeofConductFY2008_Spanishautozone  CodeofConductFY2008_Spanish
autozone CodeofConductFY2008_Spanishfinance46
 
autozone CodeofConductFY2008_Spanish
autozone  CodeofConductFY2008_Spanishautozone  CodeofConductFY2008_Spanish
autozone CodeofConductFY2008_Spanishfinance46
 
autozone CodeofConductFY2008_English
autozone  CodeofConductFY2008_Englishautozone  CodeofConductFY2008_English
autozone CodeofConductFY2008_Englishfinance46
 
autozone CodeofConductFY2008_English
autozone  CodeofConductFY2008_Englishautozone  CodeofConductFY2008_English
autozone CodeofConductFY2008_Englishfinance46
 
autozone CorporateGovernancePrinciples1208
autozone  CorporateGovernancePrinciples1208autozone  CorporateGovernancePrinciples1208
autozone CorporateGovernancePrinciples1208finance46
 
autozone CorporateGovernancePrinciples1208
autozone  CorporateGovernancePrinciples1208autozone  CorporateGovernancePrinciples1208
autozone CorporateGovernancePrinciples1208finance46
 
autozone Q1F09_Slides_to_Script
autozone   Q1F09_Slides_to_Scriptautozone   Q1F09_Slides_to_Script
autozone Q1F09_Slides_to_Scriptfinance46
 
autozone 45E1C146-74DD-4D77-B8DB-AFBFCDEC97CA_ShareholdersMeeting_121708
autozone   45E1C146-74DD-4D77-B8DB-AFBFCDEC97CA_ShareholdersMeeting_121708autozone   45E1C146-74DD-4D77-B8DB-AFBFCDEC97CA_ShareholdersMeeting_121708
autozone 45E1C146-74DD-4D77-B8DB-AFBFCDEC97CA_ShareholdersMeeting_121708finance46
 
autozone g64620ars
autozone  g64620ars autozone  g64620ars
autozone g64620ars finance46
 
autozone AZO_2001
autozone  AZO_2001autozone  AZO_2001
autozone AZO_2001finance46
 
autozone annual
autozone  annualautozone  annual
autozone annualfinance46
 
autozone AZO_2002
autozone  AZO_2002autozone  AZO_2002
autozone AZO_2002finance46
 

More from finance46 (20)

autozone Ethicsmodel
autozone  Ethicsmodelautozone  Ethicsmodel
autozone Ethicsmodel
 
autozone Ethicsmodel
autozone  Ethicsmodelautozone  Ethicsmodel
autozone Ethicsmodel
 
autozone articles
autozone  articlesautozone  articles
autozone articles
 
autozone articles
autozone  articlesautozone  articles
autozone articles
 
autozone Bylaws4
autozone  Bylaws4autozone  Bylaws4
autozone Bylaws4
 
autozone CorpGovernanceOverview020507
autozone  CorpGovernanceOverview020507autozone  CorpGovernanceOverview020507
autozone CorpGovernanceOverview020507
 
autozone Bylaws4
autozone  Bylaws4autozone  Bylaws4
autozone Bylaws4
 
autozone CorpGovernanceOverview020507
autozone  CorpGovernanceOverview020507autozone  CorpGovernanceOverview020507
autozone CorpGovernanceOverview020507
 
autozone CodeofConductFY2008_Spanish
autozone  CodeofConductFY2008_Spanishautozone  CodeofConductFY2008_Spanish
autozone CodeofConductFY2008_Spanish
 
autozone CodeofConductFY2008_Spanish
autozone  CodeofConductFY2008_Spanishautozone  CodeofConductFY2008_Spanish
autozone CodeofConductFY2008_Spanish
 
autozone CodeofConductFY2008_English
autozone  CodeofConductFY2008_Englishautozone  CodeofConductFY2008_English
autozone CodeofConductFY2008_English
 
autozone CodeofConductFY2008_English
autozone  CodeofConductFY2008_Englishautozone  CodeofConductFY2008_English
autozone CodeofConductFY2008_English
 
autozone CorporateGovernancePrinciples1208
autozone  CorporateGovernancePrinciples1208autozone  CorporateGovernancePrinciples1208
autozone CorporateGovernancePrinciples1208
 
autozone CorporateGovernancePrinciples1208
autozone  CorporateGovernancePrinciples1208autozone  CorporateGovernancePrinciples1208
autozone CorporateGovernancePrinciples1208
 
autozone Q1F09_Slides_to_Script
autozone   Q1F09_Slides_to_Scriptautozone   Q1F09_Slides_to_Script
autozone Q1F09_Slides_to_Script
 
autozone 45E1C146-74DD-4D77-B8DB-AFBFCDEC97CA_ShareholdersMeeting_121708
autozone   45E1C146-74DD-4D77-B8DB-AFBFCDEC97CA_ShareholdersMeeting_121708autozone   45E1C146-74DD-4D77-B8DB-AFBFCDEC97CA_ShareholdersMeeting_121708
autozone 45E1C146-74DD-4D77-B8DB-AFBFCDEC97CA_ShareholdersMeeting_121708
 
autozone g64620ars
autozone  g64620ars autozone  g64620ars
autozone g64620ars
 
autozone AZO_2001
autozone  AZO_2001autozone  AZO_2001
autozone AZO_2001
 
autozone annual
autozone  annualautozone  annual
autozone annual
 
autozone AZO_2002
autozone  AZO_2002autozone  AZO_2002
autozone AZO_2002
 

Recently uploaded

(办理学位证)加拿大萨省大学毕业证成绩单原版一比一
(办理学位证)加拿大萨省大学毕业证成绩单原版一比一(办理学位证)加拿大萨省大学毕业证成绩单原版一比一
(办理学位证)加拿大萨省大学毕业证成绩单原版一比一S SDS
 
Russian Call Girls In Gtb Nagar (Delhi) 9711199012 💋✔💕😘 Naughty Call Girls Se...
Russian Call Girls In Gtb Nagar (Delhi) 9711199012 💋✔💕😘 Naughty Call Girls Se...Russian Call Girls In Gtb Nagar (Delhi) 9711199012 💋✔💕😘 Naughty Call Girls Se...
Russian Call Girls In Gtb Nagar (Delhi) 9711199012 💋✔💕😘 Naughty Call Girls Se...shivangimorya083
 
20240417-Calibre-April-2024-Investor-Presentation.pdf
20240417-Calibre-April-2024-Investor-Presentation.pdf20240417-Calibre-April-2024-Investor-Presentation.pdf
20240417-Calibre-April-2024-Investor-Presentation.pdfAdnet Communications
 
Q3 2024 Earnings Conference Call and Webcast Slides
Q3 2024 Earnings Conference Call and Webcast SlidesQ3 2024 Earnings Conference Call and Webcast Slides
Q3 2024 Earnings Conference Call and Webcast SlidesMarketing847413
 
Quantitative Analysis of Retail Sector Companies
Quantitative Analysis of Retail Sector CompaniesQuantitative Analysis of Retail Sector Companies
Quantitative Analysis of Retail Sector Companiesprashantbhati354
 
Interimreport1 January–31 March2024 Elo Mutual Pension Insurance Company
Interimreport1 January–31 March2024 Elo Mutual Pension Insurance CompanyInterimreport1 January–31 March2024 Elo Mutual Pension Insurance Company
Interimreport1 January–31 March2024 Elo Mutual Pension Insurance CompanyTyöeläkeyhtiö Elo
 
(DIYA) Bhumkar Chowk Call Girls Just Call 7001035870 [ Cash on Delivery ] Pun...
(DIYA) Bhumkar Chowk Call Girls Just Call 7001035870 [ Cash on Delivery ] Pun...(DIYA) Bhumkar Chowk Call Girls Just Call 7001035870 [ Cash on Delivery ] Pun...
(DIYA) Bhumkar Chowk Call Girls Just Call 7001035870 [ Cash on Delivery ] Pun...ranjana rawat
 
VIP Kolkata Call Girl Serampore 👉 8250192130 Available With Room
VIP Kolkata Call Girl Serampore 👉 8250192130  Available With RoomVIP Kolkata Call Girl Serampore 👉 8250192130  Available With Room
VIP Kolkata Call Girl Serampore 👉 8250192130 Available With Roomdivyansh0kumar0
 
Authentic No 1 Amil Baba In Pakistan Authentic No 1 Amil Baba In Karachi No 1...
Authentic No 1 Amil Baba In Pakistan Authentic No 1 Amil Baba In Karachi No 1...Authentic No 1 Amil Baba In Pakistan Authentic No 1 Amil Baba In Karachi No 1...
Authentic No 1 Amil Baba In Pakistan Authentic No 1 Amil Baba In Karachi No 1...First NO1 World Amil baba in Faisalabad
 
call girls in Nand Nagri (DELHI) 🔝 >༒9953330565🔝 genuine Escort Service 🔝✔️✔️
call girls in  Nand Nagri (DELHI) 🔝 >༒9953330565🔝 genuine Escort Service 🔝✔️✔️call girls in  Nand Nagri (DELHI) 🔝 >༒9953330565🔝 genuine Escort Service 🔝✔️✔️
call girls in Nand Nagri (DELHI) 🔝 >༒9953330565🔝 genuine Escort Service 🔝✔️✔️9953056974 Low Rate Call Girls In Saket, Delhi NCR
 
How Automation is Driving Efficiency Through the Last Mile of Reporting
How Automation is Driving Efficiency Through the Last Mile of ReportingHow Automation is Driving Efficiency Through the Last Mile of Reporting
How Automation is Driving Efficiency Through the Last Mile of ReportingAggregage
 
Classical Theory of Macroeconomics by Adam Smith
Classical Theory of Macroeconomics by Adam SmithClassical Theory of Macroeconomics by Adam Smith
Classical Theory of Macroeconomics by Adam SmithAdamYassin2
 
Lundin Gold April 2024 Corporate Presentation v4.pdf
Lundin Gold April 2024 Corporate Presentation v4.pdfLundin Gold April 2024 Corporate Presentation v4.pdf
Lundin Gold April 2024 Corporate Presentation v4.pdfAdnet Communications
 
House of Commons ; CDC schemes overview document
House of Commons ; CDC schemes overview documentHouse of Commons ; CDC schemes overview document
House of Commons ; CDC schemes overview documentHenry Tapper
 
Call Girls Service Nagpur Maya Call 7001035870 Meet With Nagpur Escorts
Call Girls Service Nagpur Maya Call 7001035870 Meet With Nagpur EscortsCall Girls Service Nagpur Maya Call 7001035870 Meet With Nagpur Escorts
Call Girls Service Nagpur Maya Call 7001035870 Meet With Nagpur Escortsranjana rawat
 
High Class Call Girls Nagpur Grishma Call 7001035870 Meet With Nagpur Escorts
High Class Call Girls Nagpur Grishma Call 7001035870 Meet With Nagpur EscortsHigh Class Call Girls Nagpur Grishma Call 7001035870 Meet With Nagpur Escorts
High Class Call Girls Nagpur Grishma Call 7001035870 Meet With Nagpur Escortsranjana rawat
 
Monthly Market Risk Update: April 2024 [SlideShare]
Monthly Market Risk Update: April 2024 [SlideShare]Monthly Market Risk Update: April 2024 [SlideShare]
Monthly Market Risk Update: April 2024 [SlideShare]Commonwealth
 
Andheri Call Girls In 9825968104 Mumbai Hot Models
Andheri Call Girls In 9825968104 Mumbai Hot ModelsAndheri Call Girls In 9825968104 Mumbai Hot Models
Andheri Call Girls In 9825968104 Mumbai Hot Modelshematsharma006
 

Recently uploaded (20)

(办理学位证)加拿大萨省大学毕业证成绩单原版一比一
(办理学位证)加拿大萨省大学毕业证成绩单原版一比一(办理学位证)加拿大萨省大学毕业证成绩单原版一比一
(办理学位证)加拿大萨省大学毕业证成绩单原版一比一
 
Russian Call Girls In Gtb Nagar (Delhi) 9711199012 💋✔💕😘 Naughty Call Girls Se...
Russian Call Girls In Gtb Nagar (Delhi) 9711199012 💋✔💕😘 Naughty Call Girls Se...Russian Call Girls In Gtb Nagar (Delhi) 9711199012 💋✔💕😘 Naughty Call Girls Se...
Russian Call Girls In Gtb Nagar (Delhi) 9711199012 💋✔💕😘 Naughty Call Girls Se...
 
20240417-Calibre-April-2024-Investor-Presentation.pdf
20240417-Calibre-April-2024-Investor-Presentation.pdf20240417-Calibre-April-2024-Investor-Presentation.pdf
20240417-Calibre-April-2024-Investor-Presentation.pdf
 
Q3 2024 Earnings Conference Call and Webcast Slides
Q3 2024 Earnings Conference Call and Webcast SlidesQ3 2024 Earnings Conference Call and Webcast Slides
Q3 2024 Earnings Conference Call and Webcast Slides
 
Quantitative Analysis of Retail Sector Companies
Quantitative Analysis of Retail Sector CompaniesQuantitative Analysis of Retail Sector Companies
Quantitative Analysis of Retail Sector Companies
 
Interimreport1 January–31 March2024 Elo Mutual Pension Insurance Company
Interimreport1 January–31 March2024 Elo Mutual Pension Insurance CompanyInterimreport1 January–31 March2024 Elo Mutual Pension Insurance Company
Interimreport1 January–31 March2024 Elo Mutual Pension Insurance Company
 
(DIYA) Bhumkar Chowk Call Girls Just Call 7001035870 [ Cash on Delivery ] Pun...
(DIYA) Bhumkar Chowk Call Girls Just Call 7001035870 [ Cash on Delivery ] Pun...(DIYA) Bhumkar Chowk Call Girls Just Call 7001035870 [ Cash on Delivery ] Pun...
(DIYA) Bhumkar Chowk Call Girls Just Call 7001035870 [ Cash on Delivery ] Pun...
 
VIP Kolkata Call Girl Serampore 👉 8250192130 Available With Room
VIP Kolkata Call Girl Serampore 👉 8250192130  Available With RoomVIP Kolkata Call Girl Serampore 👉 8250192130  Available With Room
VIP Kolkata Call Girl Serampore 👉 8250192130 Available With Room
 
Authentic No 1 Amil Baba In Pakistan Authentic No 1 Amil Baba In Karachi No 1...
Authentic No 1 Amil Baba In Pakistan Authentic No 1 Amil Baba In Karachi No 1...Authentic No 1 Amil Baba In Pakistan Authentic No 1 Amil Baba In Karachi No 1...
Authentic No 1 Amil Baba In Pakistan Authentic No 1 Amil Baba In Karachi No 1...
 
call girls in Nand Nagri (DELHI) 🔝 >༒9953330565🔝 genuine Escort Service 🔝✔️✔️
call girls in  Nand Nagri (DELHI) 🔝 >༒9953330565🔝 genuine Escort Service 🔝✔️✔️call girls in  Nand Nagri (DELHI) 🔝 >༒9953330565🔝 genuine Escort Service 🔝✔️✔️
call girls in Nand Nagri (DELHI) 🔝 >༒9953330565🔝 genuine Escort Service 🔝✔️✔️
 
🔝+919953056974 🔝young Delhi Escort service Pusa Road
🔝+919953056974 🔝young Delhi Escort service Pusa Road🔝+919953056974 🔝young Delhi Escort service Pusa Road
🔝+919953056974 🔝young Delhi Escort service Pusa Road
 
How Automation is Driving Efficiency Through the Last Mile of Reporting
How Automation is Driving Efficiency Through the Last Mile of ReportingHow Automation is Driving Efficiency Through the Last Mile of Reporting
How Automation is Driving Efficiency Through the Last Mile of Reporting
 
Commercial Bank Economic Capsule - April 2024
Commercial Bank Economic Capsule - April 2024Commercial Bank Economic Capsule - April 2024
Commercial Bank Economic Capsule - April 2024
 
Classical Theory of Macroeconomics by Adam Smith
Classical Theory of Macroeconomics by Adam SmithClassical Theory of Macroeconomics by Adam Smith
Classical Theory of Macroeconomics by Adam Smith
 
Lundin Gold April 2024 Corporate Presentation v4.pdf
Lundin Gold April 2024 Corporate Presentation v4.pdfLundin Gold April 2024 Corporate Presentation v4.pdf
Lundin Gold April 2024 Corporate Presentation v4.pdf
 
House of Commons ; CDC schemes overview document
House of Commons ; CDC schemes overview documentHouse of Commons ; CDC schemes overview document
House of Commons ; CDC schemes overview document
 
Call Girls Service Nagpur Maya Call 7001035870 Meet With Nagpur Escorts
Call Girls Service Nagpur Maya Call 7001035870 Meet With Nagpur EscortsCall Girls Service Nagpur Maya Call 7001035870 Meet With Nagpur Escorts
Call Girls Service Nagpur Maya Call 7001035870 Meet With Nagpur Escorts
 
High Class Call Girls Nagpur Grishma Call 7001035870 Meet With Nagpur Escorts
High Class Call Girls Nagpur Grishma Call 7001035870 Meet With Nagpur EscortsHigh Class Call Girls Nagpur Grishma Call 7001035870 Meet With Nagpur Escorts
High Class Call Girls Nagpur Grishma Call 7001035870 Meet With Nagpur Escorts
 
Monthly Market Risk Update: April 2024 [SlideShare]
Monthly Market Risk Update: April 2024 [SlideShare]Monthly Market Risk Update: April 2024 [SlideShare]
Monthly Market Risk Update: April 2024 [SlideShare]
 
Andheri Call Girls In 9825968104 Mumbai Hot Models
Andheri Call Girls In 9825968104 Mumbai Hot ModelsAndheri Call Girls In 9825968104 Mumbai Hot Models
Andheri Call Girls In 9825968104 Mumbai Hot Models
 

omnicare annual reports 2003

  • 1. Omnicom ANNUAL REPORT 2003
  • 2. Omnicom COMPARATIVE HIGHLIGHTS 2003 2002 2001 2000 1999 5 YR. CAGR (Amounts in Thousands Except Per Share Amounts) Operating Data $8,621,404 Revenue $7,536,299 $6,889,406 $6,154,230 $5,130,545 15.0% 1,164,675 Operating Profit 1,104,115 968,184 878,090 724,130 15.7% 675,883 Net Income 643,459 503,142 498,795 362,882 19.4% Earnings per share $3.61 —Basic $3.46 $2.75 $2.85 $2.07 17.5% 3.59 —Diluted 3.44 2.70 2.73 2.01 18.0% As adjusted(a): Net Income, excluding goodwill $675,883 amortization and Razorfish gain $643,459 $586,208 $511,487 $429,372 15.2% Earnings per common share, excluding goodwill amortization and Razorfish gain $3.61 —Basic $3.46 $3.21 $2.93 $2.45 13.5% 3.59 —Diluted 3.44 3.13 2.80 2.36 13.9% $0.80 Dividends per share $0.80 $0.775 $0.70 $0.625 8.8% Common stock data Weighted average number of common shares and common equivalent shares outstanding during the year 187,258 —Basic 186,094 182,868 174,881 175,286 188,656 —Diluted 187,603 190,290 189,038 189,885 (a) As required by Statement of Financial Accounting Standards No. 142 — “Goodwill and Other Intangibles”, beginning with our 2002 results, goodwill and other intangible assets that have indefinite lives are not amortized. To make our results for the periods prior to 2002 more directly comparable in the table that follows, we adjusted our historical results for periods prior to 2002 to eliminate goodwill amortization for all periods, as well as the non-recurring gain on the sale of Razorfish shares in 2000, and the related tax impacts. As a result of these adjustments, the amounts presented for periods prior to 2002 are non-GAAP financial measures. We believe that by making these adjustments, the table that follows presents selected financial data using amounts that are more comparable year-to-year and thus more meaningful for purposes of this analysis. (See Item 6 in the accompanying Annual Report on Form 10-K for a reconciliation of the “as adjusted” amounts to the GAAP amounts.)
  • 3. Letter from the President Dear Fellow Shareholders Omnicom’s strategy of seeking consistent returns from a diversified portfolio of businesses proved its value for shareholders again in 2003. Many things done very well by a great many employees enabled us to record our seventeenth consecutive year of increased revenues and earnings. The significance of this accomplishment is underscored by the fact that 2003 was not simply a tough year. It was the third consecutive year of difficult and often uneven economic conditions for the global advertising and marketing industries. Our people made the necessary decisions to align their staffing and facilities with sustainable levels of business. They worked with us to minimize increases in operating expenses. And they never faltered in their commitment to creative excellence, which enabled our agencies to win more than $4 billion in net new business as well as the leading share of the world’s most prestigious creative awards. Solid financial performance Omnicom recorded $8.6 billion in worldwide revenues in 2003, a 14 percent increase from $7.5 billion in 2002. Domestic revenue increased 10 percent to $4.7 billion, while international revenues rose 20 percent to $3.9 billion. The major portion of the increase in international revenues was due to foreign exchange translation, which benefited us for the first time in recent memory. Excluding foreign exchange gains, revenues from international markets advanced 6 percent. All disciplines contributed to revenue growth in 2003. Traditional media advertising, which accounted for 43 percent of total revenues, grew 14 percent. Customer relationship management (CRM) disciplines experienced a strong renewal in client spending on brand building, advancing more than 20 percent. Revenues from specialty communications rose 10 percent. Our public relations businesses, buoyed by a resurgence in financial services assignments and new product introductions, contributed a 4 percent increase in revenues compared to a 6 percent decline in the prior year.
  • 4. Letter from the President Net income was $675.9 million in 2003, a 5 percent increase from the $643.5 million earned in 2002. Diluted earnings per share for 2003 rose 4 percent to $3.59 compared to $3.44 in the prior year. Operating margins decreased 1.2 percent to 13.5 percent in 2003. The margin decline resulted primarily from changes in the mix of Omnicom’s business, increased severance costs and less-than- optimal utilization rates across our networks. We believe our networks have done a good job of offsetting investments required to build revenues with ongoing efforts to align permanent staffing and facilities with current work levels. This was especially true in Europe during 2003. Though severance costs are now mostly behind us, our efforts to control operating expenses remain a key priority in all locations. Given the continuing strength in the Company’s financial performance, in February 2004 the Board raised the annual dividend to $0.90 per share from $0.80 per share. The increase began with the first-quarter dividend of 2004. From our clients’ perspective A fundamental premise of Omnicom’s business is that clients’ objectives should be the central focus in how we structure our business. Our agencies may operate under different disciplines – traditional advertising, marketing communications, public relations or media buying, for example – but we organize our services to clients across those lines. We can bring together any marketing skill to create a customized, multi-disciplinary matrix of expertise capable of delivering consistent brand messages in virtually any market in the world, and do so in a way that is transparent to the client. This is a significant advantage for clients wanting greater efficiency and effectiveness from their marketing dollars. It is also a distinctive competitive advantage for Omnicom. We have a balanced complement of top-quality agencies in each marketing discipline in all major markets. We believe this to be a key factor in our net new business wins, which totaled $4.1 billion in 2003 and an impressive $12.7 billion over the past three years.
  • 5. Letter from the President Omnicom’s fundamental strategy is to seek consistent returns from a diversified portfolio of businesses linked through our largest clients. While every client relationship is important to us, one of Omnicom’s primary objectives is to serve more of the needs of our largest clients. In 2003, as in 2002, revenues from our top 250 clients increased by more than 15 percent, outpacing total revenue gains in both years. These clients now account for over half of worldwide revenues. We have said this before and it bears repeating: broadening our business with our largest clients by expanding the Company’s service capabilities and geographic reach creates overlapping client relationships among our agencies that not only strengthens revenues but also adds stability to Omnicom’s financial performance. Large client or small, creative excellence – backed by service quality and measurable results – must be the defining characteristic of the relationship between agencies and their clients. Our networks again demonstrated their creative leadership in 2003. For the second consecutive year, and the third time in four years, BBDO Worldwide was the most recognized agency network in the world according to the annual Gunn Report on global advertising awards. TBWA Worldwide took second place on the Gunn list, with an unprecedented three agencies among the world’s top ten. Advertising Age gave DDB Worldwide its 2003 Global Agency Network of the Year award. And our specialty marketing companies, always very highly regarded within their specialties, continued to demonstrate their leadership in annual compilations of creative excellence. OMD Worldwide completed its first full year as a unified, global operation. The business continued to deliver on the promise underlying its launch in 2002, winning more than 400 new assignments around the world. Investing in our relationships During 2003, our agencies took advantage of attractive opportunities to make substantial investments in their creative bench strength.
  • 6. Letter from the President They hired senior creative people and their account teams primarily with an eye to winning future business. That strategy began to pay off in new client assignments by the end of the year, and we expect to see a substantial return on these investments in 2004 and 2005. Investing in our people has a long and successful history at Omnicom. We believe that our employees have tremendous “embedded knowledge,” or collective business experience, that should be made available to Omnicom employees around the world. In this sense, we are a learning and a teaching organization in which the sharing of our business knowledge is both a core competency and a competitive advantage. In 1995, for example, we founded Omnicom University and created the Senior Management Program (SMP) with Harvard Business School professor Len Schlesinger. The SMP is a global leadership program that uses the case study approach to explore the best contemporary thinking on the management of professional service firms. More than 700 CEOs and senior managers of Omnicom companies have completed their two-year commitment. DAS University’s Business Learning Program was founded in 1997 to disseminate the essential skills required in a professional services firm. The program is open to all managers at Omnicom companies and, to date, 2,200 of our colleagues have attended programs in the U.S., United Kingdom and Latin America. In September 2003, ten recent graduates of top business schools began our new MBA Residency Program. During the 30 months of the program, they will rotate through six of our disciplines, guided by a management-level mentor within each operating company. By getting cross-training experience at this early stage in their careers, we believe participants will not only find the right placement within the Company but also develop the skills required to serve clients in multiple disciplines.
  • 7. Letter from the President We also believe in sharing our skills with the communities which support our businesses. Each year, our agencies and networks invest considerable time and resources in support of charitable and not-for-profit activities. This pro bono work, comprising many thousands of hours of professional time each year, is driven by individual agencies in their local communities without direction from Omnicom. This ‘giving back’ is a compelling testimonial to the generous spirit that animates our agencies and their employees. The return on these investments comes to us in many ways. An independent benchmarking study showed that, between 1995 and 2002, the cost savings attributable to reduced senior management turnover more than reimbursed us for all our learning activities. The same study also identified a critical feature of the successful professional services firm that we have discussed previously: those offices with a strong corporate culture, solid leadership and high employee morale are also the most profitable. Governance and stock-based compensation I can say with unequivocal certainty that the shareholders of Omnicom have been very well served over the years by the governance of the Board of Directors. During 2002 and 2003, the Board made a number of proactive changes in response to evolving standards of corporate governance, and it is making additional changes in 2004. Specifically, the Board has approved Omnicom’s election, in advance of requirements by the Financial Accounting Standards Board, to record as an expense on the Company’s income statement the fair value of stock options awarded to employees. The election became effective January 1, 2004. An important point: This change in accounting in no way alters our philosophy with regard to incentive compensation for employees. We have already changed our mix of compensation, and we may consider more changes. We intend to preserve the flexibility to design competitive compensation packages that enable us to attract and retain the very best talent in each of our business disciplines.
  • 8. Letter from the President Looking ahead We entered 2004 with good momentum on several fronts. Global economic growth has generally resumed – Europe being slower to get under way – and clients are again investing in brand building after three years of maintenance spending. The difficult job of matching personnel and facilities to work levels was substantially completed last year, and we can now focus our attention on building revenues on a more cost-effective foundation, especially in Europe. That said, we will continue the challenging work of helping agencies fine-tune their cost structures. We also expect incentive compensation, which was scaled back in recent years, to become a more prominent expense in order to ensure that we continue to provide key personnel with competitive compensation packages. Client-centered networks, exceptional creative talent, industry- leading breadth in all disciplines, global capability in all major markets – these are the perennial drivers of revenues at Omnicom agencies. We believe these capabilities make a compelling case to clients that are seeking ways to ensure their marketing dollars are well spent. Our businesses plan to make that case aggressively during 2004 in order to build our growing share of markets around the world. Our objectives for 2004 will be very familiar to those who know Omnicom: growth of revenues and earnings, balance in a diversified portfolio of businesses, and stability of returns for shareholders. The strategy underpinning those objectives has delivered steady increases in shareholder value for 17 years. We intend to keep the record going. Sincerely, John D. Wren President & Chief Executive Officer April 2004
  • 9.
  • 10. UNITED STATES SECURITIES AND EXCHANGE COMMISSION Washington, D.C. 20549 [X] ANNUAL REPORT PURSUANT TO SECTION 13 OR 15(d) OF THE SECURITIES EXCHANGE ACT OF 1934 For the fiscal year ended: December 31, 2003 OR [] TRANSITION REPORT PURSUANT TO SECTION 13 OR 15(d) OF THE SECURITIES EXCHANGE ACT OF 1934 Commission File Number: 1-10551 OMNICOM GROUP INC. (Exact name of registrant as specified in its charter) New York 13-1514814 (State or other jurisdiction of (I.R.S. Employer Identification No.) incorporation or organization) 437 Madison Avenue, New York, NY 10022 (Address of principal executive offices) (Zip Code) Registrant’s telephone number, including area code: (212) 415-3600 Securities Registered Pursuant to Section 12(b) of the Act: Name of each Exchange Title of each class on which Registered _______________________________________________________________ ________________________________________________________ Common Stock, $.15 Par Value New York Stock Exchange Securities Registered Pursuant to Section 12(g) of the Act: None The registrant has (1) filed all reports required to be filed by Section 13 or 15(d) of the Securities Exchange Act of 1934 during the preceding 12 months and (2) been subject to such filing requirements for the past 90 days. Disclosure of delinquent filers pursuant to Item 405 of Regulations S-K is not contained herein and will not be contained in the definitive proxy or information statements incorporated by reference in Part III of this form 10-K or any amendment to this Form 10-K. Indicate by check mark whether the registrant is an accelerated filer (as defined in Exchange Act Rule 12b-2): Yes X No At March 1, 2004, 190,531,541 shares of Omnicom Common Stock, $.15 par value, were outstanding; the aggregate market value of the voting stock held by nonaffiliates as of the last business day of the registrant’s most recently completed second fiscal quarter was $13,173,641,000. Certain portions of Omnicom’s definitive proxy statement relating to its annual meeting of shareholders scheduled to be held on May 25, 2004 are incorporated by reference into Part III of this report.
  • 11.
  • 12. OMNICOM GROUP INC. ANNUAL REPORT ON FORM 10-K FOR THE YEAR ENDED DECEMBER 31, 2003 TABLE OF CONTENTS Page ____ PART I Item 1. Business .......................................................................................................................... 1 Item 2. Properties ........................................................................................................................ 3 Item 3. Legal Proceedings .......................................................................................................... 4 Item 4. Submission of Matters to a Vote of Security Holders.................................................... 4 PART II Item 5. Market for Registrant’s Common Equity and Related Stockholder Matters ................ 5 Item 6. Selected Financial Data .................................................................................................. 6 Items 7/7A. Management’s Discussion and Analysis of Financial Condition and Results of Operations: Critical Accounting Policies; and Quantitative and Qualitative Disclosures about Market Risk .............................................................................. 8 Item 8. Financial Statements and Supplementary Data.............................................................. 24 Item 9. Changes and Disagreements with Accountants on Accounting and Financial Disclosure .............................................................................................. 24 Item 9A. Controls and Disclosure ................................................................................................ 24 PART III Item 10. Directors and Executive Officers of the Registrant........................................................ 25 Item 11. Executive Compensation ................................................................................................ * Item 12. Security Ownership of Certain Beneficial Owners and Management .......................... * Item 13. Certain Relationships and Related Transactions ............................................................ * PART IV Item 15. Exhibits, Financial Statement Schedules and Reports on Form 8-K ............................ 26 Index to Financial Statements ........................................................................................ 26 Index to Financial Statements Schedules ...................................................................... 26 Exhibit Index .................................................................................................................. 26 Signatures .............................................................................................................................................. 29 Management Report .............................................................................................................................. F-1 Independent Auditors’ Report .............................................................................................................. F-2 Consolidated Financial Statements ...................................................................................................... F-4 Notes to Consolidated Financial Statements ........................................................................................ F-8 Certifications of Senior Executive Officers .......................................................................................... S-4 * The information called for by Items 10, 11, 12 and 13, to the extent not included in this document, is incorporated herein by reference to the information to be included under the captions “Election of Directors”, “Stock Ownership”, “Director Compensation” and “Executive Compensation” in Omnicom’s definitive proxy statement, which is expected to be filed by April 23, 2004.
  • 13.
  • 14. PART I Introduction This report is both our 2003 annual report to shareholders and our 2003 annual report on Form 10-K required under federal securities laws. We are a holding company. Our business is conducted through subsidiaries. For simplicity, however, the terms “Omnicom”, “we”, “our” and “us” each refer to Omnicom Group Inc. and our subsidiaries unless the context indicates otherwise. Statements of our beliefs or expectations regarding future events are “forward-looking statements” within the meaning of the federal securities laws. These statements are subject to various risks and uncertainties, including as a result of the specific factors identified under the captions “Risks and Competitive Conditions” and “Management’s Discussion and Analysis of Financial Condition and Results of Operations” on pages 3 and 7 and elsewhere in this report. There can be no assurance that these beliefs or expectations will not change or be affected by actual future events. 1. Business Our Business: We are one of the largest advertising, marketing and corporate communications companies in the world. Our company was formed through a 1986 combination of three advertising, marketing and corporate communications networks, BBDO, Doyle Dane Bernbach and Needham Harper. Since then, we have grown our strategic holdings to over 1,500 subsidiary agencies operating in all major markets worldwide. Our agencies provide an extensive range of advertising, marketing and corporate communications services, including: advertising investor relations brand consultancy marketing research crisis communications media planning and buying custom publishing multi-cultural marketing database management non-profit marketing digital and interactive marketing organizational communications direct marketing package design directory advertising product placement entertainment marketing promotional marketing environmental design public affairs experiential marketing public relations field marketing real estate advertising and marketing financial / corporate business-to-business advertising recruitment communications graphic arts reputation consulting healthcare communications retail marketing instore design sports and event marketing 1
  • 15. Advertising, marketing and corporate communications services are provided to clients through global, pan-regional and national independent agency brands. Our brands include: BBDO Worldwide Jump DDB Worldwide Kaleidoscope TBWA Worldwide Ketchum OMD Worldwide Ketchum Directory Advertising Adelphi Group KPR AGENCY.COM Lieber Levett Koenig Farese Babcock Alcone Marketing Group Lyons Lavey Nickel Swift Anderson DDB M/A/R/C Research ARA Group Marketing Advantage Arnell Group MarketStar Atmosphere BBDO Martin/Williams Auditoire Matthews Media Group BDDP & Fils MBA Bernard Hodes Group Mercury Public Affairs Brand Architecture International Merkley & Partners Brodeur Worldwide MicroMedia Carlson and Partners Millsport Carré Bleu Marine Moss Dragoti Changing Our World Multi-M Clark & Weinstock National In-Store Claydon Heeley Jones Mason New Solutions Clemenger Communications Limited Nouveau Monde Cline, Davis & Mann Novus Cone Organic Corbett Accel Healthcare Group Paris Venise Design CPM Pentamark Creative Juice PGC Advertising Davie-Brown Entertainment PhD del Rivero Messianu Porter Novelli International Dieste, Harmel & Partners Proximity Worldwide Direct Partners Radiate Sports & Entertainment Group Doremus Rapp Collins Worldwide Eigen Fabrikaat Russ Reid Company Element 79 Partners Salesforce Etcetera Groep Screen European Communication Consultants Sellbytel FitzGerald Communications Serino Coyne FKGB Siegel & Gale Fleishman-Hillard Spike DDB Full Circle Entertainment Spot Plus G1 Staniforth Gavin Anderson & Company Steiner Sports Marketing Goodby, Silverstein & Partners Targetbase Grizzard Communications TARGIS GSD&M Tequila Hall & Partners Group Textuel Harrison & Star Business Group The Ant Farm Health Science Communications The Designory Heye & Partner The Marketing Arm Horrow Sports Ventures The Promotion Network ICON TPG Integrated Merchandising Services Tracy Locke Partnership Integer Group Tribal DDB Interbrand Washington Speakers Bureau InterScreen Wolff Olins itec Zimmerman & Partners Advertising 2
  • 16. The various components of our business and material factors that affected us in 2003 are discussed in our “Management’s Discussion and Analysis of Financial Conditions and Results of Operations” of this report. None of our acquisitions in 2003, 2002 or 2001 were material to our consolidated financial position or results of operations. For information concerning our acquisitions, see note 2 to our consolidated financial statements. Geographic Regions: Our total consolidated revenue is about evenly divided between U.S. and non-U.S. operations. For financial information concerning domestic and foreign operations and segment reporting, see note 5 to our consolidated financial statements. Our Clients: We had over 5,000 clients in 2003, many of which were served by more than one of our agency brands. Our 10 largest and 250 largest clients in the aggregate accounted for 18.7% and 53.8%, respectively, of our 2003 consolidated revenue. Our largest client was served by 50 of our agency brands. This client accounted for 4.7% of our 2003 consolidated revenue. No other client accounted for more than 2.9% of our 2003 consolidated revenue. Our Employees: We employed approximately 58,500 people at December 31, 2003. We are not party to any significant collective bargaining agreements. See our management discussion and analysis beginning on page 7 of this report for a discussion of the effect of salary and service costs on our historical results of operations. Risks and Competitive Conditions: We face the risks normally associated with global services businesses. The operational and financial performance of our businesses are typically tied to overall economic and regional market conditions, competition for client assignments and talented staff, new business wins and losses and the risks associated with extensive international operations. We do not believe that our international operations as a whole present any material risk to our overall business because they invoice clients and pay expenses in their local currency. However, there are some risks of doing business abroad, including those of currency fluctuations, political instability and exchange controls, which do not affect domestic-focused firms as discussed in our management’s discussion and analysis starting on page 7. For financial information on our operations by geographic area, see note 5 to our consolidated financial statements. The particular businesses in which we participate are highly competitive. Typically, the financial and technological barriers to entry are low, with the key competitive considerations for keeping existing business and winning new business being the quality and effectiveness of the services offered, including our ability to efficiently serve clients, particularly large international clients, on a broad geographic basis. While many of our client relationships are long-standing, companies put their advertising, marketing services and public and corporate communications businesses up for competitive review from time to time. To the extent that we are not able to remain competitive or to keep key clients, our business and financial results could be adversely affected. Our ability to retain existing clients and to attract new clients may, in some cases, be limited by clients’ policies on, or perceptions of, conflicts of interest arising out of other client relationships. In addition, an important aspect of our competitiveness is our ability to retain key employee and management personnel. Our continuing ability to attract and retain these employees may have a material effect on our business and financial results. Our revenue is dependent upon the advertising, marketing and corporate communication requirements of our clients and tends to be lowest in the first and third quarters of the calendar year as a result of the post-holiday slowdown in client activity at the beginning of January and a slowdown in client activity in August primarily as a result of the vacation season. See our management discussion and analysis beginning on page 7 of this report for a discussion of the effect of market conditions and other factors on our historical results of operations. Directly or indirectly, government agencies and consumer groups have from time to time affected or attempted to affect the scope, content and manner of presentation of advertising, marketing and corporate communications services through regulations and other governmental action. We believe the total volume of advertising, marketing and corporate communications services will not be materially affected by future legislation or regulation, however the scope, content and manner of presentation may continue to change. 2. Properties We maintain office space in many major cities around the world. This space is primarily used for office and administrative purposes by our employees in performing professional services. Our principal corporate offices are at 437 Madison Avenue, New York, New York and One East Weaver Street, Greenwich, Connecticut. We also maintain executive offices in London, England. 3
  • 17. Our office space is utilized for performing professional services and is in suitable and well-maintained condition for our current operations. Substantially all of our office space is leased from third parties with varying expiration dates ranging from one to 19 years. Certain of our leases are subject to rent reviews or contain various escalation clauses and certain of our leases require our payment of various operating expenses, which may also be subject to escalation. In addition, leases are denominated in the local currency of the operating entity and are therefore subject to changes in foreign exchange rates. Our consolidated rent expense was $335.5 million in 2003, $311.3 million in 2002 and $305.4 million in 2001, after reduction for rents received from subleases of $17.3 million, $15.5 million and $8.0 million, respectively. Our obligations for future minimum base rents under terms of non-cancelable real estate leases and other operating leases, which include primarily office furniture and computer and technology equipment, reduced by rents receivable from non-cancelable subleases are (in millions): Net Rent ________ 2004 . . . . . . . . . . . . . . . . . . . . . . . . . . . . . . . . . . . . . . . . . . . . $435.9 2005 . . . . . . . . . . . . . . . . . . . . . . . . . . . . . . . . . . . . . . . . . . . . 362.7 2006 . . . . . . . . . . . . . . . . . . . . . . . . . . . . . . . . . . . . . . . . . . . . 288.4 2007 . . . . . . . . . . . . . . . . . . . . . . . . . . . . . . . . . . . . . . . . . . . . 231.3 2008 . . . . . . . . . . . . . . . . . . . . . . . . . . . . . . . . . . . . . . . . . . . . 190.9 Thereafter . . . . . . . . . . . . . . . . . . . . . . . . . . . . . . . . . . . . . . . . . 949.3 See note 10 to our consolidated financial statements of this report for a discussion of our lease commitments and our management discussion and analysis for the impact of leases on our operating expenses. 3. Legal Proceedings Beginning on June 13, 2002, several proposed class actions were filed against us and certain senior executives in the United States District Court for the Southern District of New York. The actions have since been consolidated under the caption In re Omnicom Group Inc. Securities Litigation, No. 02-CV4483 (RCC) on behalf of a proposed class of purchasers of our common stock between February 20, 2001 and June 11, 2002. The consolidated complaint alleges among other things that our public filings and other public statements during that period contained false and misleading statements or omitted to state material information relating to (1) our calculation of the organic growth component of period-to-period revenue growth, (2) our valuation of certain internet investments made by our Communicade Group, which we contributed to Seneca Investments LLC in 2001, and (3) the existence and amount of certain contingent future obligations in respect of acquisitions. The complaint seeks an unspecified amount of compensatory damages plus costs and attorneys’ fees. Defendants have moved to dismiss the complaint. The court has not yet decided the motion. In addition to the proceedings described above, a shareholder derivative action was filed on June 28, 2002 in New York State Court in New York City by a plaintiff shareholder, purportedly on our behalf, alleging breaches of fiduciary duty, disclosure failures, abuse of control and gross mismanagement in connection with the formation of Seneca Investments LLC. Management presently expects to defend these cases vigorously. Currently, we are unable to determine the outcome of these cases and the effect on our financial position or results of operations. The outcome of any of these matters is inherently uncertain and may be affected by future events. Accordingly, we cannot assure investors as to the ultimate effect of these matters on our financial position or results of operations. We are also involved from time to time in various routine legal proceedings in the ordinary course of business. We do not presently expect that these proceedings will have a material adverse effect on our consolidated financial position or results of operations. For additional information concerning our legal proceedings, including the class action and derivative action described above, see note 14 to our consolidated financial statements, which is incorporated into this section by reference. 4. Submission of Matters to a Vote of Security Holders Our annual shareholders meeting has historically been held in the second quarter of the year. No matters were submitted to a vote of our shareholders during the last quarter of 2003. 4
  • 18. PART II 5. Market for Registrant’s Common Equity and Related Stockholder Matters Our common shares are listed on the New York Stock Exchange under the symbol “OMC”. On March 1, 2004, we had 3,633 holders of record of our common shares. The table below shows the range of quarterly high and low sales prices reported on the New York Stock Exchange Composite Tape for our common shares and the dividends paid per share for these periods. Dividends Paid Period High Low Per Share ___________ ___________ ___________ ___________________________ Q1 2002 ...................................... $96.30 $82.76 $0.20 Q2 2002 ...................................... 94.10 36.27 0.20 Q3 2002 ...................................... 65.61 38.54 0.20 Q4 2002 ...................................... 70.29 48.10 0.20 Q1 2003 ...................................... $68.25 $46.50 $0.20 Q2 2003 ...................................... 76.43 53.15 0.20 Q3 2003 ...................................... 81.18 69.61 0.20 Q4 2003 ...................................... 87.60 71.80 0.20 Q1 2004* .................................... $88.50 $76.85 $0.20 * through March 1, 2004 5
  • 19. 6. Selected Financial Data The following selected financial data should be read in conjunction with our consolidated financial statements and related notes which begin on page F-1, as well as our management’s discussion and analysis which begins on page 7 of this report. (Dollars in thousands except per share amounts) ______________________________________________________________ 2003 2002 2001 2000 1999 ________ ________ ________ ________ ________ For the year: Revenue .......................................... $ 8,621,404 $ 7,536,299 $ 6,889,406 $6,154,230 $5,130,545 Operating Profit .............................. 1,164,675 1,104,115 968,184 878,090 724,130 Income After Income Taxes ............ 740,922 697,987 543,257 542,477 400,461 Net Income ...................................... 675,883 643,459 503,142 498,795 362,882 Net Income per common share: Basic............................................ 3.61 3.46 2.75 2.85 2.07 Diluted ........................................ 3.59 3.44 2.70 2.73 2.01 Dividends declared per common share ............................................ 0.800 0.800 0.775 0.700 0.625 At year end: Cash, cash equivalents and short-term investments .............. $ 1,548,935 $ 695,881 $ 516,999 $ 576,539 $ 600,949 Total assets ...................................... 14,499,456 11,819,802 10,617,414 9,853,707 9,017,637 Long-term obligations: Long-term debt .......................... 197,291 197,861 490,105 1,015,419 263,149 Convertible notes ........................ 2,339,304 1,747,037 850,000 229,968 448,483 Deferred compensation and other liabilities ........................ 342,894 293,638 296,980 296,921 300,746 As discussed in footnote 13 of the notes to our consolidated financial statements, as required by statements of Financial Accounting Standards 142 — “Goodwill and Other Intangibles” (“SFAS 142”), beginning with our 2002 results, goodwill and other intangible assets that have indefinite lives due to a change in generally accepted accounting principles (“GAAP”) are not amortized. To make our results for the periods prior to 2002 more directly comparable in the table that follows, we adjusted our historical results for periods prior to 2002 to eliminate goodwill amortization for all periods, as well as a non-recurring gain on the sale of Razorfish shares in 2000, and the related tax impacts. As a result of these exclusions, this presentation is a non-GAAP financial measure. We believe that by excluding the items noted above, the table below presents selected financial data using amounts that are more comparable year-to-year and thus more meaningful for purposes of this analysis. (Dollars in thousands except per share amounts) ______________________________________________________________ 2003 2002 2001 2000 1999 ________ ________ ________ ________ ________ Net Income, as adjusted: Net Income, as reported, GAAP ........ $675,883 $643,459 $503,142 $498,795 $362,882 Add-back goodwill amortization, net of income taxes.......................... — — 83,065 76,518 66,490 Less: gain on sale of Razorfish shares, net of income taxes ............ — — — _ 63,826 — ________ ________ __ _______ _______ __ _______ Net Income, excluding goodwill amortization and Razorfish gain .... $675,883 $643,459 $586,207 $511,487 $429,372 ________ ________ __ _______ ________ __ _______ ________ ________ __ _______ ________ __ _______ Basic Net Income per share: as reported, GAAP .......................... $3.61 $3.46 $2.75 $2.85 $2.07 as adjusted ...................................... $3.61 $3.46 $3.21 $2.93 $2.45 Diluted Net Income per share: as reported, GAAP .......................... $3.59 $3.44 $2.70 $2.73 $2.01 as adjusted ...................................... $3.59 $3.44 $3.13 $2.80 $2.36 6
  • 20. The following is a reconciliation of the “as reported” to “as adjusted” Net Income per share on a basic and diluted basis. (Dollars in thousands except per share amounts) _____________________________________________________________ 2003 2002 2001 2000 1999 ________ ________ ________ ________ ________ Basic Net Income per share, as adjusted: Net Income per common share: Basic, as reported, GAAP .................... $3.61 $3.46 $2.75 $2.85 $2.07 Add-back goodwill amortization per common share, net of income taxes .................................... — — 0.46 0.44 0.38 Less: gain on sale of Razorfish shares, per common share, net of income taxes................................ — — — 0.36 — _________ _________ _________ _________ _________ Net Income per common share, excluding goodwill amortization and Razorfish gain: Basic ............................................ $3.61 $3.46 $3.21 $2.93 $2.45 _________ _________ _________ _________ _________ _________ _________ _________ _________ _________ Diluted Net Income per share, as adjusted: Net Income per common share: Diluted, as reported, GAAP ............ $3.59 $3.44 $2.70 $2.73 $2.01 Add-back goodwill amortization per common share, net of income taxes .................................... — — 0.43 0.41 0.35 Less: gain on sale of Razorfish shares, per common share, net of income taxes................................ — — — 0.34 — _________ _________ _________ _________ _________ Net Income per common share, excluding goodwill amortization and Razorfish gain: Diluted ........................................ $3.59 $3.44 $3.13 $2.80 $2.36 _________ _________ _________ _________ _________ _________ _________ _________ _________ _________ 7
  • 21. 7/7A. Management’s Discussion and Analysis of Financial Condition and Results of Operations; Critical Accounting Policies; and Quantitative and Qualitative Information about Market Risk Executive Summary We are a holding company. We own industry-leading advertising, marketing and corporate communications companies that span more than 30 marketing disciplines, 100 countries, 1,500 subsidiary agencies and 5,000 clients. On a global, pan-regional and local basis, our agencies provide traditional media advertising services as well as marketing services including customer relationship management, public relations and specialty communications. We continually seek to grow our business with our existing clients by maintaining a client-centered approach, as well as expanding our existing business relationships into new markets and new clients. In addition, we pursue selective acquisitions of complementary companies with strong, entrepreneurial management teams that either currently serve or have the ability to serve our existing client base. During the past few years, overall industry and margin growth continued to be affected by geopolitical unrest, lagging economic conditions, lack of consumer confidence and cautious client spending. All of these factors contributed to a difficult business environment and industry-wide margin contraction. Our diversified portfolio of companies, both from a geographical and a service offerings perspective, has allowed us to perform ahead of the industry in general. During this period we have continued to invest in our businesses and our personnel, and have taken action to reduce costs at some of our companies to deal with the changing economic circumstances. Several long-term trends continue to positively affect our business, including our clients increasingly expanding the focus of their brand strategies from national markets to pan-regional and global markets. Additionally, in an effort to gain greater efficiency and effectiveness from their marketing dollars, clients are increasingly requiring greater coordination of their traditional advertising and marketing activities and concentrating these activities with a smaller number of service providers. Although the overall business environment has been difficult, as a result of the diversity and balance of our portfolio of companies and service offerings, we continued to grow our revenues. However, as a result of changes in our business mix, increased severance costs incurred, under-utilization of staff, increased professional fees and increased amortization of other intangible assets, our margins were lower in 2003 and in 2002 than our historical performance. We are hopeful that with continuing improvements in the U.S. economy, combined with the cost-reduction actions taken by our companies, margins should begin to stabilize. Given our size and breadth, we manage the business by monitoring several financial and non-financial performance indicators. The key indicators that we review focus on the areas of revenues and operating expenses. Revenue growth is analyzed by reviewing the components and mix of the growth, including: growth by major geographic location; growth by major marketing discipline; growth from currency changes; growth from acquisition and growth from our largest clients. In recent years, our revenue has been divided almost evenly between domestic and international operations. In 2003, our overall revenue growth was 14.4%, of which 6.2% was related to changes in foreign exchange rates and 3.6% was related to acquired entities. The remainder, 4.6%, was organic growth. In 2003, traditional media advertising represented about 44% of the total revenue and grew by 14.1%. Marketing services represented about 56% of total revenue and grew by 14.6% over the previous year. We believe that our ability to increase revenues as a result of our client-centered approach to the business is demonstrated most clearly in our relationships with our largest clients. While consolidated revenues on a U.S. dollar basis increased 14.4% in 2003, revenue from our ten largest clients increased 19.3%. By expanding the breadth of our relationships with these clients we not only increase revenues, but we also enhance the overall consistency and stability of our operations, which in turn drives our financial performance. We measure operating expenses in two distinct cost categories, salary and service costs, and office and general expenses. Because we are a service business, we monitor these costs on a percentage of revenue basis. Salary and service costs tend to fluctuate in conjunction with changes in revenues, whereas office and general expenses, which are not directly related to servicing clients, tend to decrease as revenues increase because a 8
  • 22. significant portion of these expenses are relatively fixed in nature. Over the past three years, salary and service costs have grown from 64.2% of revenue to 67.7% of revenue, while office and general expenses have declined from 21.8% of revenue to 18.8% of revenue. Our net income for 2003 increased by 5.0% to $675.9 million from $643.5 million in 2002 and our diluted EPS increased by 4.4% to $3.59 from $3.44. The following year-over-year analysis gives further details and insight into the changes in our financial performance. Financial Results from Operations — 2003 Compared with 2002 (Dollars in millions, except per share amounts) Twelve Months Ended December 31, 2003 2002 _____ _____ Revenue .................................................................................................... $8,621.4 $7,536.3 Operating expenses: Salary and service costs ...................................................................... 5,839.0 4,952.9 Office and general expenses ................................................................ 1,617.7 1,479.3 ______________ ______________ 7,456.7 6,432.2 ______________ ______________ Operating profit ........................................................................................ 1,164.7 1,104.1 Net interest expense: Interest expense .................................................................................... 57.9 45.5 Interest income .................................................................................... (15.1) (15.0) ______________ ______________ 42.8 30.5 ______________ ______________ Income before income taxes .................................................................... 1,121.9 1,073.6 Income taxes ............................................................................................ 380.9 375.6 ______________ ______________ Income after income taxes ........................................................................ 741.0 698.0 Equity in earnings of affiliates.................................................................. 15.1 13.8 Minority interests (80.2) (68.3) ______________ ______________ Net income .......................................................................................... $ 675.9 $ 643.5 ______________ ______________ ______________ ______________ Net Income Per Common Share: Basic .................................................................................................... $3.61 $3.46 Diluted .................................................................................................. 3.59 3.44 Dividends Declared Per Common Share .................................................. $0.80 $0.80 Revenue: When comparing performance between years, we discuss non-GAAP financial measures such as the impact that foreign currency rate changes, acquisitions/dispositions and organic growth have on reported revenues. As we derive significant revenue from international operations, changes in foreign currency rates between the years impact reported results. Reported results are also impacted by our acquisition and disposition activity and organic growth. Accordingly, we provide this information to supplement the discussion of changes in revenue period-to-period. 9
  • 23. Our 2003 consolidated worldwide revenue increased 14.4% to $8,621.4 million from $7,536.3 million in 2002. The effect of acquisitions, net of disposals, increased 2003 worldwide revenue by $271.7 million. Organic growth increased worldwide revenue by $347.8 million, and foreign exchange impacts increased worldwide revenue by $465.6 million. The components of total 2003 revenue growth in the U.S. (“domestic”) and the remainder of the world (“international”) are summarized below ($ in millions): Total Domestic International ___________________ ___________________ _________________ $ % $ % $ % ________ _______ ________ _______ ________ _______ December 31, 2002................................ $7,536.3 — $4,284.6 — $3,251.7 — Components of Revenue Changes: Foreign exchange impact....................... 465.6 6.2% — — 465.6 14.3% Acquisitions ........................................... 271.7 3.6% 174.7 4.1% 97.0 3.0% Organic................................................... 347.8 4.6% 261.5 6.1% 86.2 2.7% ______________ _______ ______________ _______ ______________ _______ December 31, 2003................................ $8,621.4 14.4% $4,720.9 10.2% $3,900.5 20.0% ______________ _______ ______________ _______ ______________ _______ ______________ _______ ______________ _______ ______________ _______ The components and percentages are calculated as follows: • The foreign exchange impact component shown in the table is calculated by first converting the current period’s local currency revenue using the average exchange rates from the equivalent prior period to arrive at a constant currency revenue (in this case $8,155.8 million for the Total column in the table). The foreign exchange impact equals the difference between the current period revenue in U.S. dollars and the current period revenue in constant currency (in this case $8,621.4 million less $8,155.8 million for the Total column in the table). • The acquisition component shown in the table is calculated by aggregating the applicable prior period revenue of the acquired businesses. Netted against this number is the revenue of any business included in the prior period reported revenue that was disposed of subsequent to the prior period. • The organic component shown in the table is calculated by subtracting both the foreign exchange and acquisition revenue components from total revenue growth. • The percentage change shown in the table of each component is calculated by dividing the individual component amount by the prior period revenue base of that component (in this case $7,536.3 million for the Total column in the table). During the past few years, geopolitical unrest, lagging economic conditions, lack of consumer confidence and cautious client spending have continued to affect overall industry growth. However, our diversified portfolio of companies, both from a geographical and service offerings perspective, has allowed us to perform ahead of the industry in general and we have continued to grow our revenues. The components of revenue and revenue growth for 2003 compared to 2002, in our primary geographic markets are summarized below ($ in millions): $ Revenue % Growth _________ _________ United States .............................................................. $4,720.9 10.2% Euro Markets.............................................................. 1,789.9 22.6% United Kingdom ........................................................ 941.9 15.9% Other .......................................................................... 1,168.7 19.4% ______________ _______ Total ........................................................................... $8,621.4 14.4% ______________ _______ ______________ _______ As indicated, foreign exchange impacts increased our international revenue by $465.6 million for 2003. The most significant impacts resulted from the continued strengthening of the Euro and the British Pound against the U.S. dollar, as our operations in these markets represented approximately 70.0% of our international revenue. Additional geographic information relating to our business is contained in note 5 to our consolidated financial statements. Due to a variety of factors, in the normal course, our agencies both gain and lose business from clients each year. The net result in 2003, and historically each year for Omnicom as a whole, was an overall gain in new business. Due to our multiple independent agency structure and the breadth of our service offerings and 10
  • 24. geographic reach, our agencies have more than 5,000 active client relationships in the aggregate. Revenue from our single largest client in 2003 increased by 7.9%. This client represented 4.7% of worldwide revenue in 2003 and 5.0% in 2002 and no other client represented more than 2.9% in 2003 or 2002. Revenue from our ten largest and 250 largest clients grew by more than 19.0% and 15.0%, respectively. Our ten largest and 250 largest clients represented 18.7% and 53.8% of our 2003 worldwide revenue, respectively and 17.9% and 53.4% of our 2002 worldwide revenue. Driven by clients’ continuous demand for more effective and efficient branding activities, we strive to provide an extensive range of advertising, marketing and corporate communications services through various client centric networks that are organized to meet specific client objectives. These services include advertising, brand consultancy, crisis communications, custom publishing, database management, digital and interactive marketing, direct marketing, directory advertising, entertainment marketing, environmental design, experiential marketing, field marketing, financial / corporate business-to-business advertising, graphic arts, healthcare communications, instore design, investor relations, marketing research, media planning and buying, multi-cultural marketing, non-profit marketing, organizational communications, package design, product placement, promotional marketing, public affairs, public relations, real estate advertising and marketing, recruitment communications, reputation consulting, retail marketing and sports and event marketing. In an effort to monitor the changing needs of our clients and to further expand the scope of our services to key clients, we monitor revenue across a broad range of disciplines and group them into the following four categories: traditional media advertising, customer relationship management, referred to as CRM, public relations and specialty communications as summarized below. (Dollars in millions) ____________________________________________________________________ Twelve Months Ended December 31, 2003 2002 2003 vs 2002 __________________ __________________ ___________________ % of % of $ % Revenue Revenue Revenue Revenue Growth Growth ________ ________ ________ ________ _________ _________ Traditional media advertising .............. $3,739.7 43.4% $3,276.4 43.5% $ 463.3 14.1% CRM .................................................... 2,918.6 33.8% 2,421.8 32.1% 496.8 20.5% Public relations .................................... 955.1 11.1% 921.0 12.2% 34.1 3.7% Specialty communications .................. 1,008.0 11.7% 917.1 12.2% 90.9 9.9% ______________ ______________ ______________ $8,621.4 $7,536.3 $1,085.1 14.4% ______________ ______________ ______________ _______ ______________ ______________ ______________ _______ Operating Expenses: Our 2003 worldwide operating expense increased $1,024.5 million, or 15.9%, to $7,456.7 million from $6,432.2 million in 2002, as shown below. (Dollars in millions) _________________________________________________________________________ 2003 2002 2003 vs 2002 __________________________ __________________________ _________________ % of % of % of Total Op. % of Total Op. $ % Revenue Revenue Costs Revenue Revenue Costs Growth Growth ________ ________ _______ ________ ________ _______ _______ _______ Revenue .......................................... $8,621.4 $7,536.3 $1,085.1 14.4% Operating expenses: Salary and service costs .............. 5,839.0 67.7% 78.3% 4,952.9 65.7% 77.0% 886.1 17.9% Office and general expenses........ ______________1,617.7 18.8% 21.7% ______________ 1,479.3 19.6% 23.0% ______________ _______ 138.4 9.4% _______ _______ _______ _______ Total Operating Costs...................... 7,456.7 86.5% 6,432.2 85.3% 1,024.5 15.9% Operating profit .............................. ______________ $1,164.7 13.5% $1,104.1 14.7% $ 60.6 5.5% ______________ ______________ ______________ ______________ ______________ Salary and service costs represent the largest part of operating expenses. During 2003, we have continued to invest in our businesses and their personnel, and have taken action to reduce costs at some of our companies to deal with the changing economic circumstances. As a percentage of operating expenses, salary and service costs were 78.3% in 2003 and 77.0% in 2002. These costs are comprised of direct service costs and salary and related costs. Most, or 86.5%, of the $1,024.5 million increase in operating expenses in 2003 resulted from increases in salary and service costs. The $886.1 million increase in salary and service costs was attributable to increased revenue levels, including changes in the mix of our revenues which resulted in greater utilization of freelance labor. In addition, although we incurred increased severance costs and did not reach optimal utilization 11
  • 25. levels for our staff, we continued to make investments in new key personnel. Furthermore, we increased incentive compensation where performance dictated. As a result, salary and service costs as a percentage of revenues increased year-to-year from 65.7% in 2002 to 67.7% in 2003. Office and general expenses represented 21.7% and 23.0% of our operating expenses in 2003 and 2002, respectively. These costs are comprised of office and equipment rent, depreciation and amortization of other intangibles, professional fees and other overhead expenses. As a percentage of revenue, office and general expenses decreased in 2003 from 19.6% to 18.8%. This year-over-year decrease, which was offset by increases in professional fees and amortization of other intangible assets, resulted from our continuing efforts to better align these costs with business levels on a location-by-location basis, as well as from increased revenue levels. For the foregoing reasons, as well as changes in our business mix, our operating margin decreased from 14.7% in 2002 to 13.5% in 2003. We expect our efforts to control operating expenses will continue, but we anticipate that it will remain difficult. Accordingly, we continue to look for ways to increase the variability of our cost structure. We are hopeful that with the continuing improvements in the U.S. economy combined with the cost reduction actions taken by our companies, margins should begin to stabilize. Net Interest Expense: Our net interest expense increased in 2003 to $42.8 million, as compared to $30.5 million in 2002. Our gross interest expense increased by $12.4 million to $57.9 million. This increase resulted from the additional interest costs associated with our payments on February 21, 2003, of $30 per $1,000 principal amount of our Liquid Yield Option Notes due 2031 and, on August 6, 2003, of $7.50 per $1,000 principal amount of our Zero Coupon Zero Yield Convertible Notes due 2032 as incentives to the holders not to exercise their put rights. These payments to qualified noteholders amounted to $25.4 million and $6.7 million, respectively, and are being amortized ratably over 12-month periods. In addition, interest expense relative to the €152.4 million 5.20% Euro note increased by $2.2 million due to the change in the value of the Euro relative to the U.S. dollar in 2003. These increases were partially offset by marginally lower short-term interest rates and cash management efforts during the course of the year. The amortization of the February and August 2003 payments increased interest expense by $25.4 million for the full-year 2003 compared to 2002. These payments will also impact 2004 by approximately $6.7 million. See “Liquidity and Capital Resources” for a discussion of our indebtedness and related matters. Income Taxes: Our consolidated effective income tax rate was 34.0% in 2003 as compared to 35.0% in 2002. This reduction reflects the realization of our ongoing focus on tax planning initiatives including a reduction of the inefficiencies of our international and state tax structures. 12
  • 26. Financial Results from Operations — 2002 Compared with 2001 Certain reclassifications have been made to the 2002 and 2001 reported amounts to conform them to the 2003 presentation. In addition, as discussed in footnote 13 of the notes to our consolidated financial statements, as required by SFAS 142, beginning with our 2002 results goodwill and other intangible assets that have indefinite lives are not amortized. In addition to discussing 2002 and 2001 on a reported basis and to make the discussion of periods comparable, our 2001 income statement information in the discussion that follows has been adjusted to eliminate goodwill amortization as presented in the following table. As a result of these adjustments, this presentation is a non-GAAP financial measure. We believe that the table below presents selected financial data that is more comparable year-to-year and thus more meaningful for purposes of analysis. (Dollars in millions, except per share amounts) 2001 _____________________________________________ GAAP Non-GAAP As Goodwill As Twelve Months Ended December 31, 2002 Reported Amortization Adjusted(a) _____ _________ ____________ ___________ Revenue ................................................. $7,536.3 $6,889.4 $— $6,889.4 Operating expenses: Salary and service costs.................... 4,952.9 4,420.9 — 4,420.9 Office and general expenses ............. ______________ 1,479.3 1,500.3 94.8 1,405.5 ______________ _________ ______________ 6,432.2 5,921.2 94.8 5,826.4 ______________ ______________ _________ ______________ Operating profit ..................................... 1,104.1 968.2 94.8 1,063.0 Net interest expense: Interest expense ................................ 45.5 90.9 — 90.9 Interest income ................................. ______________ (15.0) (18.1) — (18.1) ______________ _________ ______________ 30.5 72.8 — 72.8 ______________ ______________ _________ ______________ Income before income taxes.................. 1,073.6 895.4 94.8 990.2 Income taxes.......................................... ______________ 375.6 352.1 13.0 365.1 ______________ _________ ______________ Income after income taxes..................... 698.0 543.3 81.8 625.1 Equity in earnings of affiliates .............. 13.8 12.6 2.8 15.4 Minority interests .................................. ______________ (68.3) (52.8) (1.5) (54.3) ______________ _________ ______________ Net income........................................ $ 643.5 $ 503.1 $83.1 $ 586.2 ______________ ______________ _________ ______________ ______________ ______________ _________ ______________ Net Income Per Common Share: Basic ................................................. $3.46 $2.75 0.46 $3.21 Diluted .............................................. 3.44 2.70 0.43 3.13 Dividends Declared Per Common Share . $0.800 $0.775 — $0.775 (a) Excludes amortization of goodwill and related tax impact. Revenue: Our 2002 consolidated worldwide revenue increased 9.4% to $7,536.3 million from $6,889.4 million in 2001. The effect of acquisitions, net of disposals, increased 2002 worldwide revenue by $362.5 million. Internal/organic growth increased worldwide revenue by $193.1 million, and foreign exchange impacts increased worldwide revenue by $91.3 million. The components of total 2002 revenue growth in the U.S. (“domestic”) and the remainder of the world (“international”) are summarized below ($ in millions): Total Domestic International ___________________ ___________________ ___________________ $ % $ % $ % ________ _______ ________ _______ ________ ________ December 31, 2001................................ $6,889.4 — $3,717.0 — $3,172.4 — Components of Revenue Changes: Foreign exchange impact....................... 91.3 1.3% — — 91.3 2.9% Acquisitions ........................................... 362.5 5.3% 269.1 7.3% 93.4 2.9% Organic................................................... 193.1 2.8% 298.5 8.0% (105.4) (3.4)% ______________ ______ ______________ _______ ______________ _______ December 31, 2002................................ $7,536.3 9.4% $4,284.6 15.3% $3,251.7 2.4% ______________ ______ ______________ _______ ______________ _______ ______________ ______ ______________ _______ ______________ _______ 13
  • 27. The components and percentages are calculated as follows: • The foreign exchange impact component shown in the table is calculated by first converting the current period’s local currency revenue using the average exchange rates from the equivalent prior period to arrive at a constant currency revenue (in this case $7,445.0 million for the Total column in the table). The foreign exchange impact equals the difference between the current period revenue in U.S. dollars and the current period revenue in constant currency (in this case $7,536.3 million less $7,445.0 million for the Total column in the table). • The acquisition component shown in the table is calculated by aggregating the applicable prior period revenue of the acquired businesses. Netted against this number is the revenue of any business included in the prior period reported revenue that was disposed of subsequent to the prior period. • The organic component shown in the table is calculated by subtracting both the foreign exchange and acquisition revenue components from total revenue growth. • The percentage change shown in the table of each component is calculated by dividing the individual component amount by the prior period revenue base of that component (in this case $6,889.4 million for the Total column in the table). The components of revenue and revenue growth for 2002 compared to 2001, in our primary geographic markets are summarized below ($ in millions): $ Revenue % Growth _________ _________ United States .............................................................. $4,284.6 15.3% Euro Markets.............................................................. 1,458.6 3.2% United Kingdom ........................................................ 814.1 1.1% Other .......................................................................... 979.0 2.7% ______________ _______ Total ........................................................................... $7,536.3 9.4% ______________ _______ ______________ _______ As indicated, foreign exchange impacts increased our international revenue by $91.3 million for 2002. The most significant impacts resulted from the strengthening of the Euro and the British Pound against the U.S. dollar, as our operations in these markets represented approximately 70.0% of our international revenue. This was partially offset by the strengthening of the U.S. dollar against the Brazilian Real. Additional geographic information relating to our business is contained in note 5 to our consolidated financial statements at page F-15 of this report. Comparisons of 2002 results to the prior year needs to be made in the context of the events of September 11, 2001, which had a significant adverse impact on our business in the third quarter of 2001. The adverse impact of September 11, 2001, was less significant in the fourth quarter of 2001 and management believes that the fourth quarter of 2001 also benefited from other short-term economic stimuli and delayed spending from the third quarter of 2001. The impact of these factors on our business and our 2002 and 2001 results of operations is more fully discussed below. Due to our multiple independent agency structure and the breadth of our service offerings and geographic reach, our agencies have more than 5,000 active client relationships in the aggregate. Revenue from our single largest client in 2002 increased by 2.4%. This client represented 5.0% of worldwide revenue in 2002 and 5.4% in 2001 and no other client represented more than 2.5% in 2002 and 2001. Our ten largest and 250 largest clients represented 17.9% and 53.4% of our 2002 worldwide revenue, respectively and 17.0% and 50.6% of our 2001 worldwide revenue. 14