
Recommended
Recommended
More Related Content
Similar to okr_2010_29925588385298376399937893.pptx
Similar to okr_2010_29925588385298376399937893.pptx (20)
Recently uploaded
Recently uploaded (20)
okr_2010_29925588385298376399937893.pptx
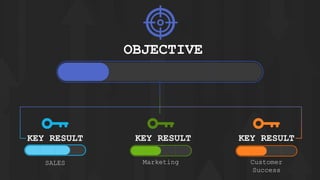
- 1. OBJECTIVE KEY RESULT SALES KEY RESULT Marketing KEY RESULT Customer Success
- 2. OBJECTIVE Add a description of your main objective Explanation: Briefly elaborate on the objective's purpose and importance to the bigger picture. Success Measures: Briefly mention any high-level metrics that will be used to gauge overall progress towards the objective. Target Audience: Specify who this objective applies to or who will be most impacted by achieving it.
- 3. OBJECTIVE Visuals An objective in OKR is the foundation of your goal setting. It's a concise, inspirational statement that captures what you want to achieve. Unlike a vague wish, a good objective uses strong verbs and outlines a specific, ambitious target. It should also connect to the bigger picture, providing a sense of purpose and motivating the team to strive for something meaningful. Essentially, the objective is your "what" - it defines the overall direction and gets everyone on board before diving into the measurable details of how you'll get
- 4. KEY RESULT - Sales On Track At Risk Increase revenue by 20% compared to last year. Achieve a 1.5% conversion rate on website leads. Shorten sales cycle from 30 days to 20 days on average. Add Your Text
- 5. Data: Briefly explain what data the graph represents. KEY RESULT - Sales Graph Description Insights: Highlight any key takeaways viewers should get from the graph. Target Visualization: Ensure the target value is clearly displayed. 0 1 2 3 4 5 6 7 Category 1 Chart Title Series 1 Series 2 Series 3 Series 4 Series
- 6. KEY RESULT - Marketing On Track At Risk Grow website traffic by 30% month-over-month. Improve click-through rate on marketing emails by 5%. Increase brand awareness by 10% based on social media reach. Add another result here.
- 7. KEY RESULT - Sales Graph Description Data: Briefly explain what data the graph represents. Insights: Highlight any key takeaways viewers should get from the graph. Target Visualization: Ensure the target value is clearly displayed. 0 1 2 3 4 5 6 7 Category 1 Chart Title Series 1 Series 2 Series 3 Series 4 Series
- 8. KEY RESULT – Customer Success On Track At Risk Reduce customer churn rate to below 5% Achieve a customer satisfaction score of 90% or higher. Increase the number of customers using a premium service by 15%.
- 9. KEY RESULT - Sales Graph Description Data: Briefly explain what data the graph represents. Insights: Highlight any key takeaways viewers should get from the graph. Target Visualization: Ensure the target value is clearly displayed. 0 1 2 3 4 5 6 7 Category 1 Chart Title Series 1 Series 2 Series 3 Series 4 Series
- 10. KEY RESULT – Extra Key Result On Track At Risk Reduce customer churn rate to below 5% Achieve a customer satisfaction score of 90% or higher. Increase the number of customers using a premium service by 15%. Extra Ke Result
- 11. KEY RESULT - Sales Graph Description Data: Briefly explain what data the graph represents. Insights: Highlight any key takeaways viewers should get from the graph. Target Visualization: Ensure the target value is clearly displayed. 0 1 2 3 4 5 6 7 Category 1 Chart Title Series 1 Series 2 Series 3 Series 4 Series
- 12. KEY RESULT – Extra Key Result On Track At Risk Reduce customer churn rate to below 5% Achieve a customer satisfaction score of 90% or higher. Increase the number of customers using a premium service by 15%. Extra Key Result
- 13. KEY RESULT - Sales Graph Description Data: Briefly explain what data the graph represents. Insights: Highlight any key takeaways viewers should get from the graph. Target Visualization: Ensure the target value is clearly displayed. 0 1 2 3 4 5 6 7 Category 1 Chart Title Series 1 Series 2 Series 3 Series 4 Series
- 14. Replacing Pictures / Icons 1. Double click on an image or icon. 2. Right click on an image or icon. 3. Select the new picture from This Device , From Stock Images, From Icons. 2. Choose Change Graphic.
- 15. An Overview and adding More Slides Watch this video to see an overview on how to use this template.
- 16. Save As a PowerPoint Show If you don’t want to include all these slides in your main presentation but still want to access this OKR template from your main presentation, watch this video. View this video on our YouTube Channel
- 17. Changing theme Colors in PowerPoint 2013 and newer 1. Click on the design tab 4. Select Customize Colors. 2. Select This Arrow 3. Select Colors
- 18. All the accents plus the Text/Background-Dark2 are what control the colors in this template. • Left click on a color drop down to bring up the colors. • The top square that is highlighted is the main color, select it and change its color. • Click on More Colors to edit RBG values and select new colors. • Create a new name for your theme and click the save button at the bottom. Changing theme ACCENT Colors
- 19. Remove Animation from any slide 1. Go to the slide you would like to remove the animation from. 2. Hold Ctrl and press a on you keyboard to select all. If on a Mac hold Command and press a. 3. With everything on that slide selected, go to the animation menu and select None.
- 20. Questions? More Information? • PresenterMedia.com • support@presentermedia .com • 4416 S. Technology Dr • Sioux Falls, SD 57106