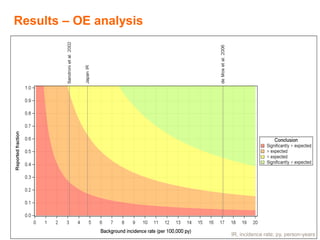
This document summarizes a sensitivity analysis approach to "observed versus expected" analyses that accounts for uncertainties around reporting bias and background incidence rates. It presents a visual framework called an "OE-plane" that plots the observed number of reports against the expected number for a range of background incidence rates and reported fractions. This allows evaluating whether an excess of observed reports could be due to bias or is robust to plausible variations in the assumptions. The approach provides regulators with information to draw their own conclusions based on which ranges of rates and fractions they deem most relevant.

![The Expected
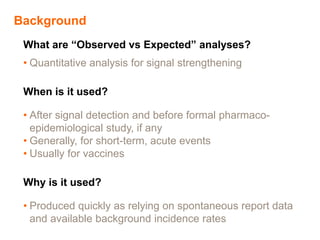
[Expected within the Risk Period] =
[Background IR] * [Person_time at risk]
Under null hypothesis of no causal association of the
condition to the vaccination
IR, incidence rate](https://image.slidesharecdn.com/0ef8b186-139a-48c9-94f9-c7dda581ec92-150915124945-lva1-app6891/85/Observed-versus-expectedanalyses_FINAL_ISPE2014-5-320.jpg)
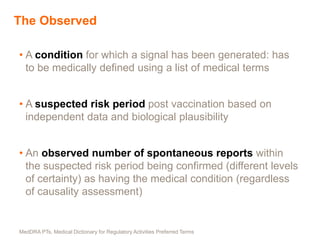
![[Expected within the Risk Period] = [Background
IR] * [Person_time at risk]
Background IR
• Should come from a population as close as possible to
the vaccinated population (demographic characteristics,
calendar years, region, etc.)
• The definition of the condition should be consistent with
the definition used for the observed
Person_time at risk
• Person_time at risk = exposed persons * suspected risk
period
Sales data are often used as a proxy of the exposure](https://image.slidesharecdn.com/0ef8b186-139a-48c9-94f9-c7dda581ec92-150915124945-lva1-app6891/85/Observed-versus-expectedanalyses_FINAL_ISPE2014-6-320.jpg)