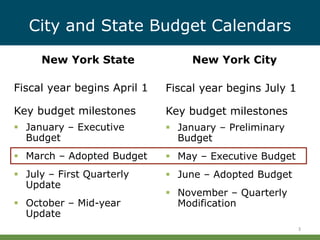
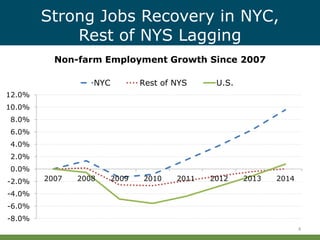
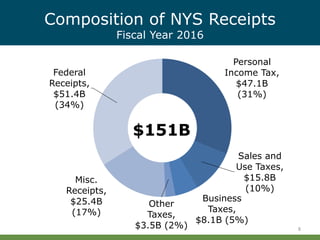
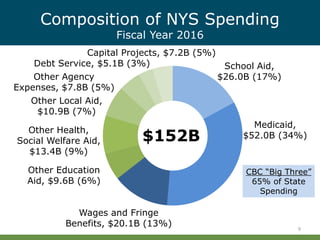
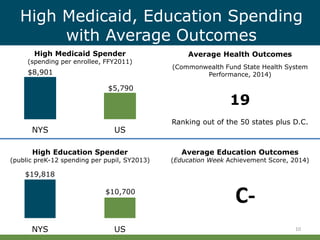
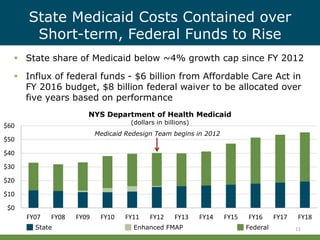
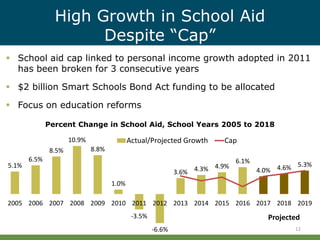
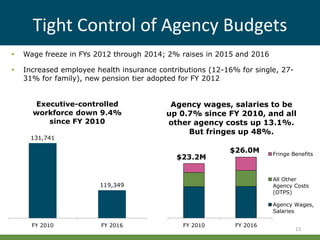
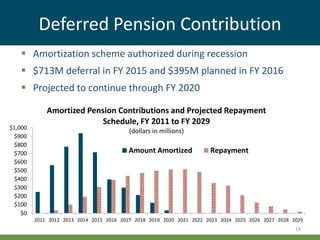
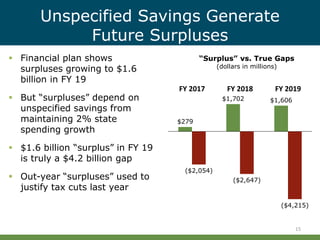
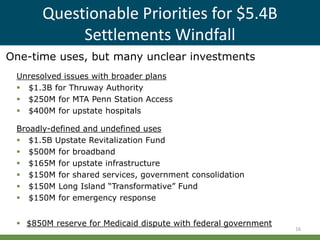
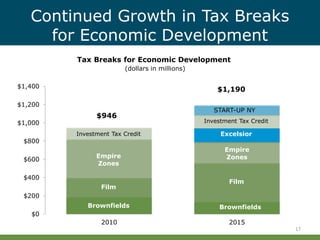
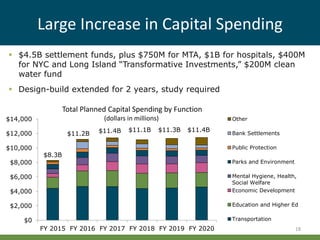
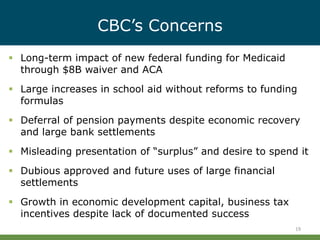
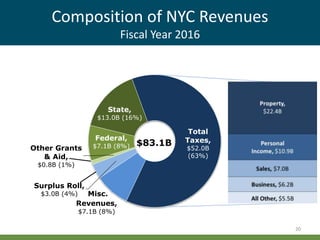
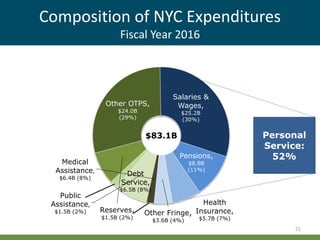
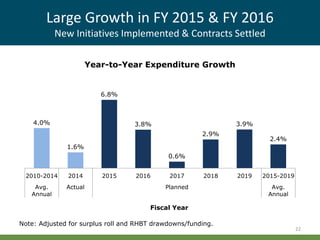
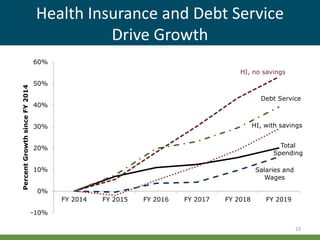
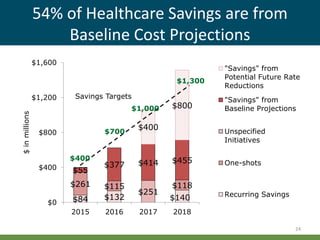
Trustee
Budget Briefing
June 23, 2015
 Budget Calendars
 Economic Indicators
 New York State
 New York City
Overview
Fiscal year begins April 1
Key budget milestones
 January – Executive
Budget
 March – Adopted Budget
 July – First Quarterly
Update
 October – Mid-year
Update
City and State Budget Calendars
New York State New York City
3
Fiscal year begins July 1
Key budget milestones
 January – Preliminary
Budget
 May – Executive Budget
 June – Adopted Budget
 November – Quarterly
Modification
Strong Jobs Recovery in NYC,
Rest of NYS Lagging
4
Non-farm Employment Growth Since 2007
-8.0%
-6.0%
-4.0%
-2.0%
0.0%
2.0%
4.0%
6.0%
8.0%
10.0%
12.0%
2007 2008 2009 2010 2011 2012 2013 2014
NYC Rest of NYS U.S.
High Growth in Low-Paid Jobs
5
Change in NY Jobs from 2007 to 2013
(2013 Average Annual Wage on Top of Bars)
(100)
(50)
-
50
100
150
Leisure and
Hospitality
Health Care
and Social
Assistance
Professional
and Business
Services
Education Retail Trade Financial
Activities
Government
ThousandsofJobs
$27,847
$46,835
$82,969
$51,408 $31,453
$162,653
$57,128
1.8%
1.3%
1.3%
1.1%
1.6%
1.5%
1.3%
1.2%
2015 2016 2017 2018
3.7%
4.4%
5.1%
5.0%
2.8%
3.7%
4.5%
4.2%
2015 2016 2017 2018
New York State Division of Budget
Optimistic Economic Forecasts
6
Annual Employment
Growth
Annual Personal Income
Growth
New York City Office of Management and Budget
New York State Budget
7
Personal
Income Tax,
$47.1B
(31%)
Sales and
Use Taxes,
$15.8B
(10%)
Business
Taxes,
$8.1B (5%)
Other
Taxes,
$3.5B (2%)
Misc.
Receipts,
$25.4B
(17%)
Federal
Receipts,
$51.4B
(34%)
Composition of NYS Receipts
Fiscal Year 2016
8
$151B
Composition of NYS Spending
Fiscal Year 2016
9
$152B
School Aid,
$26.0B (17%)
Medicaid,
$52.0B (34%)
Wages and Fringe
Benefits, $20.1B (13%)
Other Education
Aid, $9.6B (6%)
Other Health,
Social Welfare Aid,
$13.4B (9%)
Other Local Aid,
$10.9B (7%)
Other Agency
Expenses, $7.8B (5%)
Debt Service, $5.1B (3%)
Capital Projects, $7.2B (5%)
CBC “Big Three”
65% of State
Spending
High Medicaid, Education Spending
with Average Outcomes
10
(Commonwealth Fund State Health System
Performance, 2014)
19
Ranking out of the 50 states plus D.C.
High Medicaid Spender
(spending per enrollee, FFY2011)
NYS US
$8,901
$5,790
Average Health Outcomes
NYS US
$19,818
$10,700
High Education Spender
(public preK-12 spending per pupil, SY2013)
Average Education Outcomes
(Education Week Achievement Score, 2014)
C-
$0
$10
$20
$30
$40
$50
$60
FY07 FY08 FY09 FY10 FY11 FY12 FY13 FY14 FY15 FY16 FY17 FY18
State Medicaid Costs Contained over
Short-term, Federal Funds to Rise
11
 State share of Medicaid below ~4% growth cap since FY 2012
 Influx of federal funds - $6 billion from Affordable Care Act in
FY 2016 budget, $8 billion federal waiver to be allocated over
five years based on performance
NYS Department of Health Medicaid
(dollars in billions)
Medicaid Redesign Team begins in 2012
State Enhanced FMAP Federal
High Growth in School Aid
Despite “Cap”
12
 School aid cap linked to personal income growth adopted in 2011
has been broken for 3 consecutive years
 $2 billion Smart Schools Bond Act funding to be allocated
 Focus on education reforms
Percent Change in School Aid, School Years 2005 to 2018
5.1%
6.5%
8.5%
10.9%
8.8%
1.0%
-3.5%
-6.6%
3.6% 4.3% 4.9%
6.1%
4.0% 4.6% 5.3%
2005 2006 2007 2008 2009 2010 2011 2012 2013 2014 2015 2016 2017 2018 2019
Actual/Projected Growth Cap
Projected
FY 2010 FY 2016
Agency wages, salaries to be
up 0.7% since FY 2010, and all
other agency costs up 13.1%.
But fringes up 48%.
Fringe Benefits
All Other
Agency Costs
(OTPS)
Agency Wages,
Salaries
$26.0M
Tight Control of Agency Budgets
 Wage freeze in FYs 2012 through 2014; 2% raises in 2015 and 2016
 Increased employee health insurance contributions (12-16% for single, 27-
31% for family), new pension tier adopted for FY 2012
13
131,741
119,349
FY 2010 FY 2016
Executive-controlled
workforce down 9.4%
since FY 2010
$23.2M
Deferred Pension Contribution
14
 Amortization scheme authorized during recession
 $713M deferral in FY 2015 and $395M planned in FY 2016
 Projected to continue through FY 2020
$0
$100
$200
$300
$400
$500
$600
$700
$800
$900
$1,000
2011 2012 2013 2014 2015 2016 2017 2018 2019 2020 2021 2022 2023 2024 2025 2026 2027 2028 2029
Amortized Pension Contributions and Projected Repayment
Schedule, FY 2011 to FY 2029
(dollars in millions)
Amount Amortized Repayment
$279
$1,702 $1,606
($2,054)
($2,647)
($4,215)
FY 2017 FY 2018 FY 2019
Unspecified Savings Generate
Future Surpluses
15
 Financial plan shows
surpluses growing to $1.6
billion in FY 19
 But “surpluses” depend on
unspecified savings from
maintaining 2% state
spending growth
 $1.6 billion “surplus” in FY 19
is truly a $4.2 billion gap
 Out-year “surpluses” used to
justify tax cuts last year
“Surplus” vs. True Gaps
(dollars in millions)
Questionable Priorities for $5.4B
Settlements Windfall
Unresolved issues with broader plans
 $1.3B for Thruway Authority
 $250M for MTA Penn Station Access
 $400M for upstate hospitals
Broadly-defined and undefined uses
 $1.5B Upstate Revitalization Fund
 $500M for broadband
 $165M for upstate infrastructure
 $150M for shared services, government consolidation
 $150M Long Island “Transformative” Fund
 $150M for emergency response
16
One-time uses, but many unclear investments
 $850M reserve for Medicaid dispute with federal government
$0
$200
$400
$600
$800
$1,000
$1,200
$1,400
2010 2015
Continued Growth in Tax Breaks
for Economic Development
17
Tax Breaks for Economic Development
(dollars in millions)
BrownfieldsBrownfields
Film
Film
Empire
ZonesEmpire
Zones
Investment Tax Credit
Excelsior
START-UP NY
$1,190
$946
Large Increase in Capital Spending
Total Planned Capital Spending by Function
(dollars in millions)
18
$0
$2,000
$4,000
$6,000
$8,000
$10,000
$12,000
$14,000
FY 2015 FY 2016 FY 2017 FY 2018 FY 2019 FY 2020
Other
Bank Settlements
Public Protection
Parks and Environment
Mental Hygiene, Health,
Social Welfare
Economic Development
Education and Higher Ed
Transportation
$11.4B
 $4.5B settlement funds, plus $750M for MTA, $1B for hospitals, $400M
for NYC and Long Island “Transformative Investments,” $200M clean
water fund
 Design-build extended for 2 years, study required
$8.3B
$11.2B
$11.1B $11.3B $11.4B
CBC’s Concerns
19
 Long-term impact of new federal funding for Medicaid
through $8B waiver and ACA
 Large increases in school aid without reforms to funding
formulas
 Deferral of pension payments despite economic recovery
and large bank settlements
 Misleading presentation of “surplus” and desire to spend it
 Dubious approved and future uses of large financial
settlements
 Growth in economic development capital, business tax
incentives despite lack of documented success
Composition of NYC Revenues
Fiscal Year 2016
20
Total
Taxes,
$52.0B
(63%)
Misc.
Revenues,
$7.1B (8%)
Surplus Roll,
$3.0B (4%)
Other Grants
& Aid,
$0.8B (1%)
Federal,
$7.1B (8%)
State,
$13.0B (16%)
$83.1B
Composition of NYC Expenditures
Fiscal Year 2016
21
Personal
Service:
52%
Medical
Assistance,
$6.4B (8%)
Public
Assistance,
$1.5B (2%)
Debt
Service,
$6.5B (8%)
Reserves,
$1.5B (2%)
Other OTPS,
$24.0B
(29%)
Salaries &
Wages,
$25.2B
(30%)
Pensions,
$8.8B
(11%)
Health
Insurance,
$5.7B (7%)
Other Fringe,
$3.6B (4%)
$83.1B
Large Growth in FY 2015 & FY 2016
New Initiatives Implemented & Contracts Settled
22
4.0%
1.6%
6.8%
3.8%
0.6%
2.9%
3.9%
2.4%
2010-2014 2014 2015 2016 2017 2018 2019 2015-2019
Avg.
Annual
Actual Planned Avg.
Annual
Fiscal Year
Year-to-Year Expenditure Growth
Note: Adjusted for surplus roll and RHBT drawdowns/funding.
Health Insurance and Debt Service
Drive Growth
Total
Spending
Salaries and
Wages
HI, no savings
HI, with savings
Debt Service
-10%
0%
10%
20%
30%
40%
50%
60%
FY 2014 FY 2015 FY 2016 FY 2017 FY 2018 FY 2019
PercentGrowthsinceFY2014
23
54% of Healthcare Savings are from
Baseline Cost Projections
$84 $132 $140
$261 $115 $118
$251
$55
$377 $414 $455
$400
$800
$0
$400
$800
$1,200
$1,600
2015 2016 2017 2018
$inmillions
"Savings" from
Potential Future Rate
Reductions
"Savings" from
Baseline Projections
Unspecified
Initiatives
One-shots
Recurring Savings
$400
$1,300
$1,000
$700
24
Savings Targets
The Citywide Savings Program
(dollars in millions) 2015 2016 2017 2018 2019 TOTAL
Total Savings ($589) ($466) ($641) ($627) ($584) ($2,906)
Debt Service ($241) ($159) ($393) ($365) ($345) ($1,502)
Agency Savings ($348) ($306) ($248) ($262) ($240) ($1,404)
Federal/State Adjustments 44% 11% 2% 2% 2% ($199)
Adjustments/Re-estimates 26% 25% 20% 16% 18% ($303)
Revenues 19% 12% 11% 10% 10% ($181)
Efficiencies/In-sourcing 11% 35% 45% 51% 47% ($500)
Procurement 0% 18% 22% 21% 23% ($222)
25
FY16 Headcount 14,400> than FY14
Stays at that level for the length of the plan
26
4,545
3,461
2,082
1,445
0
2,986
Pedagogical Health &
Social
Services
Civilians in
Uniform
Departments
Uniforms, less
police
Police All Other
Increases in FY 2016 Projected Headcount over
FY 2014 Actual
3.9% 12.4% 8.4% 5.5% 4.3%
Ten-Year Capital Strategy Totals
$83.8 Billion
Education
$23.0,
27%
Water &
Sewer
System,
$14.7,
18%
Housing,
$7.5,
9%
All Others,
$20.6,
25%
Transportation,
$12.6
15%
Buildings & Equip,
$5.4,
6%
$ in billions
27
Investment
Type
Replacement,
$16.5,
20%
Expansion,
$19.6,
23%
State of
Good Repair,
$47.6,
57%
Significant Increase
to Accommodate New Priorities
28
AGENCY
Increase
Over 2014
Strategy
($ in billions)
NOTE
Housing Pres. & Dev. $4.6 Mayor’s Housing Plan
Transportation $4.4 Bridge investments; Road repair acceleration
Education $3.4 Increase in repair and rehabilitation work
Citywide Equipment $3.1 ONENYC energy efficiency; building retrofits
Economic Development $3.0 $2 billion Neighborhood Revitalization Fund
Environmental Protection $2.3 Green Infrastructure Program; Sewer expansion
Health & Hospitals Corp. $1.5 Federal funds for Sandy-related reconstruction
Parks and Recreation $1.5 Doubling investment for repair/reconstruction
Courts $1.1 Mandated program
NYCHA, MTA, Libraries $2.1 Response to agency requests
ALL AGENCIES $30.1
Affordability is a Concern: Debt Burden Is High
According to Metrics Used by Rating Agencies
Debt Outstanding, FY2016
5.0%
6.0%
8.5%
13.4%
As a Share of Real
Property Value
As a Share of
Personal Income
Benchmark for "High"
Burden
New York City
Debt Service, FY2016
12.0%
12.5%
As a Share of City-Funded
Expenditures
"Above Average" Burden
New York City
29Note: Does not include debt of the New York City Municipal Water Finance Authority.
Additional Risks: HHC & NYCHA
HHC
 HHC’s operating deficits
grow from $618m in FY
2016 to $1.5b in FY
2019 (cash basis)
 Corrective actions to
reduce deficit by $475m
in FY 2016 are
questionable
 City’s plan for HHC to
assume health service
provision for correctional
facilities could further
strain resources
NYCHA
 NYCHA’s operating gap
grows from $150m in
2016 to $194m in FY 2019
 $17b in capital needs
 Mayor providing over
$100m in annual operating
support
 NYCHA & City released 10-
year strategic plan;
includes CBC’s
recommendations
30
CBC’s Concerns
Operating Budget
 Additional expenditures will likely be added
 Savings Program is too small, not sufficiently focused
on efficiencies that produce recurring savings to boost
reserves
 Majority of healthcare savings counted toward MLC &
City targets are artificial
 HHC & NYCHA’s financial challenges persist
Capital and Debt
 Capital plan is very large, debt service is growing
 No use of pay-as-you-go capital to limit debt
increases
 Reporting on capital spending is inadequate
31
Questions/Comments?
32

CBC's NYC and NYS Budget Briefings

  • 1.
  • 2.
     Budget Calendars Economic Indicators  New York State  New York City Overview
  • 3.
    Fiscal year beginsApril 1 Key budget milestones  January – Executive Budget  March – Adopted Budget  July – First Quarterly Update  October – Mid-year Update City and State Budget Calendars New York State New York City 3 Fiscal year begins July 1 Key budget milestones  January – Preliminary Budget  May – Executive Budget  June – Adopted Budget  November – Quarterly Modification
  • 4.
    Strong Jobs Recoveryin NYC, Rest of NYS Lagging 4 Non-farm Employment Growth Since 2007 -8.0% -6.0% -4.0% -2.0% 0.0% 2.0% 4.0% 6.0% 8.0% 10.0% 12.0% 2007 2008 2009 2010 2011 2012 2013 2014 NYC Rest of NYS U.S.
  • 5.
    High Growth inLow-Paid Jobs 5 Change in NY Jobs from 2007 to 2013 (2013 Average Annual Wage on Top of Bars) (100) (50) - 50 100 150 Leisure and Hospitality Health Care and Social Assistance Professional and Business Services Education Retail Trade Financial Activities Government ThousandsofJobs $27,847 $46,835 $82,969 $51,408 $31,453 $162,653 $57,128
  • 6.
    1.8% 1.3% 1.3% 1.1% 1.6% 1.5% 1.3% 1.2% 2015 2016 20172018 3.7% 4.4% 5.1% 5.0% 2.8% 3.7% 4.5% 4.2% 2015 2016 2017 2018 New York State Division of Budget Optimistic Economic Forecasts 6 Annual Employment Growth Annual Personal Income Growth New York City Office of Management and Budget
  • 7.
  • 8.
    Personal Income Tax, $47.1B (31%) Sales and UseTaxes, $15.8B (10%) Business Taxes, $8.1B (5%) Other Taxes, $3.5B (2%) Misc. Receipts, $25.4B (17%) Federal Receipts, $51.4B (34%) Composition of NYS Receipts Fiscal Year 2016 8 $151B
  • 9.
    Composition of NYSSpending Fiscal Year 2016 9 $152B School Aid, $26.0B (17%) Medicaid, $52.0B (34%) Wages and Fringe Benefits, $20.1B (13%) Other Education Aid, $9.6B (6%) Other Health, Social Welfare Aid, $13.4B (9%) Other Local Aid, $10.9B (7%) Other Agency Expenses, $7.8B (5%) Debt Service, $5.1B (3%) Capital Projects, $7.2B (5%) CBC “Big Three” 65% of State Spending
  • 10.
    High Medicaid, EducationSpending with Average Outcomes 10 (Commonwealth Fund State Health System Performance, 2014) 19 Ranking out of the 50 states plus D.C. High Medicaid Spender (spending per enrollee, FFY2011) NYS US $8,901 $5,790 Average Health Outcomes NYS US $19,818 $10,700 High Education Spender (public preK-12 spending per pupil, SY2013) Average Education Outcomes (Education Week Achievement Score, 2014) C-
  • 11.
    $0 $10 $20 $30 $40 $50 $60 FY07 FY08 FY09FY10 FY11 FY12 FY13 FY14 FY15 FY16 FY17 FY18 State Medicaid Costs Contained over Short-term, Federal Funds to Rise 11  State share of Medicaid below ~4% growth cap since FY 2012  Influx of federal funds - $6 billion from Affordable Care Act in FY 2016 budget, $8 billion federal waiver to be allocated over five years based on performance NYS Department of Health Medicaid (dollars in billions) Medicaid Redesign Team begins in 2012 State Enhanced FMAP Federal
  • 12.
    High Growth inSchool Aid Despite “Cap” 12  School aid cap linked to personal income growth adopted in 2011 has been broken for 3 consecutive years  $2 billion Smart Schools Bond Act funding to be allocated  Focus on education reforms Percent Change in School Aid, School Years 2005 to 2018 5.1% 6.5% 8.5% 10.9% 8.8% 1.0% -3.5% -6.6% 3.6% 4.3% 4.9% 6.1% 4.0% 4.6% 5.3% 2005 2006 2007 2008 2009 2010 2011 2012 2013 2014 2015 2016 2017 2018 2019 Actual/Projected Growth Cap Projected
  • 13.
    FY 2010 FY2016 Agency wages, salaries to be up 0.7% since FY 2010, and all other agency costs up 13.1%. But fringes up 48%. Fringe Benefits All Other Agency Costs (OTPS) Agency Wages, Salaries $26.0M Tight Control of Agency Budgets  Wage freeze in FYs 2012 through 2014; 2% raises in 2015 and 2016  Increased employee health insurance contributions (12-16% for single, 27- 31% for family), new pension tier adopted for FY 2012 13 131,741 119,349 FY 2010 FY 2016 Executive-controlled workforce down 9.4% since FY 2010 $23.2M
  • 14.
    Deferred Pension Contribution 14 Amortization scheme authorized during recession  $713M deferral in FY 2015 and $395M planned in FY 2016  Projected to continue through FY 2020 $0 $100 $200 $300 $400 $500 $600 $700 $800 $900 $1,000 2011 2012 2013 2014 2015 2016 2017 2018 2019 2020 2021 2022 2023 2024 2025 2026 2027 2028 2029 Amortized Pension Contributions and Projected Repayment Schedule, FY 2011 to FY 2029 (dollars in millions) Amount Amortized Repayment
  • 15.
    $279 $1,702 $1,606 ($2,054) ($2,647) ($4,215) FY 2017FY 2018 FY 2019 Unspecified Savings Generate Future Surpluses 15  Financial plan shows surpluses growing to $1.6 billion in FY 19  But “surpluses” depend on unspecified savings from maintaining 2% state spending growth  $1.6 billion “surplus” in FY 19 is truly a $4.2 billion gap  Out-year “surpluses” used to justify tax cuts last year “Surplus” vs. True Gaps (dollars in millions)
  • 16.
    Questionable Priorities for$5.4B Settlements Windfall Unresolved issues with broader plans  $1.3B for Thruway Authority  $250M for MTA Penn Station Access  $400M for upstate hospitals Broadly-defined and undefined uses  $1.5B Upstate Revitalization Fund  $500M for broadband  $165M for upstate infrastructure  $150M for shared services, government consolidation  $150M Long Island “Transformative” Fund  $150M for emergency response 16 One-time uses, but many unclear investments  $850M reserve for Medicaid dispute with federal government
  • 17.
    $0 $200 $400 $600 $800 $1,000 $1,200 $1,400 2010 2015 Continued Growthin Tax Breaks for Economic Development 17 Tax Breaks for Economic Development (dollars in millions) BrownfieldsBrownfields Film Film Empire ZonesEmpire Zones Investment Tax Credit Investment Tax Credit Excelsior START-UP NY $1,190 $946
  • 18.
    Large Increase inCapital Spending Total Planned Capital Spending by Function (dollars in millions) 18 $0 $2,000 $4,000 $6,000 $8,000 $10,000 $12,000 $14,000 FY 2015 FY 2016 FY 2017 FY 2018 FY 2019 FY 2020 Other Bank Settlements Public Protection Parks and Environment Mental Hygiene, Health, Social Welfare Economic Development Education and Higher Ed Transportation $11.4B  $4.5B settlement funds, plus $750M for MTA, $1B for hospitals, $400M for NYC and Long Island “Transformative Investments,” $200M clean water fund  Design-build extended for 2 years, study required $8.3B $11.2B $11.1B $11.3B $11.4B
  • 19.
    CBC’s Concerns 19  Long-termimpact of new federal funding for Medicaid through $8B waiver and ACA  Large increases in school aid without reforms to funding formulas  Deferral of pension payments despite economic recovery and large bank settlements  Misleading presentation of “surplus” and desire to spend it  Dubious approved and future uses of large financial settlements  Growth in economic development capital, business tax incentives despite lack of documented success
  • 20.
    Composition of NYCRevenues Fiscal Year 2016 20 Total Taxes, $52.0B (63%) Misc. Revenues, $7.1B (8%) Surplus Roll, $3.0B (4%) Other Grants & Aid, $0.8B (1%) Federal, $7.1B (8%) State, $13.0B (16%) $83.1B
  • 21.
    Composition of NYCExpenditures Fiscal Year 2016 21 Personal Service: 52% Medical Assistance, $6.4B (8%) Public Assistance, $1.5B (2%) Debt Service, $6.5B (8%) Reserves, $1.5B (2%) Other OTPS, $24.0B (29%) Salaries & Wages, $25.2B (30%) Pensions, $8.8B (11%) Health Insurance, $5.7B (7%) Other Fringe, $3.6B (4%) $83.1B
  • 22.
    Large Growth inFY 2015 & FY 2016 New Initiatives Implemented & Contracts Settled 22 4.0% 1.6% 6.8% 3.8% 0.6% 2.9% 3.9% 2.4% 2010-2014 2014 2015 2016 2017 2018 2019 2015-2019 Avg. Annual Actual Planned Avg. Annual Fiscal Year Year-to-Year Expenditure Growth Note: Adjusted for surplus roll and RHBT drawdowns/funding.
  • 23.
    Health Insurance andDebt Service Drive Growth Total Spending Salaries and Wages HI, no savings HI, with savings Debt Service -10% 0% 10% 20% 30% 40% 50% 60% FY 2014 FY 2015 FY 2016 FY 2017 FY 2018 FY 2019 PercentGrowthsinceFY2014 23
  • 24.
    54% of HealthcareSavings are from Baseline Cost Projections $84 $132 $140 $261 $115 $118 $251 $55 $377 $414 $455 $400 $800 $0 $400 $800 $1,200 $1,600 2015 2016 2017 2018 $inmillions "Savings" from Potential Future Rate Reductions "Savings" from Baseline Projections Unspecified Initiatives One-shots Recurring Savings $400 $1,300 $1,000 $700 24 Savings Targets
  • 25.
    The Citywide SavingsProgram (dollars in millions) 2015 2016 2017 2018 2019 TOTAL Total Savings ($589) ($466) ($641) ($627) ($584) ($2,906) Debt Service ($241) ($159) ($393) ($365) ($345) ($1,502) Agency Savings ($348) ($306) ($248) ($262) ($240) ($1,404) Federal/State Adjustments 44% 11% 2% 2% 2% ($199) Adjustments/Re-estimates 26% 25% 20% 16% 18% ($303) Revenues 19% 12% 11% 10% 10% ($181) Efficiencies/In-sourcing 11% 35% 45% 51% 47% ($500) Procurement 0% 18% 22% 21% 23% ($222) 25
  • 26.
    FY16 Headcount 14,400>than FY14 Stays at that level for the length of the plan 26 4,545 3,461 2,082 1,445 0 2,986 Pedagogical Health & Social Services Civilians in Uniform Departments Uniforms, less police Police All Other Increases in FY 2016 Projected Headcount over FY 2014 Actual 3.9% 12.4% 8.4% 5.5% 4.3%
  • 27.
    Ten-Year Capital StrategyTotals $83.8 Billion Education $23.0, 27% Water & Sewer System, $14.7, 18% Housing, $7.5, 9% All Others, $20.6, 25% Transportation, $12.6 15% Buildings & Equip, $5.4, 6% $ in billions 27 Investment Type Replacement, $16.5, 20% Expansion, $19.6, 23% State of Good Repair, $47.6, 57%
  • 28.
    Significant Increase to AccommodateNew Priorities 28 AGENCY Increase Over 2014 Strategy ($ in billions) NOTE Housing Pres. & Dev. $4.6 Mayor’s Housing Plan Transportation $4.4 Bridge investments; Road repair acceleration Education $3.4 Increase in repair and rehabilitation work Citywide Equipment $3.1 ONENYC energy efficiency; building retrofits Economic Development $3.0 $2 billion Neighborhood Revitalization Fund Environmental Protection $2.3 Green Infrastructure Program; Sewer expansion Health & Hospitals Corp. $1.5 Federal funds for Sandy-related reconstruction Parks and Recreation $1.5 Doubling investment for repair/reconstruction Courts $1.1 Mandated program NYCHA, MTA, Libraries $2.1 Response to agency requests ALL AGENCIES $30.1
  • 29.
    Affordability is aConcern: Debt Burden Is High According to Metrics Used by Rating Agencies Debt Outstanding, FY2016 5.0% 6.0% 8.5% 13.4% As a Share of Real Property Value As a Share of Personal Income Benchmark for "High" Burden New York City Debt Service, FY2016 12.0% 12.5% As a Share of City-Funded Expenditures "Above Average" Burden New York City 29Note: Does not include debt of the New York City Municipal Water Finance Authority.
  • 30.
    Additional Risks: HHC& NYCHA HHC  HHC’s operating deficits grow from $618m in FY 2016 to $1.5b in FY 2019 (cash basis)  Corrective actions to reduce deficit by $475m in FY 2016 are questionable  City’s plan for HHC to assume health service provision for correctional facilities could further strain resources NYCHA  NYCHA’s operating gap grows from $150m in 2016 to $194m in FY 2019  $17b in capital needs  Mayor providing over $100m in annual operating support  NYCHA & City released 10- year strategic plan; includes CBC’s recommendations 30
  • 31.
    CBC’s Concerns Operating Budget Additional expenditures will likely be added  Savings Program is too small, not sufficiently focused on efficiencies that produce recurring savings to boost reserves  Majority of healthcare savings counted toward MLC & City targets are artificial  HHC & NYCHA’s financial challenges persist Capital and Debt  Capital plan is very large, debt service is growing  No use of pay-as-you-go capital to limit debt increases  Reporting on capital spending is inadequate 31
  • 32.

Editor's Notes

  • #5 Strong and sustained growth in nyc, 300k above previous peak in 2008 ROS not yet back to pre-recession levels US growth more recently mirrors nyc, and is outpacing ros
  • #6 While job recovery in nyc has been strong, many of these jobs are low-wage Top gaining industry is leisure and hospitality – avg wage below $30k Top losing industry after government is financial services Bright spot has been professional and business services industry (legal, accounting, engineering, consulting, advertising)
  • #7 Both budget offices predict continued positive growth This follows historical norms but poses a greater risk as we move farther away from the last downturn We’ve had 5 and a half years of economic growth 2 items to note State and city are similar for employment but state sees avg 4.6% PI growht vs 3.8% for city Ibo, comptroller issued more optimistic projections for city
  • #9 In total the state’s budget is $151B. Biggest contributor to state receipts is the federal government, and that is largely due to the federal match on medicaid. $37B of federal revenues for Medicaid, rest for social services and education. $6B ACA, $2B sandy NY will get 100% match for newly eligible - childless adults between 100-133% FPL (90k ppl); about 1m ppl eligible for medicaid but not currently enrolled The next biggest revenue source is the personal income tax. Highly volatile source – up 18% in 2007, down 20% over the next 2 years. More than ¼ from est. payments. Top 1% pay almost half of pit The third biggest source is miscellaneous receipts. This includes bond proceeds ($3B) suny tuition ($3B), revenue on healthcare providers and services ($7B), the lottery ($3B), and other fee and license revenue (motor vehicle, abandoned property).
  • #10 The state is largely a pass-through entity, sending most of its to local governments and school districts and healthcare providers. In our work, we have focused largely on what we call the big 3. The state’s largest agencies include suny, mental health facilities, and corrections/prisons. The bulk of the remaining spending is other forms of local aid, which include higher education, transportation, public health, and other social services. Fringe benefits = $7B (health = $3, pensions = $2B, social security = $1B)
  • #11 Medicaid – number 3 behind alaska and RI, 54% above, more than 5m enrollees Driven by spending on disabled and elderly enrollees NY ranked 36 in avoidable hospital use and cost Education – number 1, 85% above, varies greatly
  • #12 Under the medicaid redesign team, industry experts came together to keep state medicaid spending under 4% growth A key to their success was the state’s promise to lobby for more federal funding The state recently won approval for a waiver that will send $8b in federal funds over 5 years Funding will be allocated based on collaboration and performance The state is also getting an additional $6b for aca related spending in 2016 The big question is have we actually controlled medicaid spending or is state spending just being replaced by federal dollars And what happens when the federal money ends
  • #13 School aid growth was also supposed to held under a cap For school aid the cap is tied to personal income growth However, the state adhered to cap for one year in 2013 and then adopted growth above the cap in 2014, 2015 and 2016 This has allowed the state to increase aid across the board to all districts, without being forced to examine school aid formulas and prioritize aid to the neediest districts School aid also included a new pot for full-day pre-k, most for nyc The state also enacted the smart schools bond act – voter approved This would provide $2 billion for some items that are traditionally paid for out of operating budgets – laptops, ipads Also included are funds for prek classrooms and eliminating trailers. Without the bond act, spending for these items would go through building aid formulas that tie state reimbursement to local need
  • #14 Pensions up 94%, health up 29% Very little growth in agency spending in recent years Employees got a 2% raise this year after a 3-year wage freeze Last labor contract also increased employee contributions to healthcare For family coverage, employees now contribute between 27 and 31% depending on salary level The number of employees has also dropped 9% since 2010 Exec-workforce bottomed last year at 117,807
  • #15 Through 2014, $2.5B deferred Funded ratio for ers down from 101% in 2010 to 89% in 2014
  • #16 Combination of medicaid and school aid growing around 4% and agency spending being held flat has kept growth in state spending to 2% By assuming that state spending will continue to be held to 2% for 3 more years, the state was able to show surpluses going foreword But spending is projected to grow 4% per year and the plan does not show the specific reductions that would be necessary Instead the plan includes unspecified, placeholder savings that grow to $5B This is highly unusual to show savings that have yet to be defined If the financial plan was being honest, it would show gaps growing from $1.8 to $3.4B Beyond the issue of transparency, theses surpluses were used to justify large tax cuts, including business tax cuts and a large property tax rebate outside NYC
  • #17 BNP = $3.6B for ignoring us sanctions law and processing transactions for sudanese, iranian and cuban entities
  • #18 Despite the fiscal discipline shown lately in many areas of the state budget, the state has allowed tax breaks to businesses to grow Part of the growth is from existing programs that have expanded, particularly the film tax credit that has grown to $427m per year The heavily criticized empire zones program was repealed and replaced by excelsior which has better accountability features The governor has proposed reforming the investment tax credit but the legislature rejected most proposals The state created start-up ny which creates tax free zones around the state to cost 10 years of no taxes There’s also been many small new programs And the state has committed more capital funding to economic development
  • #19 $750M over 3 years for MTA – 2018-2020 $700M for brooklyn hospitals, $300M for oneida The state is getting very close to its debt cap – capacity is $3B and projected to fall to $500M in 2019 It’s equal to 4% of personal income and applies to debt issued since 2000, which is now more than ¾ of debt outstanding Despite the tightening cap, the state has continued to commit to big new initiatives “other” includes $1.1B “core capital” projects in 2019 and 2020 added last yr but has no approp or bonding authority and $1.1B for state and municipal facilities program $200m in ads (40% for start-up)
  • #21 As Tammy mentioned, the 2016 fiscal year will begin in about a week on July 1. Since the final budget has not been adopted yet, what follows is a presentation of the Executive Budget, released last month. I’ll begin our discussion of the City’s $83 billion budget with a summary of the revenues that support it. Most of the City’s budget, 63%, is supported by tax revenue Property taxes are the largest source of revenue; they account for over a quarter of the City budget, but NYC is also unique among local governments in its revenues from several other taxes including personal income, sales, business, and other taxes Miscellaneous revenues account for another 8% and include charges for services, water & sewer charges, licenses and permits, fines and forfeitures, and asset sales. This year there is no revenue from the taxi medallion sales because the City postponed the next auction to 2017 to allow the industry to adjust to new market conditions as companies such as Uber and Lyft have grown. State and federal grants comprise another 24% of revenues. State grants are mostly education aid, including higher ed - $10 billion, or 77% of state funds. Federal grants are mostly for specific social service programs It’s also worth noting that the FY2016 budget is supported with $3 billion in revenues from the prior fiscal year, 2015. This money is used to prepay debt service.
  • #22 What does the City spend money on? Over half of the budget is comprised of personal service costs. Much of this is salaries and wages (30%) of the entire budget. Pensions also play a large share, comprising 11% of the budget, or $8.8 billion. These costs are currently projected to remain relatively flat during the plan; however, costs could increase. There has been increasing support at the City and State levels for restoring disability benefits to uniformed employees. If enacted, this could increase costs. Health insurance costs, which includes costs for active employees and retirees, are projected to be $5.7 billion. These costs are projected to grow an average of 7% annually during the financial plan. Another large component of the budget is Medicaid; Unlike other states, New York requires local governments pay a share of their Medicaid expenses; growth is capped at this amount as the State has taken over the growth of the local share of Medicaid, so the City will continue to pay about $6.4 billion annually Debt Service is a large share of the budget because the City relies heavily on borrowing to support its substantial capital plan. Public assistance is about 2% of the budget and the City Funds share is $653 million. Though a relatively small share of the entire budget, these costs are worth noting because they have been growing since FY 2014 when the Administration initiated new rules associated that allow public assistance recipients greater flexibility in rescheduling appointments, thereby reducing the number that lose their benefits for noncompliance. Caseloads have grown as a result and the City’s costs have grown about 20% since FY 2014. The fiscal year 2016 budget includes $1.5 billion in reserves. The Mayor set aside $1 billion in the General Reserve, which is relatively high. The prior Administration typically put about $300 million in the General Reserve. In addition to this $1 billion, the Mayor created a new reserve/fund called the Capital Stabilization Fund, with $500 million. This fund has been described as both a reserve to cover debt service in the event of a downturn as well as funds for capital project scoping.
  • #23 How does this spending relate to prior years? Spending is projected to grow 3.8 percent in fiscal year 2016, but this is on top of 6.8 percent growth in 2015, as the Mayor began to implement his initiatives and settle union contracts Projected spending in the remainder of the plan is relatively low: average annual expenses grow just 2.4%. This seems unrealistic, given that needs will likely evolve and grow as the mayor implements new initiatives. Also, initiatives that were baselined in the budget for a certain amount in the last financial plan have already grown in response to demand. The NYCID program is a good example. Last year it was projected to cost $21 million from FY 2015 to FY 2018, but has increased more than threefold to over $68 million during that time in response to high demand. Moreover, the plan’s annual spending growth is low relative to the 2010-2014 average annual growth of 4%. Also, not all of the contracts have been settled and the PBA is currently in binding arbitration because they do not agree to the 11% pattern; in the past the PBA has won a larger pattern through this process, which would increase the City’s costs.
  • #24 What items do drive growth? This chart shows the increases in projected spending relative to actual spending in fiscal year 2014 Growth in Salaries & Wages reflects the new pattern, which CBC deemed to be reasonable. The established pattern assumed in the budget includes 10% raises over 7 years for civilians and 11% for uniforms. But, as I mentioned, the unsettled contracts with the police, firefighters, and corrections officers remain a risk to the budget. Another expense driver is health insurance; last year the City struck a deal with the MLC to offset the cost of the labor settlement with healthcare savings. The current plan projections assume that those savings will occur. If they do not materialize, there would be growth of 53% over 2014 during the financial plan. If the savings targets are achieved, total growth will be 29% over 2014 spending. Debt Service –Debt service is projected to grow 39% over 2014 levels…this reflects the mayor’s ambitious ten-year capital strategy, which starts with the 4-year capital commitment plan. The City plans to finance capital commitments in this plan exclusively through new debt issuances, which are expected to peak at $7 billion in fiscal year 2019.
  • #25 As you saw, there is a pretty large gap between the cost of health insurance with and without the savings targets; so let’s assess where we are with those goals Here are the annual targets – the $1.3 billion is intended to be recurring after 2018 When the deal was announced, CBC publically stated that this was a great opportunity to identify recurring savings that bend the cost curve by reducing cost of services or utilization. However, the City made it clear that savings would be calculated against the financial plan projections. This method does nothing for reducing recurring healthcare costs. In April, Bob Linn presented the City and MLC’s progress toward reaching these targets. Linn reported they have met target for this year and are just $76 million shy of reaching their goal for 2016. Unfortunately, not all savings meet the criteria of being recurring and bending the cost curve. There have been savings through cost reduction, such as the minimum premium, care management, and specialty drugs initiatives. However, there have also been several “one-shots” which do not bend the cost curve, such as auditing health insurance rolls to ensure all dependents were eligible and switching employees to the lower-cost individual health plans. The “unspecified initiatives” in 2017 have not been detailed to the degree that the initiatives in the other years, so they include recurring savings and one-shots. Then we have “savings” that are generated because the City’s insurance provider set a premium rate increase below the increase the City assumed in the financial plan. The City assumed a 9% increase in 2016, but the actual rate was 2.89%. This has resulted in “savings” that did not bend the cost curve, but were just a consequence of a premium rate reduction. We estimated in a blog post a few months ago that if a similar rate reductions occur, then there could be additional “savings” of $400 million that year and $800 million in 2018. Those savings could bring the savings totals above the targets, and the terms of the agreement state that savings up to $365 million will go to the union employees as a pensionable bonus.
  • #26 This is one way the City is saving money in the budget The Mayor did not include a PEG in his two preliminary budgets, but included a voluntary program in this Executive Budget. Unlike prior PEG programs, agencies did not have to meet specific targets but were asked to come up with their own savings; As a result, only 31 agencies participated, or 41%. And the program is insufficient; the total is just $2.9 billion during the plan, less than half of one percent of the City’s budget And, over half of the program is debt service savings from refunding and lowering interest rate assumptions Most of the remaining $1.4 billion in “Agency Savings” includes things other than productivity measures For instance, federal/state adjustments, such as transferring employees to be funded through federal and state revenue streams, accounts for $200 million during the plan; adjustments and re-estimates of expenses account for $300 million in savings; there are about $181 million in savings from revenues. In the end, only about $500 million for the entire plan, or $100 million annually, is from real agency productivity initiatives. This includes streamlining services, using master contracts, forgoing the use of contractors, reducing the use of discretionary overtime. The plan also includes about $55 million annually in procurement savings; however, there are no details about how this will be implemented
  • #27 A countervailing force to these efficiencies is the headcount growth. The 2016 Headcount is projected to grow substantially over the fiscal year 2014. There are dramatic increases reflecting the Mayor’s initiatives: the pedagogical headcount increase of nearly 4% reflects UPK and CUNY initiatives; the 12.4% increase in social services reflects a variety of initiatives for homelessness prevention, employment programs, mental health, etc. The uniform headcount is increasing, particularly in the Corrections Department as it implements new reforms and the fire department, which no longer has a hiring freeze. Notably, there is no scheduled increase in the police headcount; this has been an item of contention since last year; de Blasio was able to fend off this request from City Council in that budget cycle through civilianization of police officers, however this year the Commissioner is pushing harder for more cops
  • #28 This May the City released its 10-year capital strategy, which it releases every other year Commitments in this strategy increased by $30 billion increase over the prior plan in Bloomberg’s last year, a 56% increase. The pie chart to the left shows the distribution by project type. Education accounts for over one-quarter of the strategy, and includes $10.6 billion to rehabilitate, replace and upgrade building components as well as $5.6 billion of system expansion to address capacity; as well as $2.7 billion for educational enhancements, including technology in the classroom The Department of Environmental protection includes $5.6 billion for waste water treatment for water pollution control and $2.8 billion for reconstruction or replacement of components in the City’s wastewater treatment facilities and conveyance infrastructure. Transportation commitments total $12.6 billion, with bridges and highways comprising the bulk of the funding – nearly a third of this is devoted to reconstruction of bridges rates “good” or “fair” including $1.7 billion for reconstruction of the BQE Housing comitments comprise $7.5 billion, reflecting the affordable housing plan.
  • #29 This table shows how much commitments increased by agency over the prior plan, a reflection of the mayor’s priorities The increase to HPD supports the affordable housing plan; in addition to that investment, $2 billion of the increase for Economic Developments is for the Neighborhood Revitalization Fund, which supports development projects in neighborhoods benefiting from new affordable housing. Other large increases in capital commitments support OneNYC’s energy efficiency investments, accelerated repair and rehabilitation of schools, roads, bridges and parks Here we see select agencies’ commitment One of the problems that CBC has identified with this plan is that there’s insufficient information to judge the impact of these investments and the increases to each agency Many of these are not increased as a result of a detailed needs assessment The strategy does not show how much progress will be made on state of good repair for infrastructure Details on OneNYC are lacking Performance metrics and project milestones for most agencies are lacking And operating costs that will arise from these investments are rarely considered
  • #30 Another concern with this strategy is its size and the resulting borrowing and debt service. There are several ways to think about the affordability of debt that indicate New York City already has a very high debt burden. As you can see here, NYC’s debt outstanding is 8.5% of real property value, surpassing the benchmark for a high burden used by rating agencies. NYC also has a high burden of debt outstanding when calculated as a share of personal income. The City’s debt service, or its required annual payments from the operating budget, are high when calculated as a share of City-funded expenditures. One metric that is not shown here is the debt service as a share of tax revenues; the City uses debt service as a share of tax revenues; this is projected to grow to 13.5% by 2019, from 11.7% in 2014. The City has been adamant that the plan is affordable because that the peak in 2019 is still below the 15% benchmark, but that assumes tax revenues will remain as projected.
  • #31 Though HHC and NYCHA are not City agencies, the City assumes substantial support for them since both are under financial distress CBC recently release reports about both agencies detailing their challenges HHC, which budgets on a cash basis, is facing a $618 million operating deficit for the 2016 fiscal year, growing to $1.9 billion in 2019. It has baselined a series of corrective actions, which are intended to reduce the deficit by $475 million this coming year. However, it is highly unlikely that HHC will achieve them. In FY 2015, HHC will only achieve 25% of its planned corrective actions and HHC saved just $480m through such measures since 2009 ($80m/yr) And since HHC released its budget, the City determined that HHC would assume the correctional facilities health services contracts; though this will be supported by money transferred from the DOHMH budget, this is a large undertaking that could further strain HHC’s resources NYCHA also has substantial financial challenges; Its operating gap for the coming fiscal year is $150 million for its public housing program, and is projected to grow to $194 million in 2019 It also has $17 billion in unmet capital needs The mayor has been very supportive of NYCHA, relieving it of its annual $70 million payment for police services and its $30 million PILOT The City has agreed to additional support in NYCHA’s ten-year strategic plan, Next Generation NYCHA. CBC is supportive of many of the plan’s proposals, several of which overlap with the recommendations we included in our report, such as increasing rent collections, increasing parking permit fees, and increasing commercial activity. Still, risks remain and we will be monitoring how this plan is implemented.