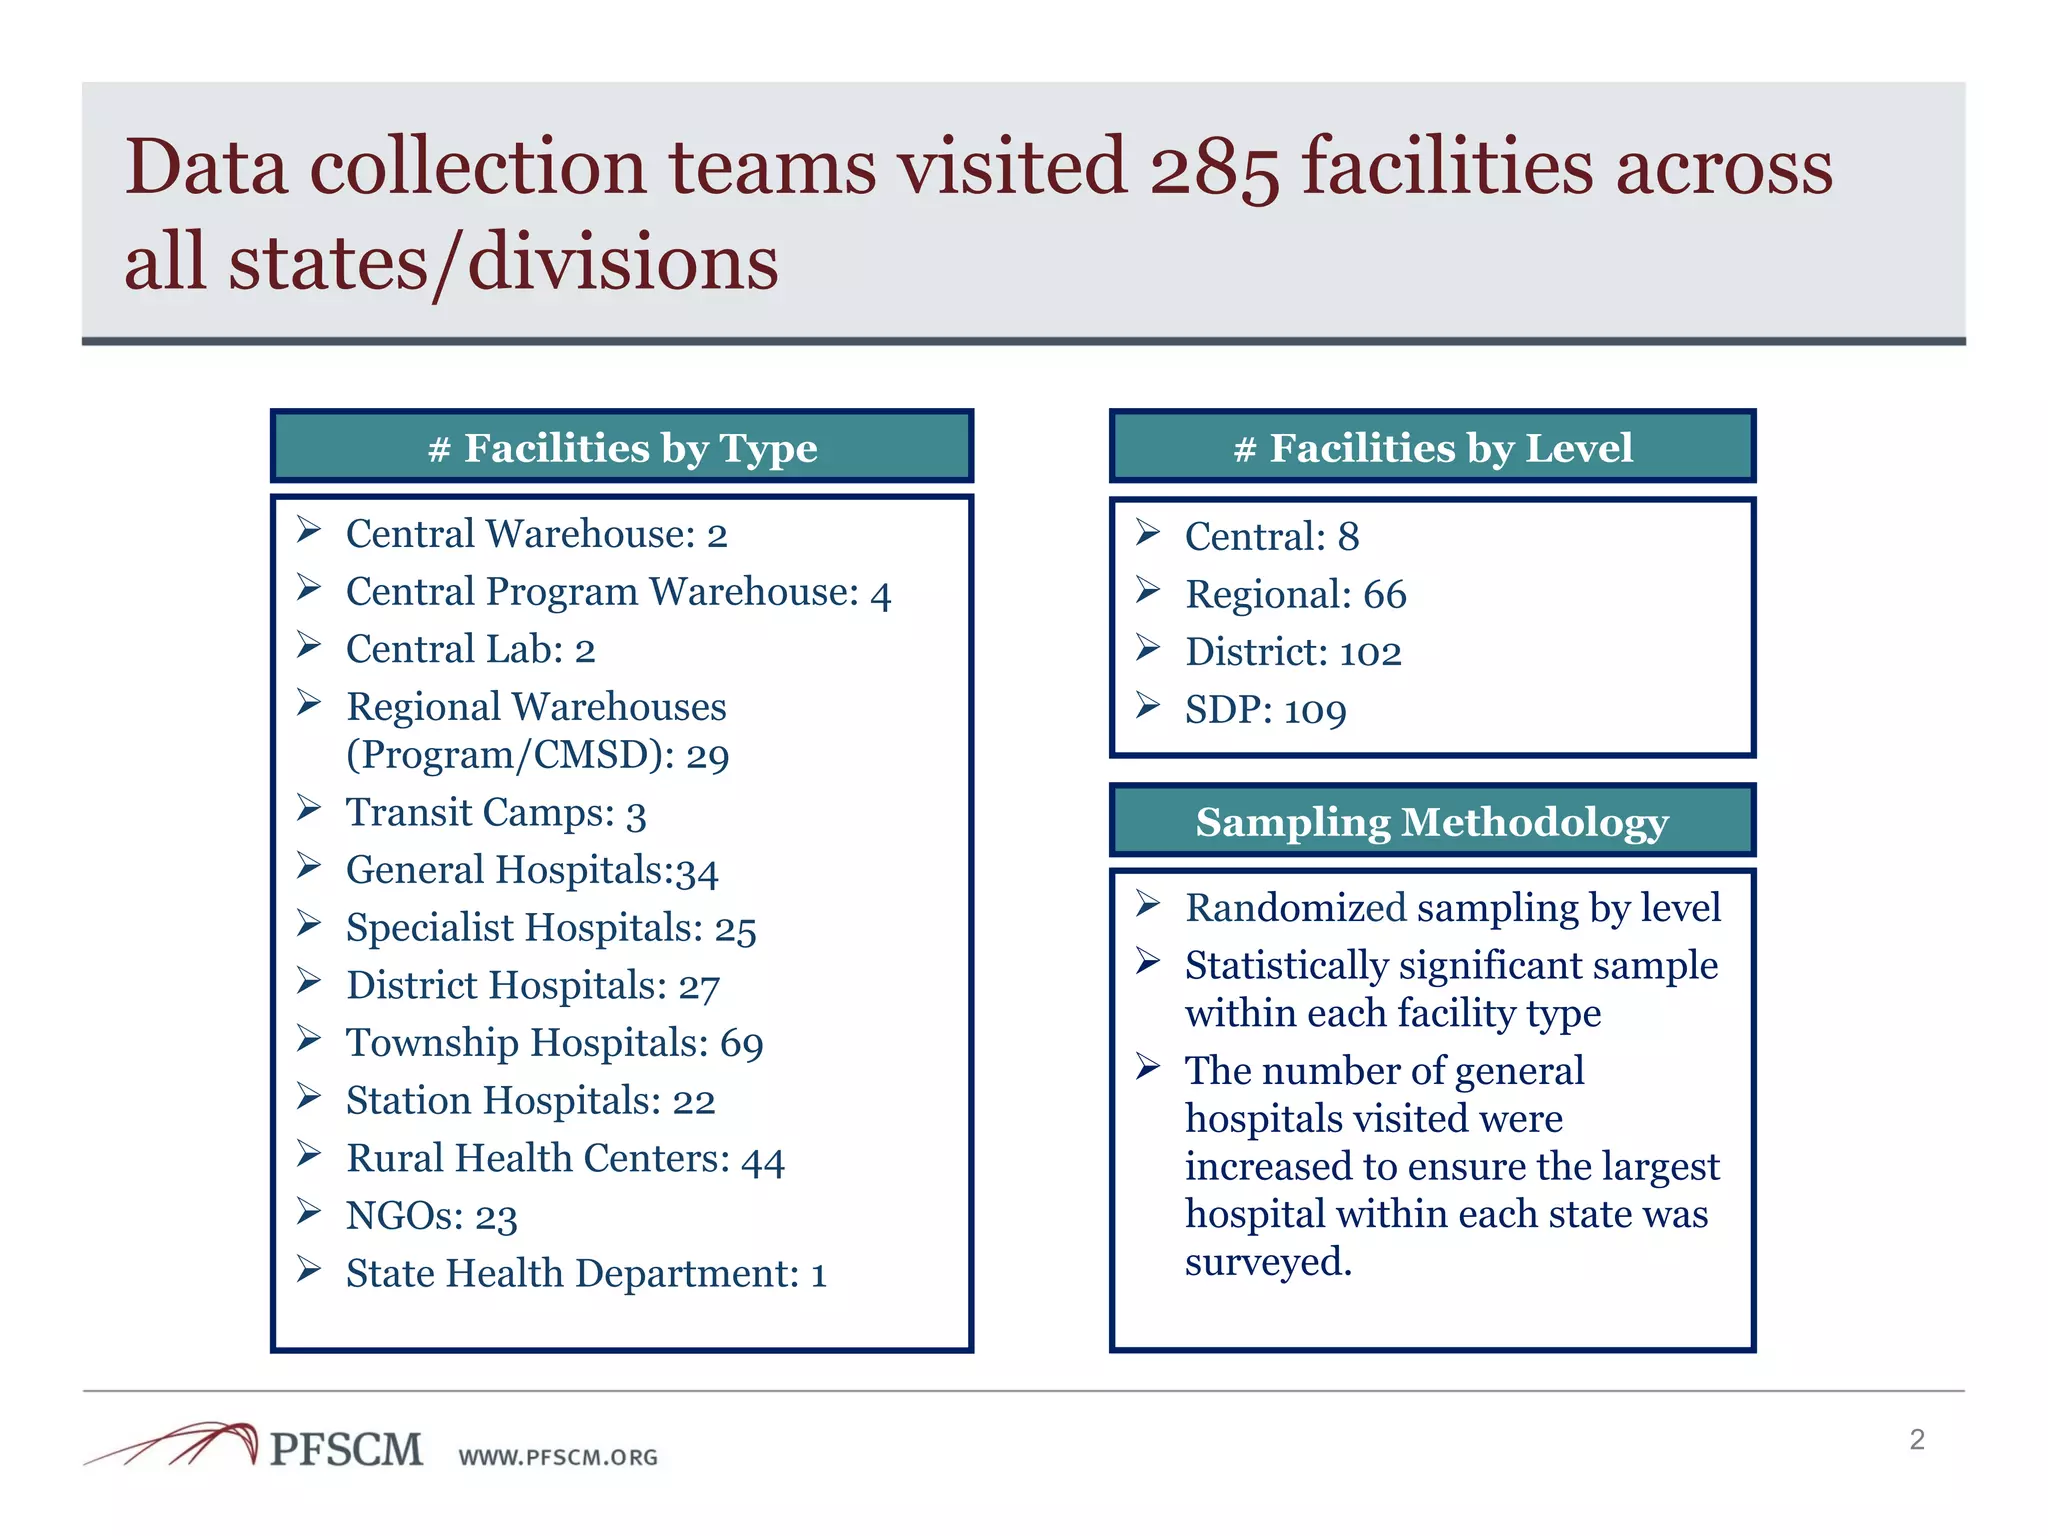
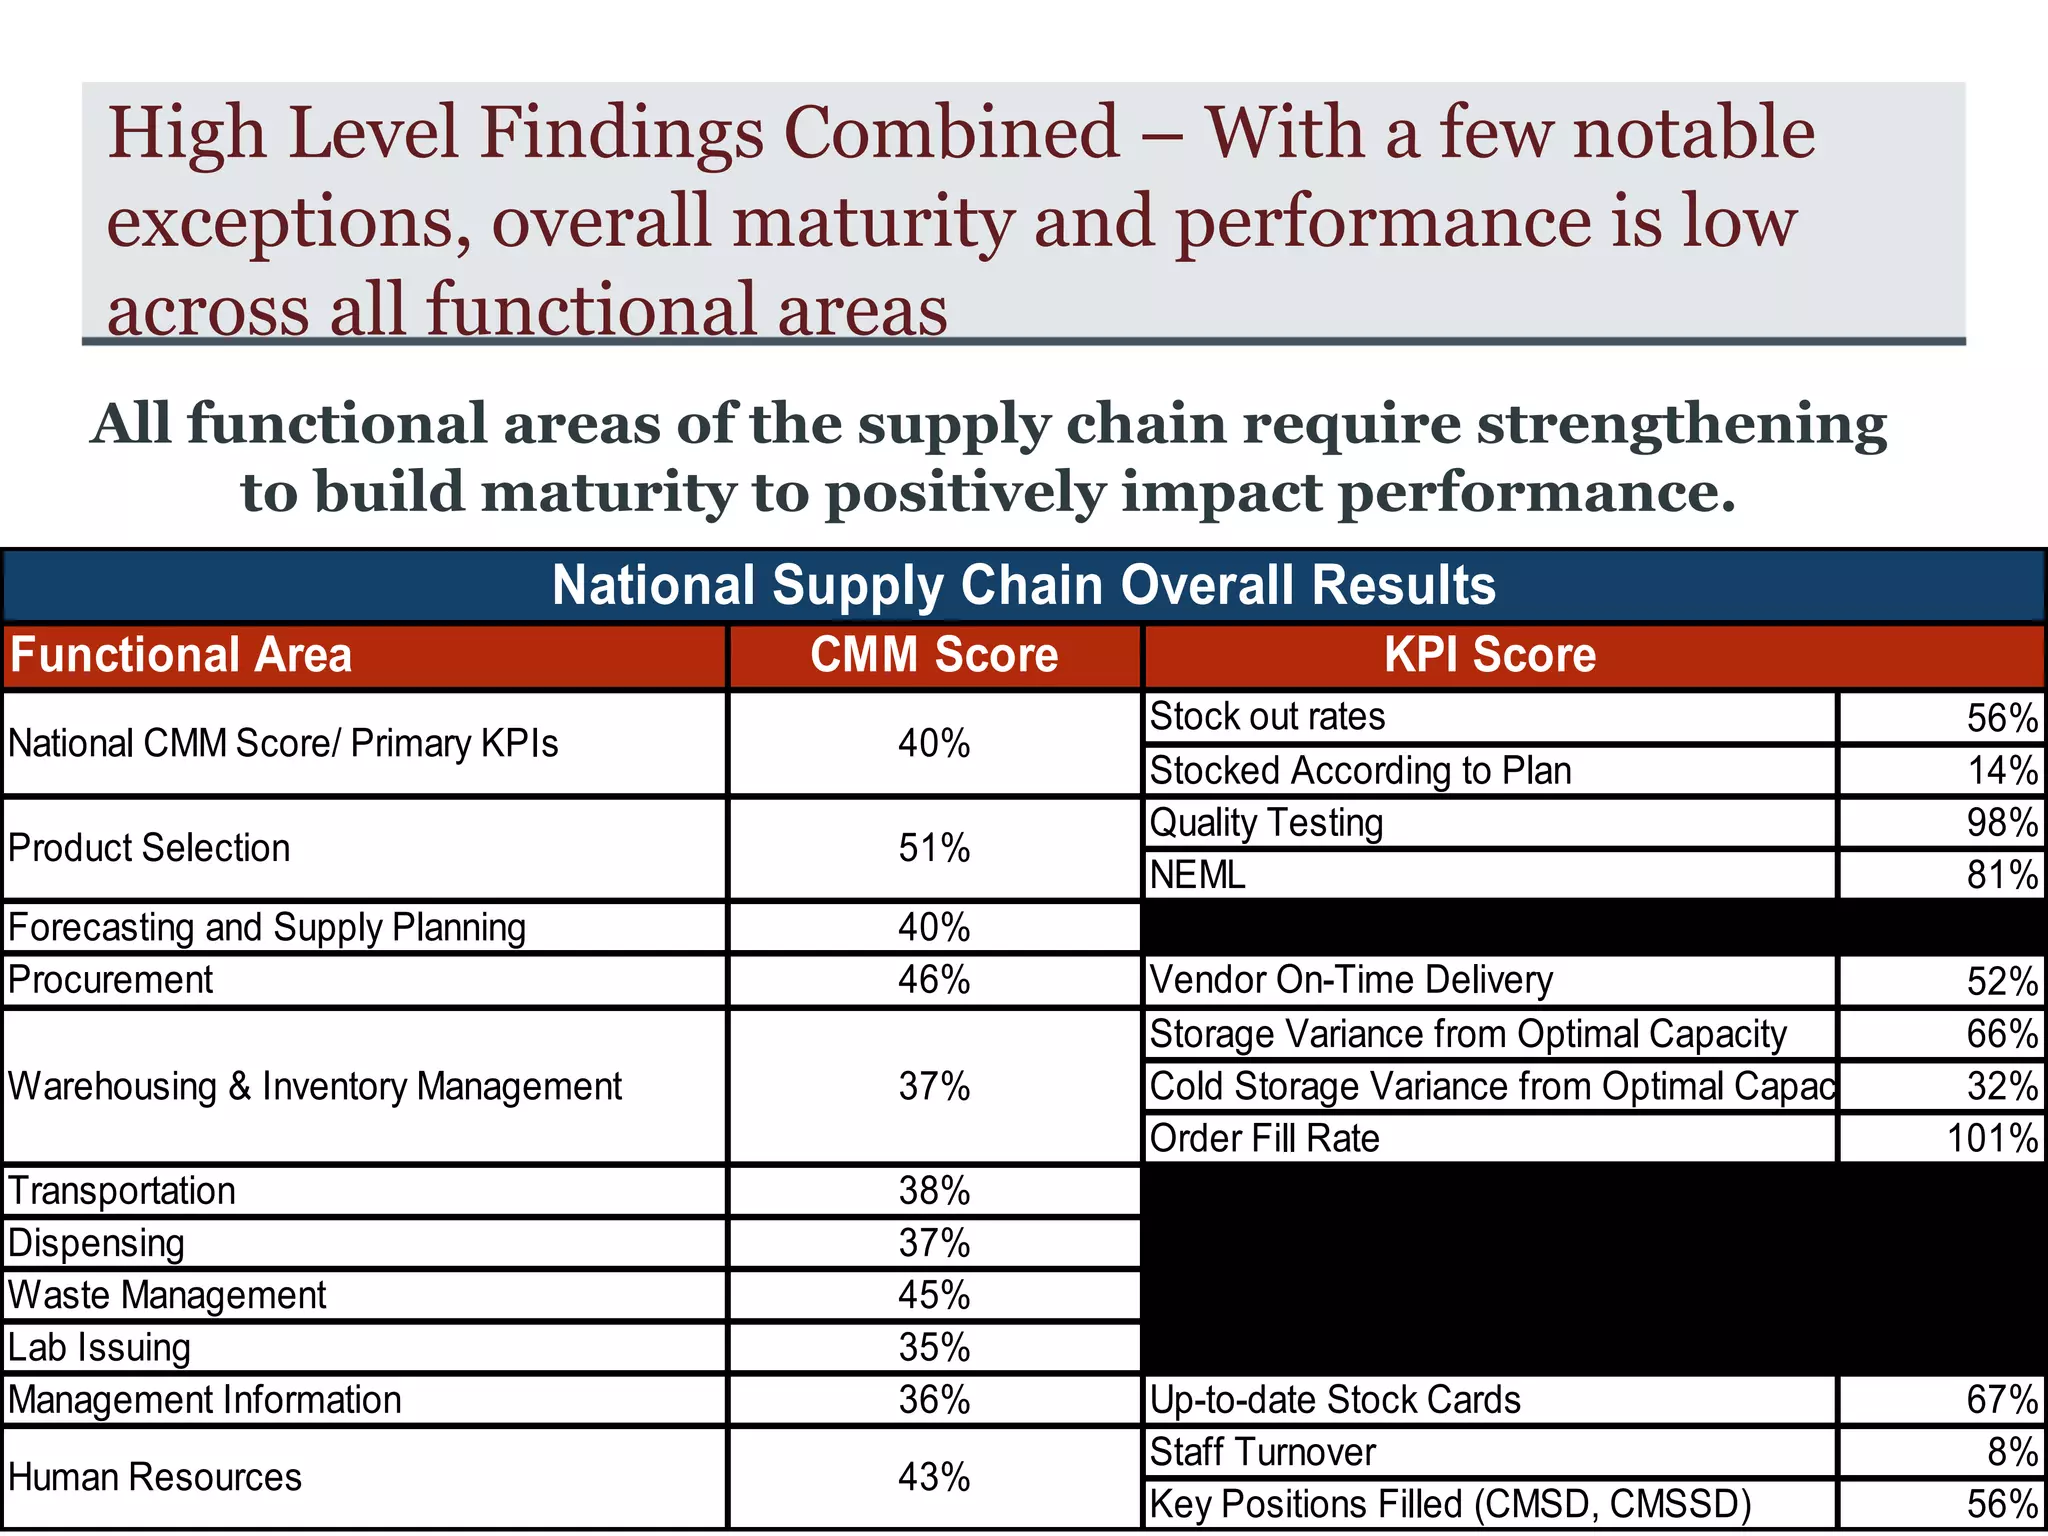
Background - Creating a shared, evidence based,
understanding of where to focus system strengthening efforts
 National Supply Chain Management Strategic Planning Workshop in
November agreed to a shared vision of an integrated national supply
chain lead by the MoH.
 A key recommendation, endorsed by MOH, was to conduct a national
supply chain baseline to provide a evidence-based platform that will
guide future system strengthening efforts and inform areas of
collaboration
 USAID/PEPFAR and 3MDG co-funded the exercise which was
conducted jointly by the MOH and PFSCM.
 Data was collected through March-April 2014, validated and analyzed
in May-June 2014 and the report was submitted to the MOH for
approval.
Data collection teams visited 285 facilities across
all states/divisions
2
 Central: 8
 Regional: 66
 District: 102
 SDP: 109
# Facilities by Level
 Randomized sampling by level
 Statistically significant sample
within each facility type
 The number of general
hospitals visited were
increased to ensure the largest
hospital within each state was
surveyed.
Sampling Methodology
 Central Warehouse: 2
 Central Program Warehouse: 4
 Central Lab: 2
 Regional Warehouses
(Program/CMSD): 29
 Transit Camps: 3
 General Hospitals:34
 Specialist Hospitals: 25
 District Hospitals: 27
 Township Hospitals: 69
 Station Hospitals: 22
 Rural Health Centers: 44
 NGOs: 23
 State Health Department: 1
# Facilities by Type
High Level Findings Combined – With a few notable
exceptions, overall maturity and performance is low
across all functional areas
All functional areas of the supply chain require strengthening
to build maturity to positively impact performance.
56%
14%
98%
81%
52%
66%
32%
101%
67%
8%
56%
35%Lab Issuing
36%
45%
Up-to-date Stock Cards
Staff Turnover
46%
38%
37%
Order Fill Rate
37%
Storage Variance from Optimal Capacity
Cold Storage Variance from Optimal Capacity
Functional Area
40%
40%
National Supply Chain Overall Results
Stock out rates
Stocked According to Plan
NEML
CMM Score
National CMM Score/ Primary KPIs
Forecasting and Supply Planning
KPI Score
Management Information
Warehousing & Inventory Management
51%
Quality Testing
Procurement
Product Selection
Dispensing
Waste Management
Transportation
Human Resources 43%
Key Positions Filled (CMSD, CMSSD)
Vendor On-Time Delivery

Nscbl slide

  • 1.
    Background - Creatinga shared, evidence based, understanding of where to focus system strengthening efforts  National Supply Chain Management Strategic Planning Workshop in November agreed to a shared vision of an integrated national supply chain lead by the MoH.  A key recommendation, endorsed by MOH, was to conduct a national supply chain baseline to provide a evidence-based platform that will guide future system strengthening efforts and inform areas of collaboration  USAID/PEPFAR and 3MDG co-funded the exercise which was conducted jointly by the MOH and PFSCM.  Data was collected through March-April 2014, validated and analyzed in May-June 2014 and the report was submitted to the MOH for approval.
  • 2.
    Data collection teamsvisited 285 facilities across all states/divisions 2  Central: 8  Regional: 66  District: 102  SDP: 109 # Facilities by Level  Randomized sampling by level  Statistically significant sample within each facility type  The number of general hospitals visited were increased to ensure the largest hospital within each state was surveyed. Sampling Methodology  Central Warehouse: 2  Central Program Warehouse: 4  Central Lab: 2  Regional Warehouses (Program/CMSD): 29  Transit Camps: 3  General Hospitals:34  Specialist Hospitals: 25  District Hospitals: 27  Township Hospitals: 69  Station Hospitals: 22  Rural Health Centers: 44  NGOs: 23  State Health Department: 1 # Facilities by Type
  • 3.
    High Level FindingsCombined – With a few notable exceptions, overall maturity and performance is low across all functional areas All functional areas of the supply chain require strengthening to build maturity to positively impact performance. 56% 14% 98% 81% 52% 66% 32% 101% 67% 8% 56% 35%Lab Issuing 36% 45% Up-to-date Stock Cards Staff Turnover 46% 38% 37% Order Fill Rate 37% Storage Variance from Optimal Capacity Cold Storage Variance from Optimal Capacity Functional Area 40% 40% National Supply Chain Overall Results Stock out rates Stocked According to Plan NEML CMM Score National CMM Score/ Primary KPIs Forecasting and Supply Planning KPI Score Management Information Warehousing & Inventory Management 51% Quality Testing Procurement Product Selection Dispensing Waste Management Transportation Human Resources 43% Key Positions Filled (CMSD, CMSSD) Vendor On-Time Delivery

Editor's Notes

  • #4 CMM is based on a 1-5 scale, so a 40% overarching scale is equivalent to a 2, meaning….. 60% maturity is considered functional and goal for developing context