Npl market data highlights
•
1 like•594 views

This document provides data on the non-performing loan (NPL) and distressed real estate markets in Europe. It shows that in 2012, Spain, Germany, Italy, the UK, and Ireland made up the majority of distressed real estate sales across Europe. For the first half of 2014, the largest closed real estate transactions by geography were in the UK, Spain, Ireland, Germany, and France. The document also provides specific NPL and distressed loan data for Italy, including breakdowns by bank size and projections of NPL volumes through 2016.

Recommended
Recommended
More Related Content
Similar to Npl market data highlights
Similar to Npl market data highlights (20)
Recently uploaded
Recently uploaded (20)
Npl market data highlights
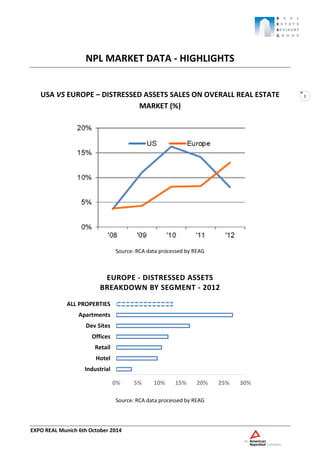
- 1. EXPO REAL Munich 6th October 2014 1 NPL MARKET DATA - HIGHLIGHTS USA VS EUROPE – DISTRESSED ASSETS SALES ON OVERALL REAL ESTATE MARKET (%) Source: RCA data processed by REAG Source: RCA data processed by REAG 0% 5% 10% 15% 20% 25% 30% Industrial Hotel Retail Offices Dev Sites Apartments ALL PROPERTIES EUROPE - DISTRESSED ASSETS BREAKDOWN BY SEGMENT - 2012
- 2. EXPO REAL Munich 6th October 2014 2 Source: various sources data processed by REAG Source: various sources data processed by REAG Spain 16% Germany 13% Italy 13% UK 11% Ireland 11% Others 36% EUROPE - NPL STOCK BREAKDOWN 2013 TOTAL EUROPE: 1,220 bn € Spain 192 Italy 38 Germany 57 Netherland 14 UK 154 Ireland 100 Other Europe 29 EUROPE - GROSS NON-CORE REAL ESTATE EXPOSURE (€BN) - H1 2014 TOTAL EUROPE: 584 bn €
- 3. EXPO REAL Munich 6th October 2014 3 Source: various sources data processed by REAG Source: various sources data processed by REAG CRE loans 69% REOs 21% Resi Loans 3% Corporate Loans 5% CMBS 2% EUROPE - CLOSED TRANSACTIONS H1 2014 40.9 bn € of closed transactions 40 85 428 560 600 1,297 1,640 4,479 6,040 9,865 15,909 0 5000 10000 15000 20000 Italy Denmark Austria Netherlands Romania Pan-European France Germany Spain Ireland UK EUROPE - CLOSED SALES BY GEOGRAPHY H1 2014 (€MLN)
- 4. EXPO REAL Munich 6th October 2014 4 Source: various sources data processed by REAG Source: Bank of Italy data processed by REAG 150 250 500 6,433 7,238 7,630 16,338 0 4000 8000 12000 16000 20000 PLANNED CRE LOAN & REO SALES H2 2014 (MLN€) 42 59 78 107 125 156 165 31 49 53 58 76 94 101 9 8 13 15 15 15 16 16 12 13 21 18 16 0 50 100 150 200 250 300 350 2008 2009 2010 2011 2012 2013 Q1 2014 GROSS ITALIAN IMPAIRED LOANS (BLN €) Bad debts/NPL Substandard loans/Watchlist Restructured loans Past due by more than 90 days 82 132 158 194 237 283 298
- 5. EXPO REAL Munich 6th October 2014 5 Source: various sources data processed by REAG Source: Bank of Italy data and Prometeia estimates processed by REAG 5 largest groups 66% Large banks 19% Small banks 6% Minor banks 9% ITALY - BREAKDOWN IMPAIRED LOANS (DEC 2013) 78,636 107,197 124,973 155,885 172,346 199,000 219,000 235,000 36,687 51,721 64,774 79,884 78,227 0 40000 80000 120000 160000 200000 240000 280000 2010 2011 2012 2013 July 2014 2014E 2015E 2016E ITALY - NPLs (MLN €) Gross Net
- 6. EXPO REAL Munich 6th October 2014 6 Source: Bank of Italy data processed by REAG Source: Bank of Italy and ABI data processed by REAG 53% 52% 48% 49% 55% 44% 46% 48% 50% 52% 54% 56% 2010 2011 2012 2013 July 2014 ITALY - NPLs PROVISION COVERAGE RATIO (%) 1,4% 2,3% 2,8% 3,5% 3,8% 5,0% 4,8% 2008 2009 2010 2011 2012 2013 Q1 2014 ITALY - NET NPL/LIABILITIES