Downloaded 23 times

![6 novática Special English Edition - 2013/2014 Annual Selection of Articles
monograph Process Mining
monograph
1. Introduction
The archive of the United States Naval
Observatory stored all the naval logbooks of
the US Navy in the 19th century. These
logbooks contained daily entries relating to
position, winds, currents and other details of
thousands of sea voyages. These logbooks
lay ignored and it had even been suggested
that they be thrown away until Mathew
Fontaine Maury came along.
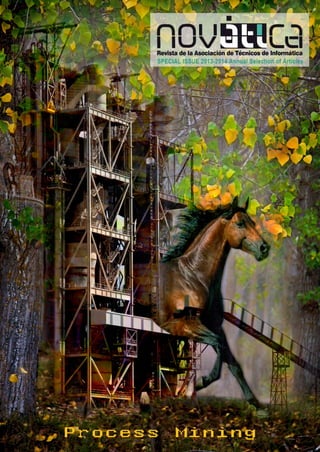
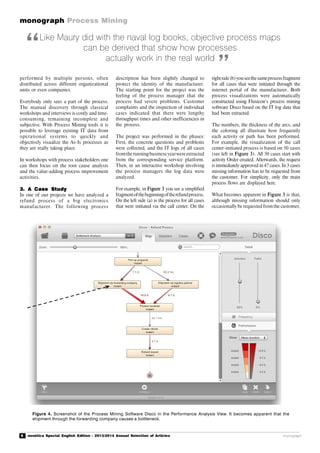
Maury (see Figure 1) was a sailor in the US
Navy and from 1842 was the director of the
United States Naval Observatory. He
evaluated the data systematically and created
illustratedhandbooks whichvisually mapped
the winds and currents of the oceans. These
were able to serve ships’ captains as a
decision-making aidwhen theywereplanning
their route.
In 1848 Captain Jackson of the W. H. D. C.
Wright was one of the first users of Maury’s
handbooks on a trip from Baltimore to Rio
de Janeiro and returned more than a month
earlier than planned. After only seven years
from the production of the first edition
Maury’s Sailing Directions had saved the
sailing industry worldwide about 10 million
dollars per year [1].
The IT systems in businesses also conceal
invaluable data, which often remains
completely unused. Business processes
create the modernday equivalent of "logbook
entries", which detail exactly which activities
were carried out when and by whom, (see
Figure 2). If, for example, a purchasing
process is started in an SAP system, every
step in the process is indicated in the
corresponding SAP tables. Similarly, CRM
systems, ticketing systems and even legacy
systems record historical data about the
processes.
These digital traces are the byproduct of the
increasing automation and IT support of
business processes [2].
2. From Random Samples to
Comprehensive Analysis
BeforeMaury’smanualon currentsand tides,
sailors were restricted to planning a route
based solely on their own experience. This is
also the case for most business processes:
Nobody really has a clear overview of how
the processes are actually executed. Instead,
Figure 1. Matthew Fontaine Maury (Source: Wikipedia).
Process Mining: The Objectification
of Gut Instinct - Making Business
Processes More Transparent
Through Data Analysis
Anne Rozinat1
, Wil van der
Aalst2
1
Co-founder of Fluxicon, The Netherlands;
2
Technical University of Eindhoven, The
Netherlands
<anne @fl uxic on. com>,
<w. m.p.v. d.aalst@tue. nl>
Abstract: Big Data existed in the 19th Century. At least that might be the conclusion you would draw by
reading the story of Matthew Maury. We draw a parallel with the first systematic evaluations of
seafaring logbooks and we show how you can quickly and objectively map processes based on the
evaluation of log files in IT systems.
Keywords: Big Data, Case Study, Log Data, Process Mining, Process Models, Process Visualization,
Systematic Analysis.
Authors
Anne Rozinat has more than eight years of experience with process mining technology and obtained
her PhD cum laude in the process mining group of Prof. Wil van der Aalst at the Eindhoven University of
Technology in the Netherlands. Currently, she is a co-founder of Fluxicon and blogs at <http://
www.fluxicon.com/blog/>.
Wil van der Aalst is a professor at the Technical University in Eindhoven and with an H-index of over 90
points the most cited computer scientist in Europe. Well known through his work on the Workflow
Patterns, he is the widely recognized "godfather" of process mining. His personal website is <http://
www.vdaalst.com>.
there are anecdotes, good feeling and many
subjective (potentially contradicting)
opinions which have to be reconciled.
The systematic analysis of digital log traces
throughso-calledProcessMiningtechniques
[3] offers enormous potential for all](https://image.slidesharecdn.com/nvs2014-digital-141223095805-conversion-gate02/85/Novatica-223-Process-Mining-English-Edition-9-320.jpg)
![9
Process Mining monograph
monograph novática Special English Edition - 2013/2014 Annual Selection of Articles
References
this happens a lot for cases that are started
via the internet portal: For 97% of all cases
(77outof83 completed cases)thisadditional
process step was performed. For 12 of the 83
analyzed cases (ca. 14%) this happened even
multiple times (in total 90 times for 83
cases).
This process step costs a lot of time because
it requires a call or an email from the service
provider. In addition, through the external
communication that is required, the process
is delayed for the customer, who in a refund
process has already had a bad experience.
Therefore, the problem needs to be solved.
An improvement of the internet portal (with
respect to the mandatory information in the
form that submits the refund request) could
ensure that information is complete when
the process is started.
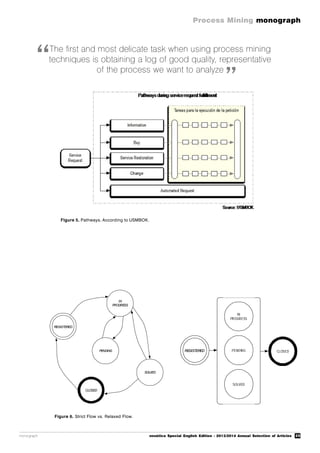
Another analysis result was a detected
bottleneck in connection with the pick-ups
that were performed through the forwarding
company. The process fragment in Figure 4
shows the average waiting times between the
process steps based on the timestamps in
the historical data.
Also such waiting times analyses are
automatically created by the process mining
software. You can see that before and after
the process step Shipment via forwarding
company a lot of time passes. For example,
it takes on average ca. 16 days between
Shipment via forwarding company and
Product received. The company discovered
that the root cause for the long waiting times
was that products were collected in a palette
and the palette was shipped only when it was
full, which led to delays particularly for
those products that were placed in an almost
empty palette. Also the actual refund process
at the electronics manufacturer was taking
too long (on average ca. 5 days). For the
customer the process is only completed when
she has her money back.
As a last result of the process mining analysis,
deviations from the required process were
detected. It is possible to compare the log data
(and therewith the actual process) objectively
andcompletely againstrequired businessrules,
and to isolate those cases that show deviations.
Specifically, we found that (1) in one case the
customer received the refund twice, (2) in two
casesthemoneywasrefundedwithoutensuring
that the defect product had been received by
the manufacturer, (3) in a few cases an
important and mandatory approval step in the
process had been skipped.
4. State of the Art
Process mining, which is still a young and
relatively unknown discipline, is being made
available by the first professional software
tools on the market and supported by
[1]TimZimmermann.TheRace:ExtremeSailingand
Its Ultimate Event: Nonstop, Round-the-World, No
Holds Barred. Mariner Books, 2004. ISBN-10:
0618382704.
[2]W.BrianArthur.TheSecondEconomy.McKinsey
Quarterly,2011.
[3] Wil M.P. van der Aalst. Process Mining:
Discovery,ConformanceandEnhancementofBusi-
ness Processes. Springer-Verlag, 2011. ISBN-10:
3642193447.
[4]AlbertoManuel.ProcessMining-AnaAeroportos
de Portugal, 2012. BPTrends, <www.bptrends.
com>.
[5] IEEE Task Force on Process Mining. <http://
www.win.tue.nl/ieeetfpm/>.
[6] IEEE Task Force on Process Mining. Process
Mining Manifesto.Business Process Management
Workshops 2011, Lecture Notes in Business
Information Processing, Vol. 99, Springer-Verlag,
2011.
[7]AnneRozinat.HowtoReduceWasteWithProcess
Mining,2011.BPTrends,<www.bptrends.com>.
[8] MarkA. Thornton. General Circulation and the
Southern Hemisphere, 2005. <http://www.
lakeeriewx.com/Meteo241/ResearchTopicTwo/
ProjectTwo.html>.
published case studies [4 |. The IEEE Task
Force on Process Mining [5] was founded in
2009 to increase the visibility of process
mining. In autumn 2011, it published a
Process Mining Manifesto [6], which is
available in 13 languages.
Companies already generate vast quantities
of data as a byproduct of their IT-enabled
business processes. This data can be directly
analyzedbyprocessminingtools.LikeMaury
did with the naval log books, objective
process maps can be derived that show how
processes actually work in the real world [7].
Developments in the field of Big Data are
helping to store and access this data to
analyze it effectively.
Matthew Fontaine Maury’s wind and current
books were so useful that by the mid-1850s,
their use was even made compulsory by
insurers [8] in order to prevent marine
accidents and to guarantee plain sailing.
Likewise, in Business process analysis and
optimization, there will come a point when
we can not imagine a time when we were ever
without it and left to rely on our gut feeling.](https://image.slidesharecdn.com/nvs2014-digital-141223095805-conversion-gate02/85/Novatica-223-Process-Mining-English-Edition-12-320.jpg)
![10 novática Special English Edition - 2013/2014 Annual Selection of Articles
monograph Process Mining
monograph
1. Process Mining Spectrum
Process mining aims to discover, monitor
and improve real processes by extracting
knowledge from event logs readily available
in today’s information systems [1][2].
Although event data are omnipresent,
organizations lack a good understanding of
their actual processes. Management
decisions tend to be based on PowerPoint
diagrams, local politics, or management
dashboards rather than an careful analysis of
event data. The knowledge hidden in event
logs cannot be turned into actionable
information. Advances in data mining made
it possible to find valuable patterns in large
datasets and to support complex decisions
based on such data. However, classical data
mining problems such as classification,
clustering, regression, association rule
learning, and sequence/episode mining are
not process-centric.
Therefore, Business Process Management
(BPM) approaches tend to resort to hand-
made models. Process mining research
aims to bridge the gap between data mining
and BPM. Metaphorically, process mining
can be seen as taking X-rays to diagnose/
predict problems and recommend treat-
ment.
An important driver for process mining is the
incredible growth of event data [4][6]. Event
data is everywhere – in every sector, in every
economy, in every organization, and in every
home one can find systems that log events.
For less than $600, one can buy a disk drive
with the capacity to store all of the world’s
music [6]. A recent study published in
Science, shows that storage space grew from
2.6 optimally compressed exabytes (2.6 x 10
18
bytes) in 1986 to 295 compressed exabytes
in 2007. In 2007, 94 percent of all
information storage capacity on Earth was
digital. The other 6 percent resided in books,
magazines and other non-digital formats.
This is in stark contrast with 1986 when only
0.8percentofallinformationstorage capacity
was digital. These numbers illustrate the
exponential growth of data.
Process Mining:
X-Ray Your Business Processes
Wil van der Aalst
Technical University of Eindhoven, The
Netherlands
<w. m.p.v. d.aalst@tue. nl>
Abstract: Recent breakthroughs in process mining research make it possible to discover, analyze, and
improve business processes based on event data. Activities executed by people, machines, and soft-
ware leave trails in so-called event logs. Events such as entering a customer order into SAP, checking
in for a flight, changing the dosage for a patient, and rejecting a building permit have in common that
they are all recorded by information systems. Over the last decade there has been a spectacular
growth of data. Moreover, the digital universe and the physical universe are becoming more and more
aligned. Therefore, business processes should be managed, supported, and improved based on event
data rather than subjective opinions or obsolete experiences. The application of process mining in
hundreds of organizationshas shownthat bothmanagers and users tend tooverestimate their knowledge
of the processes they are involved in. Hence, process mining results can be viewed as X-rays showing
what is really going on inside processes. Such X-rays can be used to diagnose problems and suggest
proper treatment. The practical relevance of process mining and the interesting scientific challenges
make process mining one of the "hot" topics in Business Process Management (BPM). This article
provides an introduction to process mining by explaining the core concepts and discussing various
applications of this emerging technology.
Keywords: Business Intelligence, Business Process Management, Data Mining, Management,
Measurement, Performance, Process Mining,
Author
Wil van der Aalst is a professor at the Technical University in Eindhoven and with an H-index of over 90
points the most cited computer scientist in Europe. Well known through his work on the Workflow
Patterns, he is the widely recognized "godfather" of process mining. His personal website is <http://
www.vdaalst.com>.
© 2013 ACM, Inc. Van der Aalst, W.M.P. 2012.
Process Mining. Communications of the ACM
CACM Volume55Issue8 (August2012)Pages76-
83, <http://doi.acm.org/10.1145/2240236.2240
257>. Included here by permission.
The further adoption of technologies such
as RFID (Radio Frequency Identification),
location-based services, cloud computing,
and sensor networks, will further accelerate
the growth of event data. However,
organizationshave problemseffectivelyusing
such large amounts of event data. In fact,
most organizations still diagnose problems
based on fiction (Powerpoint slides, Visio
diagrams, etc.) rather than facts (event data).
This is illustrated by the poor quality of
process models in practice, e.g., more than
20% of the 604 process diagrams in SAP’s
reference model have obvious errors and
their relation tothe actual business processes
supported by SAP is unclear [7]. Therefore,
it is vital to turn the massive amounts of
event data into relevant knowledge and
reliableinsights.Thisis whereprocess mining
can help.
The growing maturity of process mining is
illustrated by the Process Mining Manifesto
[5] recently released by the IEEE Task For-
ce on Process Mining. This manifesto is
supportedby53organizationsand77process
mining experts contributed to it. The active
contributions from end-users, tool vendors,
consultants, analysts, and researchers
illustrate the significance of process mining
as a bridge between data mining and busi-
ness process modeling.
Starting point for process mining is an event
log. Each event in such a log refers to an
activity (i.e., a well-defined step in some
process) and is related to a particular case
(i.e., a process instance). The events
belonging to a case are ordered and can be
seen as one "run" of the process. Event logs
may store additional information about
events. In fact, whenever possible, process
mining techniquesuse extrainformationsuch
as the resource (i.e., person or device)
executing or initiating the activity, the
timestamp of the event, or data elements
recorded with the event (e.g., the size of an
order).
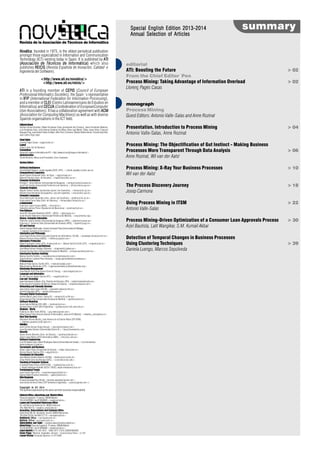
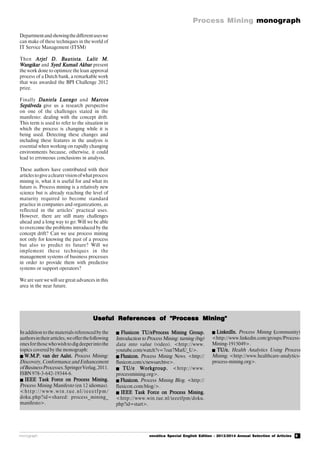
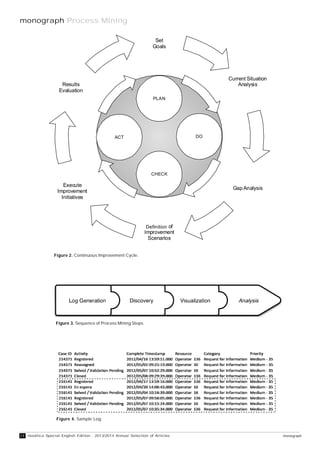
Event logs can be used to conduct three
types of process mining as shown in Figure
1 [1]. The first type of process mining is
discovery. A discovery technique takes an
event log and produces a model without
using any a-priori information. Process
discovery is the most prominent process](https://image.slidesharecdn.com/nvs2014-digital-141223095805-conversion-gate02/85/Novatica-223-Process-Mining-English-Edition-13-320.jpg)
![11
Process Mining monograph
monograph novática Special English Edition - 2013/2014 Annual Selection of Articles
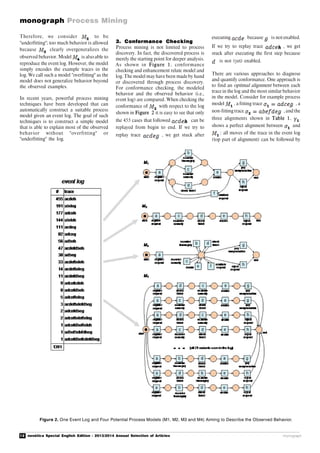
Figure 1. The Three Basic Types of Process Mining Explained in Terms of Input and Output.
Conformance checking can be used to check if reality,
as recorded in the log, conforms to the model and vice versa
mining technique. For many organizations it
is surprising to see that existing techniques
are indeed able to discover real processes
merely based on example behaviors recorded
in event logs.
The second type of process mining is
conformance. Here, an existing process
model is compared with an event log of the
same process. Conformance checking can
be used to check if reality, as recorded in the
log, conforms to the model and vice versa.
The third type of process mining is
enhancement. Here, the idea is to extend or
improve an existing process model using
information about the actual process
recorded in some event log. Whereas
conformance checking measures the
alignment between model and reality, this
third type ofprocessmining aims at changing
or extending the a-priori model. For instance,
by using timestamps in the event log one can
extend the model to show bottlenecks, service
levels, throughput times, and frequencies.
2. Process Discovery
As shown in Figure 1, the goal of process
discovery is to learn a model based on some
event log. Events can have all kinds of
attributes (timestamps, transactional
information, resource usage, etc.). These
can all be used for process discovery.
However, for simplicity, we often represent
events by activity names only. This way, a
case (i.e., process instance) can be
represented by a trace describing a sequence
of activities.
Consider for example the event log shown in
Figure 1 (example is taken from [1]). This
event log contains 1,391 cases, i.e., instances
of some reimbursement process. There are
455 process instances following trace acdeh.
Activities are represented by a single
character: = register request, b = examine
thoroughly, c = examine casually, d = check
ticket, e = decide, f = reinitiate request, g =
pay compensation, and h = reject request.
Hence, trace acdeh models a reimbursement
request that was rejected after a registration,
examination, check, and decision step. 455
cases followed this path consisting of five
steps, i.e., the first line in the table
corresponds to 455 x 5 = 2,275 events. The
whole log consists of 7,539 events.
Process discovery techniques produce
process models based on event logs such as
the one shown in Figure 2. For example, the
classical -algorithm produces model M1
forthislog.Thisprocessmodelis represented
as a Petri net. A Petri net consists of places
and transitions. The state of a Petri net, also
referred to as marking, is defined by the
distribution of tokens over places.
A transition is enabled if each of its input
places contains a token. For example, is
enabledintheinitial markingof ,because
the only input place of contains a token
(black dot). Transition in is only
enabled if both input places contain a token.
An enabled transition may fire thereby
consuming a token from each of its input
places and producing a token for each of its
outputplaces. Firing inthe initial marking
corresponds to removing one token from
start and producing two tokens (one for
each output place). After firing , three
transitions are enabled: , , and .
Firing will disable because the token
is removed from the shared input place (and
vice versa). Transition is concurrent with
and , i.e., it can fire without disabling
another transition. Transition becomes
enabled after and or have occurred.
After executing three transitions become
enabled: , , and . These transitions
are competing for the same token thus
modeling a choice. When or is fired,
the process ends with a token in place end.
If is fired, the process returns to the state
just after executing .
Note that transition is concurrent with
and . Process mining techniques need
to be able to discover such more advanced
process patterns and should not be restricted
to simple sequential processes.
It is easy to check that all traces in the event
log can be reproduced by . This does not
hold for the second process model in Figure
2. is only able to reproduce the most
frequent trace . The model does
not fit the log well because observed traces
such as are not possible according
to . The third model is able to reproduce
the entire event log, but also allows for
traces such as and .
“ ”](https://image.slidesharecdn.com/nvs2014-digital-141223095805-conversion-gate02/85/Novatica-223-Process-Mining-English-Edition-14-320.jpg)
![13
Process Mining monograph
monograph novática Special English Edition - 2013/2014 Annual Selection of Articles
moves of the model (bottom part of
alignment). shows an optimal alignment
for trace in the event log and model .
The first two moves of the trace in the event
log can be followed by the model. However,
is not enabled after executing just and
. In the third position of alignment , we
see a move of the model that is not
synchronized with a move in the event log. A
move in just the model is denoted as
). In the next three moves model and
log agree. In the seventh position of
alignment there is just a move of the
model and not a move in the log: ).
shows another optimal alignment for
trace . Here there are two situations
where log and model do not move together:
) and ). Alignments and
are both optimal if the penalties for
"move in log" and "move in model" are the
same. In both alignments there are two
steps and there are no alignments with less
than two steps.
Conformance can beviewed from twoangles:
(a) the model does not capture the real
behavior ("the model is wrong") and (b)
reality deviates from the desired model "the
event log is wrong"). The first viewpoint is
taken when the model is supposed to be
descriptive, i.e., capture or predict reality.
The second viewpoint is taken when the
model is normative, i.e., used to influence or
control reality.
There are various types of conformance and
creating analignment between log and model
is just the starting point for conformance
checking [1]. For example, there are various
fitness (the ability to replay) metrics. A
model has fitness 1 if all traces can be
replayed from begin to end. A model has
fitness 0 if model and event log "disagree" on
all events. Process models , and
have a fitness of 1 (i.e., perfect fitness)
with respect to the event log shown in Figu-
re 2 Model has a fitness 0.8 for the
event log consisting of 1,391 cases.
Intuitively, this means that 80% of the events
in the log can be explained by the model.
Fitness is just one of several conformance
metrics.
Experiences with conformance checking in
dozens of organizations show that real-life
processes often deviate from the simplified
Visio or PowerPoint representations used by
process analysts.
4. Model Enhancement
It is also possible to extend or improve an
existing process model using the alignment
between event log and model. A non-fitting
process model can be corrected using the
diagnostics provided by the alignment. If the
alignment contains many ) moves,
then it may make sense to allow for the
skipping of activity in the model.
Moreover, event logs may contain
information about resources, timestamps,
andcase data.Forexample,an event referring
to activity "register request" and case
"992564" may also have attributes describing
the person that registered the request (e.g.,
"John"), the time of the event (e.g., "30-11-
2011:14.55"), the age of the customer (e.g.,
"45"), and the claimed amount (e.g., "650
euro"). After aligning model and log it is
possible to replay the event log on the model.
While replaying one can analyze these
additional attributes.
For example, as Figure 3 shows, it is
possible to analyze waiting times in-between
activities.Simply measure the timedifference
between causally related events and compu-
te basic statistics such as averages, variances,
and confidence intervals. This way it is
possible to identify the main bottlenecks.
Information about resources can be used to
discover roles, i.e., groups of people
frequently executing related activities. Here,
standard clustering techniques can be used.
It is alsopossibleto construct social networks
based on the flow of work and analyze
resource performance (e.g., the relation
between workload and service times).
Standard classification techniques can be
used to analyze the decision points in the
process model. For example, activity ("de-
cide") has three possible outcomes ("pay",
"reject", and "redo"). Using the data known
about the case prior to the decision, we can
construct a decision tree explaining the
observed behavior.
Figure 3 illustrates that process mining is
not limited to control-flow discovery.
Moreover, process mining is not restricted
to offline analysis and can also be used for
predictions and recommendations at
runtime. For example, the completion time
of a partially handled customer order can be
predicted using a discovered process model
with timing information.
5. Process Mining Creates
Value in Several Ways
After introducing the three types of process
mining using a small example, we now focus
on the practical value of process mining. As
mentioned earlier, process mining is driven
by the exponential growth of event data. For
example, according to MGI, enterprises
stored more than 7 exabytes of new data on
disk drives in 2010 while consumers stored
more than 6 exabytes of new data on devices
such as PCs and notebooks [6].
In the remainder, we will show that process
mining can provide value in several ways. To
illustrate this we refer to case studies where
we used our open-source software package
ProM [1]. ProM was created and is
maintained by the process mining group at
Eindhoven University of Technology.
However, research groups from all over the
world contributed to it, e.g., University of
Padua,Universitat PolitècnicadeCatalunya,
University of Calabria, Humboldt-
Universität zu Berlin, Queensland University
of Technology, Technical University of
Lisbon, Vienna University of Economics
and Business, Ulsan National Institute of
Science and Technology, K.U. Leuven,
Tsinghua University, and University of
Innsbruck. Besides ProM there are about 10
commercial software vendors providing
process mining software (often embedded
in larger tools), e.g., Pallas Athena, Soft-
ware AG, Futura Process Intelligence,
Fluxicon, Businesscape, Iontas/Verint,
Fujitsu, and Stereologic.
A Petri net consists of places and transitions.
The state of a Petri net, also referred to as marking, is defined
by the distribution of tokens over places
Table 1. Examples of Alignment Between the Traces in the Event Log and the Model.
“
”](https://image.slidesharecdn.com/nvs2014-digital-141223095805-conversion-gate02/85/Novatica-223-Process-Mining-English-Edition-16-320.jpg)
![15
Process Mining monograph
monograph novática Special English Edition - 2013/2014 Annual Selection of Articles
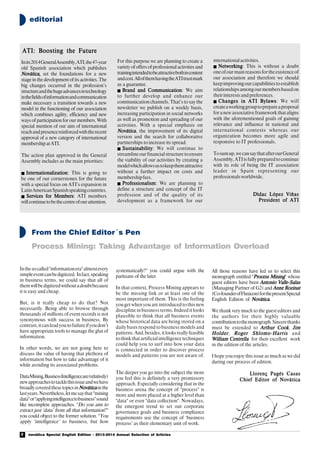
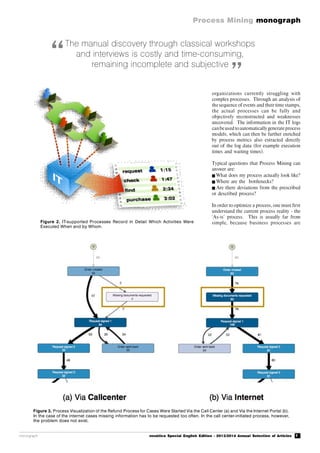
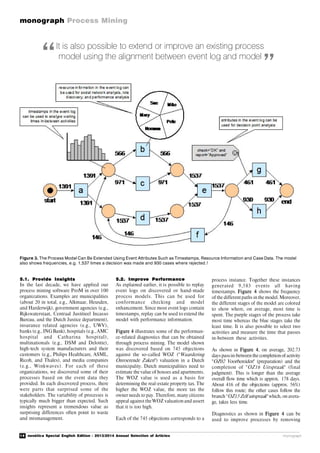
Figure 4. Performance Analysis Based on 745 Appeals against the WOZ Valuation.
bottlenecks and rerouting cases. Since the
modelis connectedto eventdata,itis possible
to "drill down" immediately and investigate
groups of cases that take more time than
others [1].
5.3. Ensure Conformance
Replay can also be used to check
conformance as is illustrated by Figure 5.
Based on 745 appeals against the WOZ
valuation, we also compared the normative
model and the observed behavior: 628 of the
745 cases can be replayed without
encountering any problems. The fitness of
the model and log is 0.98876214 indicating
that almost all recorded events are explained
by the model. Despite the good fitness,
ProM clearly shows all deviations. For
example, "OZ12 Hertaxeren" (reevaluate
property) occurred 23 times while this was
notallowedaccordingto thenormativemodel
(indicated by the "-23" in Figure 5). Again
it is easy to "drill down" and see what these
cases have in common.
The conformance of the appeal process just
described is very high (about 99% of events
are possible according to the model). We
also encountered many processes with a
very low conformance, e.g., it is not
uncommon to find processes where only
40% of the events are possible according to
the model. For example, process mining
revealed that ASML’s modeled test process
strongly deviated from the real process [9].
The increased importance of corporate
governance, risk and compliance manag-
ement, and legislation such as the Sarbanes-
Oxley Act (SOX) and the Basel II Accord,
illustrate the practical relevance of
conformance checking. Process mining can
help auditors to check whether processes are
executed within certain boundaries set by
managers, governments, and other stake
holders [3]. Violations discovered through
process mining may indicate fraud,
malpractice, risks, and inefficiencies. For
example, in the municipality where we
analyzed the WOZ appeal process, we
discovered misconfigurations of their
eiStream workflow management system.
People also bypassed the system. This was
possible because system administrators
could manually change the status of cases
[8].
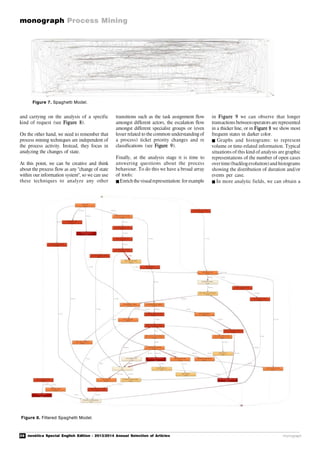
5.4. Show Variability
Hand-made process models tend to provide
an idealized view on the business process
that is modeled. Often such a "PowerPoint
reality" has little in common with the real
processes that have much more variability.
However, to improve conformance and per-
formance, one should not abstract away this
variability.
In the context of process mining we often see
Spaghetti-like models such as the one shown
in Figure 6. The model was discovered
based on an event log containing 24,331
events referring to 376 different activities.
The event log describes the diagnosis and
treatment of 627 gynecological oncology
Often such a ‘PowerPoint reality’ has little in common with
the real processes that have much more variability.
However, to improve conformance and performance,
one should not abstract away this variability
“
”](https://image.slidesharecdn.com/nvs2014-digital-141223095805-conversion-gate02/85/Novatica-223-Process-Mining-English-Edition-18-320.jpg)
![17
Process Mining monograph
monograph novática Special English Edition - 2013/2014 Annual Selection of Articles
References
patients in the AMC hospital in Amsterdam.
The Spaghetti-like structures are not caused
by the discovery algorithm but by the true
variability of the process.
Although it is important to confront
stakeholders with the reality as shown in
Fig. 6,wecanalso seamlesslysimplify Spag-
hetti-like models. Just like using electronic
maps it is possible to seamlessly zoom in and
out [1]. While zooming out, insignificant
things are either left out or dynamically
clustered into aggregate shapes – like streets
andsuburbsamalgamateintocitiesinGoogle
Maps. The significance level of an activity or
connection may be based on frequency,
costs, or time.
5.5. Improve Reliability
Process mining can also be used to improve
the reliability of systems and processes. For
example, since 2007 we have been involved
in an ongoing effort to analyze the event logs
of the X-ray machines of Philips Healthcare
using process mining [1]. These machines
record massive amounts of events. For
medical equipment it is essential to prove
that the system was tested under realistic
circumstances. Therefore, process discovery
was used to construct realistic test profiles.
Philips Healthcare also used process mining
for fault diagnosis. By learning from earlier
problems, it is possible to find the root cause
for new problems that emerge. For example,
using ProM, we have analyzed under which
circumstances particular components are
replaced. This resulted in a set of signatures.
When a malfunctioning X-ray machine
exhibits a particular "signature" behavior,
the service engineer knows what component
to replace.
5.6. Enable Prediction
The combination of historic event data with
real-time event data can also be used to
predict problems. For instance, Philips
Healthcare can anticipate that an X-ray tube
in the field is about to fail by discovering
patterns in event logs. Hence, the tube can
be replaced before the machine starts to
malfunction.
Today, many data sources are updated in
(near) real-time and sufficient computing
power is available to analyze events as they
occur. Therefore, process mining is not
restricted to off-line analysis and can also be
used for online operational support. For a
running process instance it is possible to
make predictions such as the expected
remaining flow time [1].
6. Conclusion
Process mining techniques enable
organizationstoX-raytheirbusinessprocesses,
diagnose problems, and get suggestions for
treatment. Process discovery often provides
[1] W.van derAaalst.Process Mining:Discovery,
Conformance and Enhancement of Business
Processes. Springer-Verlag, Berlin, 2011. ISBN:
978-3-642-19345-3.
[2] W. van der Aaalst. Using Process Mining to
BridgetheGap betweenBIandBPM.IEEEComputer
44, 12, pp. 77–80,2011.
[3] W.van der Aaalst, K. van Hee, J.M. van Werf,
M.Verdonk.Auditing 2.0:Using Process Mining to
SupportTomorrow’s Auditor.IEEE Computer 43,3,
pp. 90–93,2010.
[4]M.Hilbert,P.Lopez.TheWorld’sTechnological
Capacity to Store, Communicate, and Compute
Information.Science 332,6025, pp.60–65, 2011.
[5] TFPM TaskForce on Process Mining.Process
Mining Manifesto.BusinessProcess Management
Workshops,F.Daniel,K.Barkaoui,and S.Dustdar,
Eds. Lecture Notes in Business Information
Processing Series,vol.99.Springer-Verlag,Berlin,
pp. 169–194,2012.
[6] J. Manyika, M. Chui, B. Brown, J. Bughin, R.
Dobbs, C. Roxburgh,A. Byers. Big Data: The Next
Frontier for Innovation, Competition, and
Productivity. McKinsey Global Institute, 2011.
<http://www.mckinsey.com/insights/business_
technology/big_data_the_next_frontier_for_
innovation>.
[7] J. Mendling, G. Neumann, W. van der Aalst.
Understanding the Occurrence of Errors in Process
Models Based on Metrics. Proceedings of the
OTM Conference on Cooperative information
Systems(CoopIS2007).EnF.Curbera,F.Leymann,
and M. Weske, Eds. Lecture Notes in Computer
ScienceSeries,vol.4803.Springer-Verlag,Berlin,
pp. 113–130,2007.
[8] A. Rozinat, W. van der Aalst. Conformance
Checking of Processes Based on Monitoring Real
Behavior. Information Systems 33, 1, pp. 64–95,
2008.
[9] A. Rozinat, I. de Jong, C. Günther, W. van der
Aalst. Process Mining Applied to the TestProcess
of Wafer Scanners in ASML.IEEE Transactions on
Systems, Man and Cybernetics, Part C 39, 4, pp.
474–479,2009.
new and surprising insights. These can be used
to redesign processes or improve management.
Conformance checking can be used to see
where processes deviate. This is very relevant
as organizations are required to put more
emphasis on corporate governance, risks, and
compliance. Process mining techniques offer a
means to more rigorously check compliance
while improving performance.
This article introduced the basic concepts and
showed that process mining can provide value
inseveralways.Thereaderinterestedinprocess
mining is referred to the first book on process
mining [1] and the process mining manifesto
[5] which is available in 12 languages. Also
visit <www.processmining.org> for sample
logs, videos, slides, articles, and software.
The author would like to thank the members
of the IEEE Task Force on Process Mining
and all that contributed to the Process
Mining Manifesto and the ProM framework.](https://image.slidesharecdn.com/nvs2014-digital-141223095805-conversion-gate02/85/Novatica-223-Process-Mining-English-Edition-20-320.jpg)
![18 novática Special English Edition - 2013/2014 Annual Selection of Articles
monograph Process Mining
monograph
1. Introduction
The speed at which data grows in IT systems
[1] makes it crucial to rely on automation in
order to enable enterprises and institutions
to manage their processes. Automated
techniques open the door for dealing with
large amounts ofdata, a mission unthinkable
for a human’s capabilities. In this paper we
discuss one of these techniques: the
discovery of process models. We now
illustrate the main task behind process
discovery by means of a (hopefully) funny
example.
2. A Funny Example: The Visit
of an Alien
Imagine that an alien visits you (see Figure
1) and, by some means, it wants to
communicate the plan it has regarding its
visit to the Earth. For obvious reasons, we
cannot understand the alien’s messages, that
look like the one shown in Figure 2.
Although not knowing the meaning of each
individual letter in the message above, one
may detect that there are some patterns,
e.g., a repetition for the sequence I A C D M
E (first and last six letters in the sequence).
So the question is: how can we represent the
behaviorofthealiens withoutknowingexactly
the meaning of each single piece of
information?
The Process Discovery JourneyJosep Carmona
Software Department, Technical University
of Catalonia, Spain
<jcarmona@l si.upc. edu>
Abstract: Process models are an invaluable element of an IT system: they can be used to analyze,
monitor, or improve the real processes that provide the system’s functionality. Technology has enabled
IT systems to store in file logs the footprints of process executions, which can be used to derive the
process models corresponding with the real processes, a discipline called Process Discovery. We
provide an overview of the discipline together with some of the alternatives that exist nowadays.
Keywords: Formal Methods, Process Discovery, Software Engineering.
Author
Josep Carmona received his MS and PhD degrees in Computer Science from the Technical University
of Catalonia, in 1999 and 2004, respectively. He is an associate professor in the Software Department
of the same university. His research interests include formal methods, concurrent systems, and process
and data mining. He has co-authored more than 50 research papers in conferences and journals.
Figure 1. Our Imaginary Alien.
Process discovery may be a good solution
for this situation: a process discovery
algorithm will try to produce a (formal)
model of the behavior underlying a set of
sequences. For instance, the following for-
mal model in the Business Process Modeling
Notation (BPMN) [2] shown in Figure 3
represents very accurately the behavior
expressed in the alien’s sequences. For those
not familiar with the BPMN notation, the
model above describes the following process:
after I occurs, then (‘x’ gateway) either
branch B followed by X occurs, or branch A
followed by CandD in parallel(‘+’gateway),
and then M occurs. Both branches activate
E which in turn reactivates I. Clearly, even
without knowing anything about the actions
taken from the alien, the global structuring
of these activities becomes very apparent
fromasimple inspectionoftheBPMNmodel.
Now imagine that at some point the meaning
of each letter is decrypted: evaluate the
amount of energy in the Earth (I), high
energy (B), invade the Earth (X), low energy
(A), gather some human samples (C), learn
the human reproduction system (D), teach
humans to increase their energy resources
(M), communicate the situation to the aliens
in the closest UFO (E). In the presence of
this new information, the value of the model
obtained is significantly incremented
(although maybe one may not be relaxed
after realizing the global situation that the
model brings into light).
Figure 2. A Message Sent by the Alien.
I A C D M E I B X E I A D C M E I B X E I A C D M E
3. Anatomy of a Simple Process
Discovery Algorithm
The previous example illustrates one of the
main tasks of a process discovery algorithm:
given a set of traces (called log)
corresponding to a particular behavior under
study,deriveaformal modelwhich represents
faithfully the process producing these tra-
ces. In its simplest form, process discovery
algorithms focus on the control-flow
perspective of the process, i.e., the ordering
activities are performed in order to carry out
the process tasks. The previous example has
considered this perspective.
A log must contain enough information to
extract the sequencing of the activities that
are monitored. Typically, a trace identifier,
an activity name and a time stamp are
required to enable the corresponding
sequencing (by the time stamp) for the
activities belonging to a given trace
(determined by the trace identifier). Other
information may be required if the discovery
engine must take into account additional
information, like resources (what quantity
was purchased?), activity originator (who
performed that activity?), activity duration
(how long does activity X last?), among
others. An example of a discovery algorithm
that takes into account other dimension is
the social network miner [3], that derives
the network of collaborators that carry out a
given process.](https://image.slidesharecdn.com/nvs2014-digital-141223095805-conversion-gate02/85/Novatica-223-Process-Mining-English-Edition-21-320.jpg)
![19
Process Mining monograph
monograph novática Special English Edition - 2013/2014 Annual Selection of Articles
The core of a process discovery algorithm is
the ability to extract the necessary
information required to learn a model that
will represent the process. Process discovery
is often an unsupervised learning task, since
the algorithm is usually exposed only to
positive examples, i.e., successful executions
of the process under study: in the example of
the introduction, we were only exposed to
what the alien plans to do, but we do not
know what the alien does not plan to do.
This complicates the learning task, since
process discovery algorithms are expected
to produce models that are both precise (the
model produced should not deviate much
from the behavior seen) and general (the
model should generalize the patterns
observed in the log) [4]. Obviously, the
presence of negative examples would help
the discovery algorithm into improving these
two quality metrics, but negative information
is often not available on IT logs.
How to learn a process model from a set of
traces? Various algorithms exist nowadays
for various models (see Section 4).
However, let us use the alien’s example to
reason on the discovery of the BPMN model
above. If we focus on the first letter of the
sequence (I), it is sometimes followed by A
and sometimes by B, and always (except for
the first occurrence) preceded by E. These
observations can be expressed graphically as
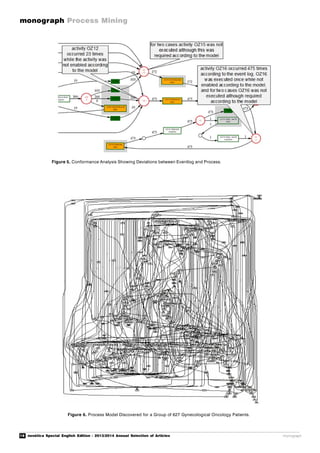
shown in Figure 4.
In BPMN notation, the or-exclusive relation
between the occurrences of either A or B
after I is modeled by using the ‘x’ gateway.
The precedence between E and I is modeled
by an edge connecting both letters in the
model. Symmetrically, E is preceded either
by M or by X. Also, following A both C and
D occur in any order. The well-known alpha
algorithm [5] can find most of these pair-
wise ordering relations in the log, and one
may use them to craft the BPMN model as
Table 1 illustrates.
Table 1 can be read as follows: if in the log
A precedes B always but B is unique (there
is no other letter preceded by A), then a
directed arc between A and B is created. If in
contrast there is always more than one letter
preceded byA,then an ‘+’ gatewayis inserted
between A and the letters preceded by A.
Thesometimes relation can be readsimilarly.
Hence one can scan the log to extract these
relations (worst-case quadratic in the size of
the log) and use the table to create the
BPMN model. However, this is a very
restrictive way of discovery since other
relations available in the BPMN notation
can also be hidden in the log, like the inclu-
sive-or relation, but the algorithm does not
consider them. Process discovery
algorithmsare alwaysin a trade-off between
the complexity of the algorithm and the
modeling capacity: the algorithm proposed
in this section could be extended to
consider also inclusive-or gateways, but
that may significantly complicate the
algorithm. Below we address informally
these and other issues.
4. Algorithms and Models
There are severalmodelsthat can be obtained
through different process discovery
algorithms: Petri nets, Event-driven Process
Chains, BPMN, C-Nets, Heuristic Nets,
Business Process Maps, among others.
Remarkably, most of these models are
supported by replay semantics that allow
one to simulate the model in order to certify
its adequacy in representing the log.
To describe each one of these models is out
of the scope of this article, but I can briefly
comment on Petri nets, which is a model
often produced by discovery algorithms, due
toitsformalsemanticsandabilitytorepresent
concurrency. For the model of our running
example, the corresponding Petri net that
would be discovered by most of the Petri net
discovery algorithms will be as shown in
Figure 5.
Those readers familiar with Petri nets will
find a perfect match between the underlying
behavior of the Petri net and the alien’s
trace. Notice that while in the BPMN model,
apart from the units of information (in this
case letters of the alphabet), there are other
model components (gateways) whose
semantics define the way the model
represents the log traces.
The same happens with the Petri net above,
where the circles correspond to the global
behavior of the model, which is distributed
amongthenet(onlysomecirclesaremarked).
While the discovery algorithm for BPMN
needs to find both the connections and
gateways, the analogous algorithm for Petri
nets must compute the circles and
connections.
Several techniques exist nowadays to
accomplish the discovery of Petri nets,
ranging from the log-ordering relations
extracted by the alpha algorithm, down to
very complex graph-based structures that
are computed on top of an automaton
representing the log traces.
What process discovery algorithm/modeling
notation to choose? This is in fact a very
good question that can only be answered
partially: there is no one model that is better
than the rest, but instead models that are
better than others only for a particular type
of behaviors. Actually, deciding the best
Figure 3. A Formal Model of Behavior in the Alien’s Sequences in BPMN.
The core of a process discovery algorithm is the ability
to extract the necessary information required to learn a
model that will represent the process
“
”
I X
A
B X
+
C
D
+ M
X E](https://image.slidesharecdn.com/nvs2014-digital-141223095805-conversion-gate02/85/Novatica-223-Process-Mining-English-Edition-22-320.jpg)
![20 novática Special English Edition - 2013/2014 Annual Selection of Articles
monograph Process Mining
monograph
modeling notation fora logis a hard problem
for which research must provide techniques
in the next decade (a problem called
representational bias selection). From a
pragmatic point of view, one must select
those process modeling notations one is
familiar with, and expect the discovery
algorithms for that notation to be good
enough for the user needs.
As said before, other perspectives different
fromthecontrol-flowview maybe considered
by process discovery algorithms: time,
resources, organizational, etc.
The reference book [6] may be consulted in
order to dig into these other process
discovery algorithms.
5. Tools
Process discovery is a rather new discipline,
if compared with related areas such as data
mining or machine learning. In spite of this,
one can find process mining tools both in
academia (mostly) but also in industry.
The following classification is by no means
exhaustive, but instead reports some of the
prominent tools one can use to experience
with process discovery tools:
ACADEMIA: the ProM Framework, from
Technical University of Eindhoven (TU/e) is
the reference tool nowadays. It is the result of
a great academic collaboration among several
universities in the world to gather algorithmic
support for process mining (i.e., not only
process discovery). Additionally, different
groupshavedevelopedseveralacademicstand-
alone tools that incorporate modern process
discovery algorithms.
INDUSTRY: some important companies
have invested an effort into building process
discovery tools, e.g., Fujitsu (APD), but
also medium-sized or start-ups that are more
focused on process mining practices, e.g.,
Always Sometimes
A precedes B
B Unique:
General:
B Unique:
General:
A
B
+
C
A
B
x
A
B
x
C
A B
Table 1. BPMN Model Built from Patterns in the Alien’s Messages.
I A C D M E I B X E I A D C M E I B X E I A C D M E
Figure 4. Patterns Observed in the Alien’s Messages.
I
A
B X
C
D
M
E
Figure 5. Petri Net for the Model of Our Running Example.](https://image.slidesharecdn.com/nvs2014-digital-141223095805-conversion-gate02/85/Novatica-223-Process-Mining-English-Edition-23-320.jpg)
![21
Process Mining monograph
monograph novática Special English Edition - 2013/2014 Annual Selection of Articles
References
[1]S.Rogers.Datais Scaling BIand Analytics-Data
Growth is About to Accelerate Exponentially - Get
Ready. Information and Management - Brookfield,
21(5):p.14,2011.
[2] D. Miers, S.A. White. BPMN Modeling and
ReferenceGuide:Understandingand Using BPMN.
FutureStrategiesInc.,2008.ISBN-10:0977752720.
[3] W. M. P. van der Aalst, H. Reijers, M. Song.
Discovering Social Networks form Event Logs.
Computer Supported Cooperative Work, 14(6):pp.
549-593,2005.
[4] A.Rozinat,W.M.P.vanderAalst.Conformance
Checking of Processes Based on Monitoring Real
Behavior.InformationSystems,33(1):pp.64-95,2008.
[5]W.M.P.vanderAalst,A.Weijters,L.Maruster.
WorkflowMining:DiscoveringProcessModelsfrom
Event Logs. IEEE Transactions on Knowledge and
Data Engineering,16(9):pp.1128–1142,2004.
[6]W.M.P.vanderAalst.ProcessMining:Discovery,
Conformance and Enhancement of Business
Processes.Springer,2011.ISBN-10:3642193447.
Actually, deciding the best modeling notation for
a log is a hard problem for which research must
provide techniques in the next decade
“
”
Pallas Athena (ReflectOne), Fluxicon (Dis-
co), Perspective Software (BPMOne, Futu-
ra Reflect), Software AG (ARIS Process
Performance Manager), among others.
6. Challenges
The task of process discovery may be
aggravated if some of the aspects below are
present:
Log incompleteness:the log often contains
only a fraction of the total behavior
representing the process. Therefore, the
process discovery algorithm is required to
guess part of the behavior that is not present
in the log, which may be in general a difficult
task.
Noise: logged behavior may sometimes
represent infrequent exceptions that are not
meant to be part of the process. Hence,
process discovery algorithms may be
hampered when noise is present, e.g., in
control-flow discovery some relations
between the activities may become
contradictory. To separate noise from the
valid informationinalog is acurrent research
direction.
Complexity: due to the magnitude of
current IT logs, it is often difficult to use
complex algorithms that may either require
loading the log into memory in order to
derive the process model, or applytechniques
whose complexity are not linear on the size
of the log. In those cases, high level strategies
(e.g., divide-and-conquer) are the only
possibility to derive a process model.
§ Visualization: even if the process
discovery algorithm does its job and can
derive a process model, it may be hard for a
human to understand it if it has more than a
hundred elements (nodes, arcs). In those
cases, a hierarchical description, similar to
the Google Maps application were one can
zoom in or out of a model’s part, will enable
the understanding of a complex process
model.
Acknowledgements
I would like to thank David Antón for creating the
alien’s drawingused in thispaper.](https://image.slidesharecdn.com/nvs2014-digital-141223095805-conversion-gate02/85/Novatica-223-Process-Mining-English-Edition-24-320.jpg)
![22 novática Special English Edition - 2013/2014 Annual Selection of Articles
monograph Process Mining
monograph
1. Roles and Responsibilities
in ITSM Models
All models, standards or frameworks used in
the ITSM industry are process oriented.
This is because process orientation helps
structure the related tasks and allows the
organization to formalize the great variety of
activities performed daily: which activities
to execute and when, who should carry them
out, who owns what responsibilities over
those tasks, which tools or information
systems to use and what are the expected
objectives and outcomes of the process.
One model commonly used to represent the
different components of the process is the
ITOCO model [1] Figure 1 that represents
the fundamental elements of a process:
Inputs, Outputs, Tasks, Control parameters
and Outcomes.
This modelallows us to differentiate between
three different roles needed for the correct
execution of any process: process operators,
who are responsible for executing the
different tasks; process managers, who
warrantee that the process execution meets
thespecificationsand ensure thatboth inputs
and outputs match the expectations (within
thespecifiedcontrolparameters);and process
owners, who use a governance perspective
to define the process, its outcomes and the
applicable controls and policies, as well as
being responsible to obtain and allocate the
resources needed for the right execution of
the process.
The process manager’s job is the execution
of the control activities (also called the
control process) over the managed process,
acting on the deviations or the quality
variations of the results, and managing the
allocated resources to obtain the best
possible results. Therefore, this role requires
a combination of skills from diverse
professional disciplines such as auditing,
consulting and, chiefly, continuous
improvement.
2. ITSM Process Management
The ITSM industry has traditionally used a
number of methodological tools to enable
the process manager do the job:
Definition of metrics and indicators
(usually standardized from the adopted
frameworks).
Usage of Balanced Scorecards to show
Using Process Mining in ITSMAntonio Valle-Salas
Managing Partner of G2
<avalle@gedos.es>
Abstract: When it comes to information systems, ranging from copiers to surgical equipment or
enterprise management systems, all the information about the processes executed using those systems
are frequently stored in logs. Specifically for IT Service Management processes (ITSM), it is quite
common for the information systems used to execute and control those processes to keep structured
logs thatmaintainenough informationtoensure traceability of therelated activities. It wouldbe interesting
to use all that information to get an accurate idea of ??how the process looks like in reality, to verify if
the real process flow matches the previous design, and to analyze the process to improve it in order
to become more effective and efficient. This is the main goal of process mining. This paper explores
the different capabilities of process mining and its applicability in the IT Service Management area.
Keywords: Change Management, ITSM, Process Management Tools, Process Mining, Service Desk,
Services.
Author
Antonio Valle-Salas is Managing Partner of G2 and a specialist consultant in ITSM (Information
Technology Service Management) and IT Governance. He graduated as a Technical Engineer in
Management Informatics from UPC (Universitat Politécnica de Catalunya) and holds a number of
methodology certifications such as ITIL Service Manager from EXIN (Examination Institute for Information
Science), Certified Information Systems Auditor (CISA) from ISACA, and COBIT Based IT Governance
Foundations from IT Governance Network, plus more technical certifications in the HP Openview family
of management tools. He is a regular collaborator with itSMF (IT Service Management Forum) Spain
and its Catalan chapter, and combines consulting and project implementation activities with frequent
collaborations in educational activities in a university setting (such as UPC or the Universitat Pompeu
Fabra) and in the world of publishing in which he has collaborated on such publications as IT Governance:
a Pocket Guide, Metrics in IT Service Organizations, Gestión de Servicios TI. Una introducción a ITIL,
and the translations into Spanish of the books ITIL V2 Service Support and ITIL V2 Service Delivery.
and follow those indicators.
Definition of management reports (daily,
weekly, monthly).
Usage of various kinds of customer and/or
user satisfaction surveys.
Performance of internal or external
compliance audits.
These tools allow the process manager to
gain knowledge about the behavior of the
processes she is in charge of, and to make
decisions to set the correct course of tasks
and activities. However these tools are
commonly rather rigid whereas the process
manager needs a deeper analysis of the
process behaviour.
Still, there are two key aspects of any
continuous improvement model: to know
what the current situation is - as the starting
point for the improvement trip - and to
understand what the impact of the
improvementinitiativeswillbeontheprocess
and its current situation. Both aspects are
represented in Figure 2.
At these initial stages many questions arise
regarding the daily activities of the process
manager, namely:
Which is the most common flow?
What happens in some specific type of
request?
How long are the different cases at each
state of the flow?
Can we improve the flow?
Where is the flow stuck?
Which are the most repeated activities?
Are there any bottlenecks?
Are the process operators following the
defined process?
Is there segregation of duties in place?
Moreover, in ITSM we usually find that
most processes defined using frameworks
do not fully match the real needs of daily
operations; a standard and rigid approach to
processes does not meet the needs of those
activities in which the next steps are not
known in advance [2].
One clear case of this type of processes in
ITSM is the problem management process.
Here, to be able to execute the diagnostics
andidentificationofroot causes,the operator](https://image.slidesharecdn.com/nvs2014-digital-141223095805-conversion-gate02/85/Novatica-223-Process-Mining-English-Edition-25-320.jpg)
![23
Process Mining monograph
monograph novática Special English Edition - 2013/2014 Annual Selection of Articles
will have to decide the next step according to
the results of the previous analysis. Thus,
problem management is, by nature, a non-
structuredprocesswhose behaviorwill totally
differ from a strict process such as request
management.
3. Process Mining & ITSM
The first and most delicate task when using
process mining techniques is obtaining a log
of good quality, representative of the process
we want to analyze, and with enough
attributes to enable filtering and driving
subsequent analysis steps as shown in Figu-
re 3.
Fortunately enough, most ITSM process
management tools have logs that allow the
actionsexecuted bythevariousprocess actors
to be traced. These logs (e.g. Figure 4) are
usually between maturity levels IV and V on
the scale proposed by the Process Mining
Manifesto [3].
The following steps of discovery and
representation are those in which the use of
process mining techniques provides
immediate value.
The designed processes are usually different
to the real execution of activities. This is
caused by various factors, amongst which
we find too generalist process designs (to try
to covernon-structuredprocesses), flexibility
of the management tools (that are frequently
configured to allow free flows instead of
closed flows) and process operator’s
creativity (they are not always comfortable
with a strict process definition).
For this reason, both the process owner and
the processmanagerusuallyhaveanidealized
view of the process, and so are deeply
surprised the first time they see a graphic
representation of the process from the
analysisoftherealandcomplete information.
For instance, as mentioned in USMBOK
[4], the different types of request a user can
log into a call center will be covered by a
single concept of Service Request that will
then follow a different flow or Pathway as
shown in Figure 5. This flow will be "fitted"
within a common flow in the corresponding
module of the management tool used by the
Service Desk team.
In order to fit this wide spectrum of different
types of requests into a relatively general
flow we usually avoid a closed definition of
the process and its stages (in the form of a
deterministic automat) but we allow an open
flow as shown in Figure 6 in which any
operator decides at any given time the next
state or stage of the corresponding life cycle
[2].
That is why, when we try to discover and
represent these types of activities, we find
whatinprocess mining jargon is called "spag-
hetti model" as shown in Figure 7. In this
model, even with a reduced number of cases,
the high volume and heterogeneous
transactions between states makes the
diagram of little (if any) use.
Therefore, to facilitate analysis, we need to
use some techniques to divide the problem
into smaller parts [5]. We can use clustering,
or simply filtering the original log, in order to
select thetype ofpathway we wantto analyze.
Previous to the discovery and representation
tasks, it is recommended that the log is
enriched with any available information that
will later allow segmenting the data set
according to the various dimensions of
analysis.
For instance, in this case we will need to
have an attribute indicating the request type
or pathway to be able to break down the
model by requests, segmenting the data set
The role of the process manager requires a combination
of skills from diverse professional disciplines such as auditing,
consulting and, chiefly, continuous improvement
Figure 1. The ITOCO Model.
“
”
Tasks
Procedures
Work Instructions
Roles
Control,
Quality
Specifications,
Policies
RESOURCES CAPABILITIES
Inputs Outputs
RESOURCES CAPABILITIES](https://image.slidesharecdn.com/nvs2014-digital-141223095805-conversion-gate02/85/Novatica-223-Process-Mining-English-Edition-26-320.jpg)
![27
Process Mining monograph
monograph novática Special English Edition - 2013/2014 Annual Selection of Articles
Figure 9. Social Map: How Cases Flow through the Different Process Operators.
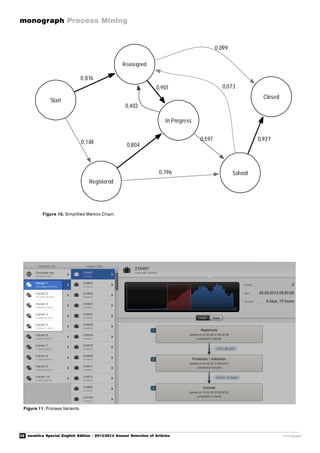
To facilitate analysis we need to use some
techniques to divide the problem into smaller parts
diagram showing a Márkov Chain for our
process (see Figure 10). It will depict the
probability for a particular transition to
happen, to help answer questions like
"what is the probability that a closed ticket
will be re-opened?" We can also
complement this information with case
attributes: affected item, contact person,
request type, organization etc. so that the
model for analysis is richer.
So far we have covered methodological tools
and mechanisms intended for quantitative and
statistical analysis of processes and their
behaviour. However, there is another side of
the analysis focusing in the specific area of
execution, answering questions such as "are
thereclearpatternsofbehaviorinmyprocess?",
"is the process execution meeting previous
definitions or corporate policies?" [6].
To answer the first question we will use
the concept of "variant". We can describe
a variant as the set of cases executed
following the same trace of sequence of
events. Thus, it is possible that some types
of requests are always completed in a
common pattern. We will easily check this
by analyzing the variants of our process as
shown in Figure 11 (right side), where we
see 79% of cases following the same flow:
Registered à Completed / Validation à
Closed.
To answer the second questions about
process conformance we must have a formal
model of the process to compare with its real
execution. Once we have this piece, we can
carry out different approaches to theproblem
of validation of conformance, as described
by Anne Rozinat in her paper Conformance
Checking of Processes Based on Monitoring
Real Behavior [7]:
Fitness analysis: answers the question "is
the observed process complying with the
process flow specified in the model?"
Appropriateness analysis: answers the
question "does the process model describe
the observed process appropriately?"
Nevertheless, calculating some fitness index
to a particular model will not be enough
when doing analysis or audits; in those
situations we will need ways to do complex
consultations of the log [8]. To be able to
knowinwhich situationsactivity Ais executed
before activity B, or when did operator X
executes activities A and B, will be of great
importance to unveil violations of business
rules or policies that govern the execution of
the process.
If these techniques are applied to ITSM
processes, we can provide an interesting
application to ensure segregation of duties
in change management for those
organizations needing to comply with SOX
or similar regulations. Next step would be
continuously monitoring of these rules [9].
4. Conclusions
Process mining is presented as a set of tools
that facilitate to a large degree process
owners’ and process managers’ tasks, from
acquiringknowledgeabouttherealbehaviour
of the process to audits and continuous
improvement. They allow many analyses
that would be practically impossible or
extremely costly to perform using traditional
strategies like reporting, dashboarding or
measuring indicators.
Although, generally speaking, one of the
biggest difficulties we find in process mining
is the lack of information or logs to analyze,
in the specific area of IT service management
“ ”](https://image.slidesharecdn.com/nvs2014-digital-141223095805-conversion-gate02/85/Novatica-223-Process-Mining-English-Edition-30-320.jpg)
![29
Process Mining monograph
monograph novática Special English Edition - 2013/2014 Annual Selection of Articles
References
[1]JanvanBon.ITServiceManagementGlobalBest
Practices,Volume 1.NL,NL:Van Haren Publishing,
2008.
[2] Rob England. Plus! The Standard+Case
Approach.Wellington,NZ:CreateSpace,2013.
[3] IEEE Task Force on Process Mining. Process
MiningManifesto(in 12 languages).<http://www.
win.tue.nl/ieeetfpm/doku.php?id=shared:
process_mining_manifesto>.
[4] Ian M. Clayton. USMBOK - The Guide to the
Universal ServiceManagementBodyofKnowledge.
CA,US: ServiceManagement 101, 2012.
[5] Marco Aniceto Vaz, Jano Moreira de Souza,
Luciano Terres, Pedro Miguel Esposito. A Case
StudyonClusteringandMiningBusinessProcesses
from a University,2011.
[6]Wil M.P.van derAalst et al.Auditing2.0:Using
ProcessMiningtoSupportTomorrow’sAuditor,2010.
<http://bpmcenter.org/wp-content/uploads/
reports/2010/BPM-10-07.pdf>.
[7]AnneRozinat,W.M.P.vanderAalst.Conformance
Checking of Processes Based on Monitoring Real
Behavior, 2008. <http://wwwis.win.tue.nl/
~wvdaalst/publications/p436.pdf>.
[8] W.M.P. van der Aalst, H.T. de Beer, B.F. van
Dongen. Process Mining and Verification of
Properties: An Approach based onTemporal Logic,
2005.
[9] Linh Thao Ly, Stefanie Rinderle-Ma, David
Knuplesch, Peter Dadam. Monitoring Business
ProcessComplianceUsingComplianceRuleGraphs,
2011. <http://dbis.eprints.uni-ulm.de/768/1/
paper.pdf>.
this is not a problem. Here ITSM process
management tools keep logs that can be
used for process mining and can define
auditable fields to be traced giving us
different perspectives or dimensions of
analysis.
Therefore, process mining stands out as a
powerful and adequate tool to support ITSM
practices in its permanent quest for
improvement opportunities, both for
processes and services of the management
system.](https://image.slidesharecdn.com/nvs2014-digital-141223095805-conversion-gate02/85/Novatica-223-Process-Mining-English-Edition-32-320.jpg)
![30 novática Special English Edition - 2013/2014 Annual Selection of Articles
monograph Process Mining
monograph
1. Introduction1. Introduction1. Introduction1. Introduction1. Introduction
As the role of Big Data gains prevalence in
this information-driven era [1][2][3],
businesses the world over are constantly
searching for ways to take advantage of
these potentially valuable resources. The
2012 Business Processing Intelligence
Challenge (BPIC, 2012) is an exercise in
analyzing one such data set using a
combinationofcommercial,proprietary,and
open-sourcetools,andcombiningthesewith
creative insights to better understand the
role of process mining in the modern
workplace.
1.1. Approach and Scope1.1. Approach and Scope1.1. Approach and Scope1.1. Approach and Scope1.1. Approach and Scope
The situation depicted in BPIC 2012 focuses
ontheloanandoverdraftapprovalsprocessof
a real-world financial institution in the
Netherlands.Inouranalysisofthisinformation,
we sought to understand the underlying busi-
ness processes in great detail and at multiple
levelsofgranularity.Wealsosoughttoidentify
anyopportunitiesforimprovingefficiencyand
effectivenessoftheoverallprocess.Specifically,
weattemptedtoinvestigatethefollowingareas
in detail:
Develop a thorough understanding of the
data and the underlying process.
Understand critical activities and decision
points.
Map the lifecycle of a loan application
from start to eventual disposition.
Identify any resource-level differences in
performance and opportunities for process
interventions.
As newcomers to process mining, we at
CKM Advisors wanted to use this
opportunity to put into practice our
learning in this discipline. We also
attempted to combine process mining tools
with traditional analytical methods to build
a more complete picture. We are certain
that with experience, our approach will
become more refined and increasingly
driven by methods developed specifically
for process mining.
Our attempt was to be as broad as possible
in our analysis and delve deep where we
could. While we have done detailed analysis
in a few areas, we have not covered all
possible areas of process mining in our
analysis. Any areas that we did not cover (for
example, social network analysis) are driven
solely by our own comfort and familiarity
Process Mining-Driven
Optimization of a Consumer
Loan Approvals Process
Arjel Bautista, Lalit Wangikar,
S.M. Kumail Akbar
CKM Advisors, 711 Third Avenue, Suite
1806, New York, NY, USA
<{abautista,lwangikar,sakbar}@ckmadvisors.com><{abautista,lwangikar,sakbar}@ckmadvisors.com><{abautista,lwangikar,sakbar}@ckmadvisors.com><{abautista,lwangikar,sakbar}@ckmadvisors.com><{abautista,lwangikar,sakbar}@ckmadvisors.com>
Abstract: An event log (262,200 events; 13,087 cases) of the loan and overdraft approvals process
from a bank in the Netherlands was analyzed using a number of analytical techniques. Through a
combination of spreadsheet-based approaches, process mining capabilities and exploratory analytics,
we examined the data in great detail and at multiple levels of granularity. We present our findings on
how we developed a deep understanding of the process, assessed potential areas of efficiency
improvement and identified opportunities to make knowledge-based predictions about the eventual
outcome of a loan application. We also discuss unique challenges of working with such data, and
opportunities for enhancing the impact of such analyses by incorporating additional data elements.
Keywords: Big Data, Business Process Intelligence, Data Analytics, Process Mining.
Authors
Arjel Bautista is a consultant at CKM Advisors, involved in the development of innovative process re-
engineering and analytical research techniques within the firm. In his projects, Arjel has deployed a
combination of state-of-the-art data mining tools and traditional strategic analysis to solve a variety of
problems relating to business processes. He has also developed strategies for the analysis of
unstructured text and other non-traditional data sources. Arjel holds Masters and Doctorate degrees in
Chemistry from Yale University, and a Bachelor’s degree in Biochemistry from UC San Diego.
Lalit Wangikar is a Partner at CKM Advisors. As a consultant, Lalit has advised clients primarily in the
financial services sector, insurance, and payment services industries. His primary area of expertise is
use of Big Data and Analytics for driving business impact across all key business areas such as
marketing, risk, operations and compliance. He has worked with clients in North America, UK, Singapore
and India. Prior to joining CKM Advisors, Lalit ran Decision Analytics practice for EXL Service / Inductis.
Prior to that he worked as a consultant with Deloitte Consulting and Mitchell Madison Group where he
advised clients in banking and capital markets verticals.
Syed M. Kumail Akbar is a Consultant at CKM Advisors where he is a member of the Analytics Team
and assists in data mining, process mapping and predictive analytics. In the past, he has worked on
strategy and operations projects in the financial services industry. Before joining CKM, Syed worked
as a research assistant in both the Quantitative Analysis Center and the Physics Department at Wesleyan
University. He also co-founded Possibilities Pakistan, a Non-Governmental Organization dedicated to
providing access to college counseling for high school students in Pakistan. Syed holds a BA in Physics
and Mathematics-Economics from Wesleyan University.
with the subject matter, and not necessarily
a limitation of the data.
2. Materials and Methods2. Materials and Methods2. Materials and Methods2. Materials and Methods2. Materials and Methods
2.1. Understanding the Data2.1. Understanding the Data2.1. Understanding the Data2.1. Understanding the Data2.1. Understanding the Data
The data captures process events for
13,087 loan / overdraft applications over a
six month period, between October 2011
and March 2012. The event log is
comprised of a total of 262,200 events
within these cases, starting with a customer
submitting an application and ending with
eventual conclusion of that application
into an approval, cancellation or rejection
(declined). Each application contains a
single attribute, AMOUNT_REQ, which
indicates the amount requested by the
applicant. For each event, the extract shows
the type of event, lifecycle stage (Schedu-
le, Start, Complete), a resource indicator
and time of completion.
The events themselves describe steps along
the approvals process and are classifiedinto
three major types. Table 1Table 1Table 1Table 1Table 1 shows the event
types and our understanding of what the
events mean.
By itself, the event log is a complicated mass
of information from which it is difficult to
drawlogicalconclusions.Therefore,asother
researchers have noted [4][5], it is necessary
to subject the log to some degree of
preprocessing in order to reduce its overall
complexity,makevisualconnectionsbetween
the steps contained within, and aid in
analyzing and optimizing the business
concepts at hand.](https://image.slidesharecdn.com/nvs2014-digital-141223095805-conversion-gate02/85/Novatica-223-Process-Mining-English-Edition-33-320.jpg)
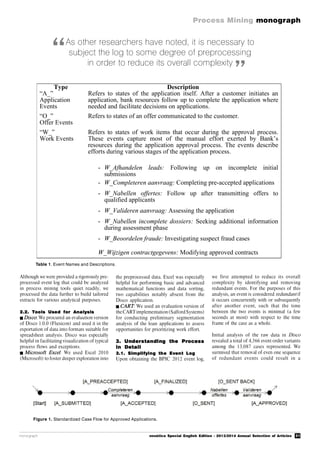
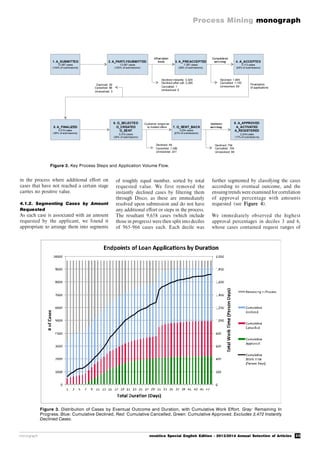
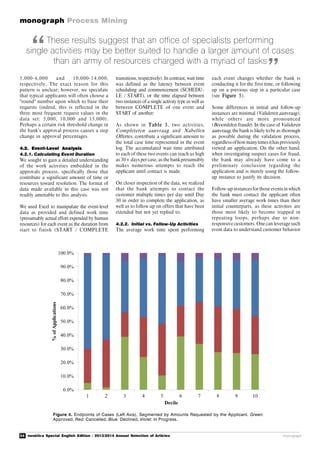
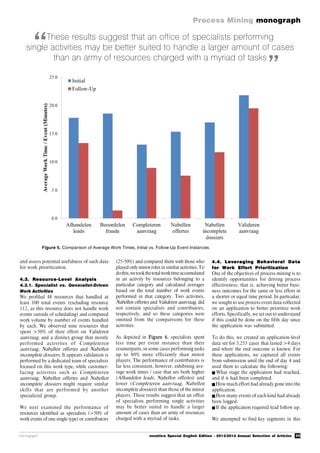
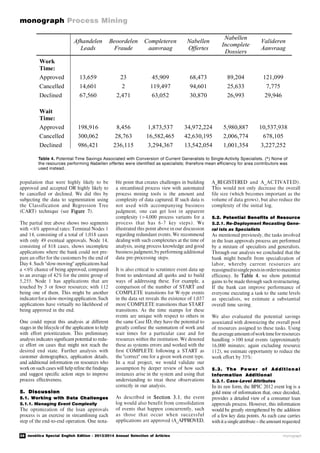
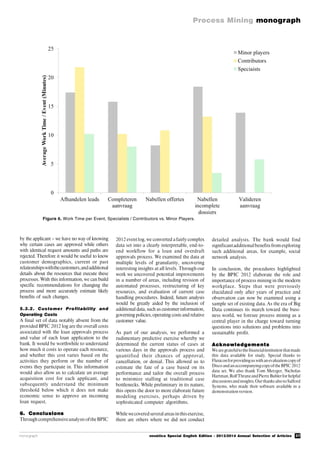
![38 novática Special English Edition - 2013/2014 Annual Selection of Articles
monograph Process Mining
monograph
References
[1] W.Van der Aalst,A.Adriansyah, A.K. Alves de
Medeiros,F.Arcieri,T.Baieretal.Process Mining
Manifesto. Business Process Management
Workshops 2011, Lecture Notes in Business
Information Processing, vol. 99. Springer-Verlag,
2011.
[2]J.Manyika,M.Chui,B.Brown,J.Bughin,R.Dobbs,
C.Roxburgh,A.Byers.Big Data: TheNext Frontier for
Innovation,Competition, and Productivity. McKinsey
Global Institute, 2011. <http://www.mckinsey.com/
insights/business_ technology/big_data_the_next_
frontier_for_innovation>.
[3]R.Adduci,D.Blue,G.Chiarello,J.Chickering,D.
Mavroyiannis et al. Big Data: Big Opportunities to
CreateBusinessValue.Technicalreport,Information
IntelligenceGroup,EMCCorporation,2011.
Figure 7. Partial View, CART Segmentation Tree.
It is also critical to scrutinize event data up front to understand
all quirks and to build ways of addressing these
“ ”
[4]R.P.J.C.Bose,W.M.P.vanderAalst.Analysisof
Patient Treatment Procedures: The BPI Challenge
Case Study. First International Business Process
IntelligenceChallenge,2011.<http://bpmcenter.org/
wp-content/uploads/reports/2011/BPM-11-
18.pdf>.
[5]W.M.P.vanderAalst.ProcessMining:Discovery,
Conformance and Enhancement of Business
Processes.Springer,2011.ISBN-10:3642193447.](https://image.slidesharecdn.com/nvs2014-digital-141223095805-conversion-gate02/85/Novatica-223-Process-Mining-English-Edition-41-320.jpg)
![39
Process Mining monograph
monograph novática Special English Edition - 2013/2014 Annual Selection of Articles
Detection of Temporal Changes
in Business Processes
Using Clustering Techniques
1. Introduction
In a globalized and hyper-connected world,
organizations need to be constantly
changing in order to adapt to the needs of
their business environment, which implies
that their business processes must also be
constantly changing.
To illustrate this, consider the case of a
toy store whose sales practices may change
radically depending on whether they are
executed over the Christmas period or
during vacations, principally due to the
changes in the volume of the demand. For
the Christmas season, they might employ
a process that prioritizes efficiency and
volume (throughput), while during the
vacation season they might use a process
which focuses on the quality of their
customer service.
In this example, it is easy to identify the
periods in which demand changes, and thus
it is possible that the process manager (the
person in charge of the process management)
willhaveaclearunderstandingofthechanges
that the sales process undergoes over time.
However, if an organization has a process
that occurs in various independent offices,
for example, offices that are located in
different geographic locations, the evolution
of the changes in the process at each office
will not be so evident to the central process
manager. Moreover, the changes in each
office could be different and could happen
at different moments in time.
Understanding the changes that are
occurring in the different offices could
help to better understand how to improve
the overall design of the process. Being
able to understand these changes and
model the different versions of the process
allow the process manager to have more
accurate and complete information in order
to make coherent decisions which result in
better service or efficiency.
To achievethe aforementionedgoals,various
advances have been made in the discipline
of Business Process Management (BPM), a
discipline which combines knowledge about
information technology and management
techniques, which are then applied to busi-
ness operation processes, with the goal of
improving efficiency [1]. Within BPM,
process mining has positioned itself as an
emerging discipline, providing a set of tools
that help to analyze and improve business
processes [1], based on analyzing event logs
stored by information systems during the
execution of a process. However, despite the
advances made in this field, there still exists
a great challenge, which consists of
incorporating the fact that processes change
over time, a concept which is known in the
literature as Concept Drift [2].
Depending on the nature of the change, it
is possible to distinguish different types of
Concept Drift, including: Sudden Drift
(sudden and significant change to the
definition of the process), Gradual Drift
(gradual change to the definition of the
process, allowing for the simultaneous
existence of the two definitions), and
Incremental Drift (the evolution of the
process that occurs through small,
consecutive changes to the definition of
the model).
Despite the existence of all these Drift types,
the existing techniques of process mining
are limited to finding the points in time when
the process changes, centering principally
on Sudden Drift changes. The problem with
this limitation is that in practice it is not as
frequent for business processes to show a
sudden change in definition.
If we apply the existing process mining
approaches to processes that have different
kinds of changes other than Sudden Drift,
we could end up with results which make
little sense to the business.
In thisdocument we propose anew approach,
which allows the discovery of the various
versions of a process when there are different
kinds of Drift, helping to understand how
theprocess behavesover time.Toaccomplish
this task, existing process mining clustering
techniques are used, but with time
incorporated as an additional factor to the
Abstract: Nowadays, organizations need to be constantly evolving in order to adjust to the needs of
their business environment. These changes are reflected in their business processes, for example:
due to seasonal changes, a supermarket’s demand will vary greatly during different months of the
year, which means product supply and/or re-stocking needs will be different during different times of
the year. One way to analyze a process in depth and understand how it is really executed in practice
over time, is on the basis of an analysis of past event logs stored in information systems, known as
process mining. However, currently most of the techniques that exist to analyze and improve processes
assume that process logs are in a steady state, in other words, that the processes do not change over
time, which in practice is quite unrealistic given the dynamic nature of organizations. This document
presents in detail the proposed technique and a set of experiments that reflect how our proposal
delivers better results than existing clustering techniques.
Keywords: Concept Drift, Clustering, Process Mining, Temporal Dimension.
Authors
Daniela Luengo was born in Santiago, Chile. She is an Industrial Civil Engineer with amajor in Information
Technology from Pontificia Universidad Católica de Chile. She also received the academic degree of
Master of Science in Engineering from the same university. Additionally she has an academic certificate
in Physical Activity, Sport, Health and Education. From 2009 to 2013 she worked at the Information
Technology Research Center of the Pontificia Universidad Católica de Chile (CETIUC), as an analyst
and consultant in the area of process management excellence, performing process mapping, process
improvement and several researches. Her current interests are focused on applying her knowledge in
the public sector of her country.
Marcos Sepúlveda was born in Santiago, Chile. He received his Ph.D. on Computer Science from the
Pontificia Universidad Católica de Chile in 1995. He made a postdoctoral research in the ETH Zürich,
Switzerland. He is an associate professor in the Computer Science Department at the Pontificia Univer-
sidad Católica de Chile since 2001. He is also the director of the Information Technology Research
Center of his university (CETIUC). His research interests are Process Mining, Business Process Modeling,
Business Intelligence, and Information Systems Management.
Daniela Luengo, Marcos
Sepúlveda
Computer Science Department, School of
Engineering, Pontificia Universidad Católi-
ca de Chile, Santiago (Chile)
<dll uengo@u c.cl>,<marcos@ ing.puc .cl>](https://image.slidesharecdn.com/nvs2014-digital-141223095805-conversion-gate02/85/Novatica-223-Process-Mining-English-Edition-42-320.jpg)
![40 novática Special English Edition - 2013/2014 Annual Selection of Articles
monograph Process Mining
monograph
“
”
control-flow perspective to generate the
different clusters. Trace Clustering
techniques are used, which unlike other
metrics-based techniques that measure the
distance between complete sequences
having linear complexity, allowing for the
delivery of results in a shorter time span
[3].
The focus of our work contributes to the
process analysis, allowingthe process manager
to have a more realistic vision of how the
process behaves over different periods of time.
With this approach it is possible to determine
the different versions of the process, the
characteristics of each process, and to identify
in which moment the changes occur.
This article is organized in the following
way. Section 2 presents the related work.
Section 3 describes base and the modified
version of the clustering method. Section 4
presents experiments and results and finally
theconclusions andfutureworkarepresented
in section 5.
2. Related Work
Process mining is a discipline that has
attracted major interest recently. This disci-
pline assumes that the historical information
about a process stored in information
systems can be found in a dataset, known as
an event log [4]. This event log contains past
information about the activities that were
performed in each step of the process, where
each row of the log is composed of at least
one identifier (id) associated with each indi-
vidual execution of the process, the name of
the activity performed, the timestamp (day
and time when the activity occurred), and,
optionally, additional information like the
person who carried out the activity or other
such information. Additionally, in the
literature [3] an ordered list of activities
invoked by a specific execution of the process
is defined as a trace of the execution.
Currently, one of the problems in process
mining is that the developed algorithms
assume the existence of information relative
to a unique version of the process in the
event log. However, this is often not the case,
which is why applying the process mining
algorithms to these logs leads to fairly
unrepresentative and/or very complicated
results, which contribute little to the job of
analyzing and improving the processes.
2.1. Clustering of the Event Log
To resolve the aforementioned problems in
process mining, clustering techniques have
been proposed for dividing the event log
before the process mining techniques are
applied [5]. This would consist of dividing
the event log into homogenous clusters; in
order to later apply the process mining
techniques independently to each cluster
and thus obtaining more representative
models. Figure 1 shows the stage of log
preprocessing and then uses a discovery
technique as an example of a process mining
technique.
To produce this clustering, it is necessary to
define a way of representing the traces, so
that it becomes possible to group them later
according to previously determined criteria
of similarity. There currently exist various
clustering techniques in process mining
[6][3]. The majority of them principally
consider information about the control-flow
of activities. These techniques can be
classified into two categories:
1) Techniques that transform the traces into a
vector space, in which each trace is converted
into a vector. The dividing of the log can be
done using a variety of clustering techniques in
the vector space, like for example: Bag of
activities, K-gram model [6], and Trace
clustering [5]. However, these techniques have
the problem of lacking contextual information,
which some have attempted to correct with the
Trace clustering based on conserved patterns
technique [3].
2) Techniques that operate with the whole
trace. These techniques use metrics of
distance like Levenshtein and Generic Edit
Distance [6], together with standard
clustering techniques, assigning a cost to the
difference between traces.
The existing techniques for both categories,
despite improving clustering through the
creation of structurally similar trace clusters,
Discovery
Event Log Clustering
Cluster A
Cluster B
Model A
Model B
Preprocessing stage of the event log
Discovery
Figure 1. Preprocessing Stage of the Event Log.
Currently, one of the problems in process mining is that
the developed algorithms assume the existence of information relative
to a unique version of the process in the event log](https://image.slidesharecdn.com/nvs2014-digital-141223095805-conversion-gate02/85/Novatica-223-Process-Mining-English-Edition-43-320.jpg)
![41
Process Mining monograph
monograph novática Special English Edition - 2013/2014 Annual Selection of Articles
“
”
do not consider the temporal dimension of
the process’s execution, nor how the process
changes over time.
2.2. The Concept Drift Challenge
In BPM, Concept Drift refers to a situation in
which a process has experienced changes in its
design within an analyzed period (yet the exact
moment in which the changes were produced
is unknown). These changes can be due to a
variety of factors, but are mainly due to the
dynamic nature of the processes [7].
The study of Concept Drift in the area of
process mining has centered on process
changes in the control-flow perspective, and
can be of two kinds, momentary changes or
permanent changes, depending on the
duration of the change.
When changes occur over short and
infrequent periods, they are considered
momentary changes. These changes are also
known in processes jargon as process noise
or process anomalies.
On the other hand, permanent changes occur
over more prolonged periods of time and/or
when a considerable amount of instances is
affected by the changes, which signals
changes in the design process.
Our interest centers on the permanent changes
in the control-flow perspective, which can be
divided into the following four categories:
Sudden Drift: This refers to drastic
changes, meaning the way in which the
process execution changes suddenly from
one moment to the next.
Recurring Drift: When a process suffers
periodicchanges,meaningawayofperforming
the process is repeated again later.
GradualDrift:Thisrefers tochangeswhich
are not drastic, but rather at a moment when
two versions of the process overlap, which
correspondstothetransitionfromoneversion
of the process to another.
Incremental Drift: This is when a process
has small incremental changes. These types
ofchangesaremore frequentinorganizations
that adopt agile BPM methodologies.
To solve the Concept Drift problem, new
approaches have evolved to analyze the
dynamic nature of the processes.
Bose [2] proposes methods to manage
Concept Drift by showing how the process
changes are indirectly reflected in the event log
and that the detection of these changes is
feasible by examining the relationship between
activities. Different metrics have been defined
to measure the relationship between activities.
Based on these metrics, a statistical method
was proposed whose basic idea is to consider
a successive series of values and investigate if
a significant difference between two series
exists. If it does, this would correspond to a
process change.
Stocker [8] also proposes a method to manage
Concept Drift which considers the distances
between pairs of activities of different traces as
a structural feature, in order to generate
chronologically subsequent clusters.
Bose and Stocker’s approaches are limited
to determining the moment in time when the
process changes, and thus center on sudden
changes and leave out other types of changes.
To resolve this, in an earlier article [9] we
proposed an approach that makes use of
clustering techniques to discover the changes
that a process can experience over time, but
without limiting ourselves to one particular
kind of change. In that approach, the
similarity among two traces is defined by the
control-flow information and by the moment
in which each trace begins to operate.
In this article, we present an extension of the
earlier work [9], afterincorporating a new form
of measuring the distance between two traces.
3. Extending Clustering Tech-
niques to Incorporate the Tem-
poral Variable
As was explained in the last section, the
existing approaches fordealing with Concept
Drift are not sufficiently effective at finding
the versions of a process when the process
has undergone different types of changes.
To solve this problem, we look to the Trace
Clustering technique proposed by Bose [3]
and based on conserved patterns, which
allows clustering the event log considering
each trace’s sequence of activities.
Our work is based on this technique and
extends it by incorporating an additional
temporal variable to the other control-flow
variables used for clustering.
3.1. Trace Clustering Based on
Conserved Patterns
The basic idea proposed by Bose [3] is to
consider subsequences of activities that
repeat in multiple traces as feature sets for
the implementation of clustering. Unlike
the K-gram approach that considers
subsequences of fixed size, in this approach
the subsequences can be of different
lengths. When two instances have a
significant number of subsequences in
common, it is assumed that they have
structural similarity and these instances
are assigned to the same cluster.
There are six types of subsequences,
therefore, wewillonlygive aformal definition
of MR, since these are the subsequences
that we used to develop our approach,
however the work could be extended to use
the other subsequences.
Maximal Repeat (MR): A Maximal
Repeat in a sequence T is defined as a
subsequence that occurs in a Maximal Pair
in T. Intuitively, an MR corresponds to a
subsequence of activities that is repeated
more than once in the log.
Table 1 shows an example where existing MR
in a sequence are determined. This technique
constructs a unique sequence starting from the
event log, which is obtained by connecting all
the traces, but with a delimiter placed among
them. Then, the MR definition is applied to
this unique sequence. The set of all MR
discovered in the sequence with more than one
activity, is called a Feature set.
The study of Concept Drift in the area of process mining
has centered on process changes in the control-flow perspective,
and can be of two kinds, momentary changes or
permanent changes, depending on the duration of the change
Sequence Maximal Repeat Feature Set
bbbcd-bbbc-caa {a, b, c, bb, bbbc} {bb, bbbc}
Table 1. Example of Maximal Repeat and Feature Set.](https://image.slidesharecdn.com/nvs2014-digital-141223095805-conversion-gate02/85/Novatica-223-Process-Mining-English-Edition-44-320.jpg)
![42 novática Special English Edition - 2013/2014 Annual Selection of Articles
monograph Process Mining
monograph
“
”
Structural
Features
Time
BC
1BC
CC
AC
CC
AC
Structural
Features
Based on the Feature Set, a matrix is created
that allows the calculation of the distance
between the different traces. Each row of
the matrix corresponds to a trace and each
column corresponds to a feature of the
Feature Set. The values of the matrix
correspond to the number of times that each
feature is found in the various traces (see
Table 2). We will call this matrix the
Structural Features Matrix.
This pattern-based clustering approach uses
"Agglomerative Hierarchical Clustering" as
a clustering technique, with the minimum
variance criterion [15], and using the
Euclidian distance to measure the difference
between two traces, defined in as follows:
n
1i
2
BiAi )T-(T=B)(A,dist
Where
dist (A, B) = distance between trace A and
trace B.
n = number of features in de Feature Set.
TAi
= number of times de feature in the
appears in the trace A.
3. 2. Clu ste rin g T ech nique to
Include the Temporal Variable
To identify the various types of changes that
can occur in business processes we must
find a way to identify all the versions of a
process. If we only look at the structural
features (control-flow) then we leave out
informationregardingtemporality. Bothtem-
poraland structuralfeaturesare veryimportant
since the structure indicates how similar one
instance is to another and the temporality
shows how close in time the two instances are.
Our approach looks to identify the different
forms of implementing the process using both
features (structural and temporal) at the same
time, as is illustrated in Figure 2.
In order to mitigate the effects of external
factors that are difficult to control, we use
only the beginning of each process instance
as the temporal variable.
For each trace, we store the time that have
elapsed since a reference timestamp in the
time dimension, for example, the number of
days (or hours, minutes or seconds, depending
on the process) elapsed since January 1st,
1970, to the timestamp in which the trace’s
first activity begins (see Table 3).
In this new approach, "Agglomerative
Hierarchical Clustering" with the minimum
variance criterion [15] is also used as a
clustering technique.
To calculate the distance between two tra-
ces we use the Euclidian distance, but
modified in order to consider at the same
time the structural and temporal features.
First, we define JiT as the feature i of the
trace J. If the feature i cannot be found in the
trace J, its value will be 0, otherwise its value
will be the number of times that the feature
i appears in the trace J.
)1( nJT corresponds to the temporal feature
of the trace J and its value is the number of
days (or hours, minutes or seconds,
depending on the process) that have
elapsed since a reference timestamp. The
index (n+1) is given to indicate that it is to
be added to the structural features.
We define L as the set of all the log traces,
and the expression )( JiLJ TMax represents
the largest number of times the feature i
appears in an event log trace. In the same
way, )( JiLJ TMin corresponds to the
smallest numberof timesthefeature iappears
in an event log trace.
)( )1( nJLJ TMin and )( )1( nJLJ TMax
correspond to the earliest and latest time in
which an event log trace begin. Also we
define ),( BADE
and ),( BADT
as the
structural and temporal distance between
the trace A and the trace B, respectively.
The basic idea proposed by Bose is to consider
subsequences of activities that repeat in multiple traces
as feature sets for the implementation of clustering
Figure 2. Example of the Relevance of Considering Time in the Analysis.
Trace Feature set bb bbbc
bbbcd 2 1
bbbc 2 1
caa 0 0
Table 2. Structural Features Matrix.
where:
n=numberoffeaturesfromtheStructuralFeaturesSet.
Even though both distances, ED and TD are
normalized,sincethedomainof ED is greater
than the one of TD , we define MinE
, MaxE
,
MinT
and MaxT
as:
n
i Ji
LJ
Ji
LJ
BiAi
E
TT
TT
BAD
1
2
)(min)(max
),(
2
)1()1(
)1()1(
)(min)(max
),(
nJ
LJ
nJ
LJ
nBnA
T
TT
TT
BAD](https://image.slidesharecdn.com/nvs2014-digital-141223095805-conversion-gate02/85/Novatica-223-Process-Mining-English-Edition-45-320.jpg)
![43
Process Mining monograph
monograph novática Special English Edition - 2013/2014 Annual Selection of Articles
Base approach: Trace clustering based
on conserved patterns.
Our approach: Extended trace clustering,
where the temporal dimension is incorporated.
In this technique, the weight of the temporal
dimension,, can be given different values,
which vary between 0 and 1.
3) Foreach of the clusters adiscoveryprocess
is carried out, generating two new models
( BA MandM ).
The approach’s performance can be
measured at two points:
a) Conformance 1: The metrics are measured
between any of the original models and one of
the generated clusters.
b) Conformance 2: Metrics are measured
between any of the original models and one of
the generated models.
The metrics used to measure Conformance
1 are the following:
Accuracy: Indicates the number of
instances correctly classified in each clus-
ter, according to what is known about the
original events log. These values are between
0% and 100%, where 100% indicates that the
clustering was exact.
Fitness: Indicates how much of the
observed behavior in an event log, (for
example, cluster AC ) is captured by the
original process model (for example, model
2M ) [12]. These values are between 0 and 1,
where 1 means the model is capable of
representing all the log traces.
Precision: Quantifies whether the ori-
ginal model allows for behavior completely
unrelated to what is seen in the event log.
These values are between 0 and 1, where 1
means that the model does not allow
behavior additional to what the traces
indicate [13].
The metrics used to measure Conformance
2 are the following [14]:
Behavioral Precision ( PB )
Structural Precision ( PS )
Behavioral Recall ( RB )
Structural Recall ( RS )
These metrics quantify the precision and
generality of one model with respect to
another. The values of these four metrics
are between 0 and 1, where 1 is the best
possible value.
Table 4 summarizes the results of applying
the base approach and the new approach
(varying the value of the parameter µ), to the
different synthetic event logs created. This
table shows the accuracy metric, which
indicates the percentage of correctly
classified traces.
For each log, the highest accuracy is reached
withour approach,but withdifferent µ values
(varying between 0.2 and 0.9). The accuracy
varies with different µ values because in
each log the relevance of the temporal
dimension versus the structure of the process
is not the same.
We use Log (f) to make a more in-depth
analysis of the results, measuring all the
metrics defined both in Conformance 1 and
Conformance 2 (see Table 5).
All metrics calculated for Log (f) show good
results when the parameter µ has a value of
0.5or0.6. Whenthefive metricsare averaged,
the highest overall average is obtained with
µ equal to 0.5.
5. Conclusions and Future Work
In this article we present the limitations of
current clustering techniques for process
mining, whichcenterongrouping structurally
similar executions of a process. By focusing
just on the structure of the executions, the
process’s evolution over time (Concept
Drift) is left out. New techniques have been
developed to address this, but these also
present limitations since they focus on
finding the points in which the process
changes, which is limited to just one kind of
change, Sudden Drift.
We present an approach that extends
current clustering techniques in order to
find the different versions of a process
that changes overt time (in multiple ways,
i.e., different types of Concept Drifts),
allowing for a better understanding of the
variations that occur in the process and
how, in practice, it is truly being performed
over time.
Our work focuses on the identification of
models associated with each version of the
process. The technique we propose is a tool
that helps business managers to make
decisions. For example, it can help determi-
ne if the changes produced in the implement-
ation of the process are really those that are
expected, and based on this, take the proper
action if they discover abnormal behaviors.
Also, by understanding and comparing the
different versions of a process, good and bad
practices can be identified, which are highly
useful when the time comes to improve or
standardize the process.
In this document we present a set of metrics to
measure the performance of our approach, i.e.,
whether the approach is able to cluster data in
the same way the data was created. Thus, these
metrics require a priori process information,
which is not feasible for real cases.
Each metric measures a different aspect,
which when used together, allow for a multi-
MinE
and EMax correspond to the minimum
andmaximum(normalized)distance between
alltraces,consideringonlystructuralfeatures.
MinT
and MaxT
correspond to the minimum
andmaximum(normalized)distance between
alltraces,considering onlytemporal features.
Thenewwayofmeasuringthedistancebetween
two traces, ),( BAdist , incorporates the
parameter µ, which we will call the weight of
the temporal dimension, which serves to weigh
the structural and temporal features.
Additionally, this new way of measuring the
distance adjusts ED and TD in such a way that
the weight of both distances are equivalent.
EE
EE
MinMax
MinBAD
BAdist
),(
)1(),(
The weight of the temporal dimension, ,
can have values between 0 and 1, according
to the relevance given to the temporal
feature.
4. Evaluation
We analyzed the proposed technique using
six event logs obtained from different
synthetic processes, which were created with
CPN Tools [10][11]. In order to measure
their performance we used the Guide Tree
Miner plug-in [3] available in ProM 6.1 as
well as a modified version of this plug-in that
incorporates the proposed changes.
Theevaluationwascarriedoutusingdifferent
metrics to measure the new approach’s
classification effectiveness versus the base
approach.
4.1. Experiments and Results
Figure 3 shows the sequence of steps
performed in the experiments.
1) To create the synthetic log, a simulation
was used based on two designed models, M1
and M2, using CPN Tools.
2) The method startsby applying the clustering
technique on the synthetic log received, which
generates a given number of clusters. In this
case, two clusters ( BA CandC ). Two
clustering techniques are applied:
TT
TT
MinMax
MinBAD
),(
](https://image.slidesharecdn.com/nvs2014-digital-141223095805-conversion-gate02/85/Novatica-223-Process-Mining-English-Edition-46-320.jpg)
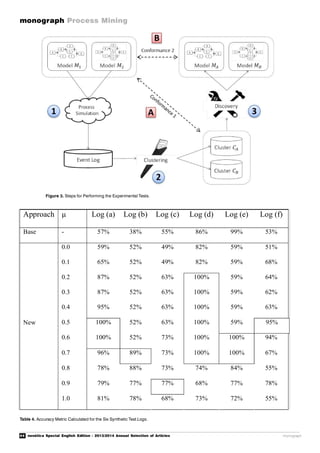
![46 novática Special English Edition - 2013/2014 Annual Selection of Articles
monograph Process Mining
monograph
References
[1] W. van der Aalst. Process Mining, Discovery,
ConformanceandEnhancementofBusinessProcesses.
Springer,2011.ISBN978-3-642-19345-3.
[2] R.J. Bose, W. van der Aalst, I. Zliobaite, M.
Pechenizkiy. Handling Concept Drift in Process
Mining.23rd InternationalConferenceonAdvanced
InformationSystemsEngineering.London,2011.
[3] R. Bose, W. van der Aalst. Trace Clustering
Based on Conserved Patterns : Towards Achieving
Better Process Models. Business Process
ManagementWorkshops,pp.170-181,2010.Berlin:
SpringerHeidelberg.
[4] W. van der Aalst, B. van Dongen, J. Herbst, L.
Maruster,G.Schimm,A.Weijters.Data&Knowledge
Engineering,pp.237-267,2003.
[5] M. Song, C. Günther, W. van der Aalst. Trace
Clustering in ProcessMining.4thWorkshoponBu-
siness Process Intelligence(BPI 08), pp. 109-120.
Milano, 2009.
[6]R.Bose,W.vander Aalst.ContextAware Trace
Clustering: Towards Improving Process Mining
Results. SIAM,pp.401-412,2009.
[7] W.van der Aalst,A.Adriansyah, A.K. Alves de
Medeiros,F.Arcieri,T.Baier,T.Blickleetal.Process
MiningManifesto,2011.
[8] T. Stocker. Time-based Trace Clustering for
Evolution-awareSecurityAudits.Proceedingsofthe
BPM Workshop on Workflow Security Audit and
Certification,pp.471-476.Clermont-Ferrand,2011.
[9] D. Luengo, M. Sepúlveda. Applying Clustering in
ProcessMiningtofinddifferentversionsofabusiness
process that changes over time. Lecture Notes in
BusinessInformationProcessing,pp.153-158,2011.
[10]A.V.Ratzer,L.Wells,H.M.Lassen,M.Laursen,
J. Frank,M.S. Stissing et al. CPNToolsfor editing,
simulating, and analysing coloured Petri nets.
Proceedingsofthe24thinternationalconferenceon
Applications and theory of Petri nets pp. 450-462.
Eindhoven:Springer-Verlag,2003.
[11] A.K. Alves De Medeiros, C.Günther.Process
Mining: Using CPN Tools to Create Test Logs for
MiningAlgorithms.ProceedingsoftheSixthWorkshop
andTutorial onPractical Use ofColoured Petri Nets
andthe CPNTools,pp. 177–190,2005.
[12] A. Rozinat, W. van der Aalst. Conformance
testing: Measuring the fit and appropriateness of
event logs and process models. Business Process
ManagementWorkshops,pp.163-176,2006.
[13] J. Muñoz-Gama, J. Carmona. A fresh look at
precision in process conformance. Proceeding
BPM’10, Proceedings of the 8th international
conferenceon Businessprocessmanagement,pp.
211-226,2010.
[14]A.Rozinat,A.K.AlvesDeMedeiros,C.Günther,
A.Weijters,W.vanderAalst.TowardsanEvaluation
FrameworkforProcessMiningAlgorithms.Genetics,
2007.
[15] J.Ward. HierarchicalGrouping to Optimize an
Objective Function. Journal of the American
StatisticalAssociation,pp.236-244,1963.
](https://image.slidesharecdn.com/nvs2014-digital-141223095805-conversion-gate02/85/Novatica-223-Process-Mining-English-Edition-49-320.jpg)

Novática is the oldest Spanish periodical focused on information and communication technology, published by the Association of Computer Technicians (ATI) since 1975. The document highlights its goals for internationalization, member services, communication, sustainability, professionalism, and networking following recent organizational changes. It also emphasizes the importance of process mining as a transformative approach for managing digital information overload in business.


![[FREE PDF sample] Proceedings of International Conference on ICT for Sustaina...](https://cdn.slidesharecdn.com/ss_thumbnails/5337-240807021736-f7404ce9-thumbnail.jpg?width=640&height=640&fit=bounds)


![[DSC Europe 25] Andrzej Kowalczyk - AI - how to start small and grow in the f...](https://cdn.slidesharecdn.com/ss_thumbnails/oy1zmo94qv6vpcqjvno2-andrzej-kowalczyk-ai-how-to-start-small-and-grow-in-the-future-1-260119121559-cf093b23-thumbnail.jpg?width=640&height=640&fit=bounds)


![[DSC Europe 25] Srba Markovic - From Pilot to Production: Overcoming AI Deplo...](https://cdn.slidesharecdn.com/ss_thumbnails/yjjmrtytmwbalxlba7px-4-srba-markovic-from-pilot-to-production-overcoming-ai-deployment-blockers-with-260114111931-4a892d44-thumbnail.jpg?width=640&height=640&fit=bounds)
![[DSC Europe 25] Elena Menshikova - AI-Powered Operational Excellence: Revolut...](https://cdn.slidesharecdn.com/ss_thumbnails/es6nholbqy3zaao2c2yd-2-elena-menshikova-data-ai-in-decision-making-260115093812-4fba8b38-thumbnail.jpg?width=640&height=640&fit=bounds)
![[DSC Europe 25] Slobodan Dolinic - Smart and Intelligent Green Region.pptx](https://cdn.slidesharecdn.com/ss_thumbnails/0bribinjsp6ghwtvsvor-2-sigre-slobodan-dolinic-260115093812-c9c10e90-thumbnail.jpg?width=640&height=640&fit=bounds)
![[DSC Europe 25] Stefan Brankovic - #ResumeIsDead. AI-Powered Interviews and C...](https://cdn.slidesharecdn.com/ss_thumbnails/qnmbsv0xq3uysdrq3sev-2-stefan-brankovic-job-bolt-260114111931-a065aa3d-thumbnail.jpg?width=640&height=640&fit=bounds)


![[DSC Europe 25] Ivica Milaric - The Future of Gaming and AI Tools.pptx](https://cdn.slidesharecdn.com/ss_thumbnails/tijgzsmgse2kj2y5pzzp-5-ivica-milaric-the-future-of-gaming-x-ai-tools-260114111931-87c2b3ac-thumbnail.jpg?width=640&height=640&fit=bounds)


