Notes 3 - Smith chart examples.pptx for electrical engineers
1.
1
Prof. David R.Jackson
Dept. of ECE
Notes 3
ECE 5317-6351
Microwave Engineering
Fall 2011
Smith Chart
Examples
2.
2
0 50
100 50
L
Z
Zj
I(-d)
V(-d)
+
d
ZL
-
0,
Z
Find Z(-d)
/ 1/ 4, 3/ 8, 1/ 2
g
d
at
,
0
2 1
L
L n
Z
Z j
Z
/ 4
0.4 0.2
/ 4 20 10
g
n
g
d
Z j
Z j
n
L
Z
3/ 8 g
d
/ 4
g
d
a
b
0
1/ 2 g
d
or
Example 1
a
Impedance chart
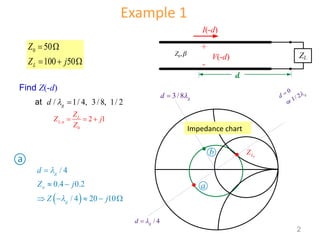
3.
3
3/ 8
0.50.5
3/8 25 25
g
n
g
d
Z j
Z j
b
/ 2
2 1
/ 2 100 50
g
n
g
d
Z j
Z j
c
n
L
Z
3/ 8 g
d
/ 4
g
d
a
b
0
/ 2
g
d
0.087lg
c
0.5lg
0.462lg
0.212lg
Example 1 (cont.)
I(-d)
V(-d)
+
d
ZL
-
0,
Z
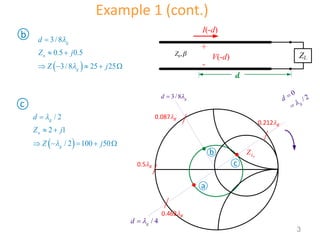
4.
4
0 0
5020mS
8mS 4mS
L
Z Y
Y j
Find Y(-d)
/ 1/ 4, 3/ 8, 1/ 2
g
d
at
,
0
0.4 0.2
L
L n
Y
Y j
Y
/ 4
2 1
/ 4 40mS 20mS
g
n
g
d
Y j
Y j
n
L
Y
3/ 8 g
d
/ 4
g
d
a
b
0
1/ 2 g
d
or
c
Example 2
a
I(-d)
V(-d)
+
d
ZL
-
0,
Z
Admittance chart
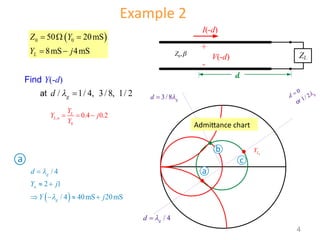
5.
5
3/ 8
11
3/8 20mS 20mS
g
n
g
d
Y j
Y j
/ 2
0.4 0.2
/ 2 8mS 4mS
g
n
g
d
Y j
Y j
Example 2 (cont.)
b
c
I(-d)
V(-d)
+
d
ZL
-
0,
Z
n
L
Y
3/ 8 g
d
/ 4
g
d
a
b
0
1/ 2 g
d
c
Admittance chart
6.
6
Simple answer:
* Whenadding elements in series use Z-chart
* When adding elements in parallel use Y-chart
A B C
Z Z Z
A B C
Y Y Y
ZA ZB ZC
YA YB YC
Which Chart to Use?
7.
7
Use reactivelyloaded section of
transmission line.
most common to use open or short load
d
ZL
0 ,
Z
Z d
L L
Z jX
L
X
0
L
X
SC OC
d
d = 0
n
L
X
n
X d
Non-absorbing load
(RL
= 0)
Using Reactive Loads
Impedance chart
Reactance
8.
8
d
YL
0 ,
Z
Y d
L L
Y j
SC OC
d
d = 0
n
L
Y
n
Y d
Susceptance
0
0
/
n
n
Y d Y d Y
Y d Z
Using Reactive Loads (cont.)
Admittance chart
9.
9
Use a short-circuitedsection of air-filled TEM, 50 transmission line
( = k0, g =0) to create an impedance of Zin = -j25 at f = 10 GHz.
SC
-1/2
0.426 g
50W
0 g
L
25
in
Z j
SC
50 Ω , k0
,
25
1/ 2
50
in n
Z j j
0.426 0 0.426
g g g
L
Example 3
L = 1.28 cm
0
0 0 0
2 2
c
f k
0 3.0 cm
Impedance chart
10.
10
Use an opencircuited section of 75 (Y0 = 1/75 S) air-filled
transmission line at f = 10 GHz to create an admittance of
j1
1/75 S
OC
L
L
1/ 75
in
Y j
OC
75 Ω , k0
, 1
in n
Y j
0
1
75
Y
1
S 13.3mS
75
in
Y j j
0.375cm
L
Example 4
0
0.125
L
0 3.0 cm
Admittance chart
11.
11
Y0
d
1
n
jb
,
A n
Y
,
Ln
Y
1
n
G
,
in in
Z Y d
ZL
YS
A
Y
0
Z
0
in
Z Z
,
,
0 0 ,
1
L
L n
L
L n
L n
Y
Y
Y Z
Z
Z
Z
, , ,
in n A n S n
Y Y Y
Note: At d we have
Want to pick d and Ys such that Yin = Y0.
0
0
1
Y
Z
Matching Circuit
Admittance chart
12.
12
,
S n n
Yjb
, ,
1 1 n S n
in n Y
Y jb
We want
Choose
0
,
0
1
1 1
in n n n
in
in
in
Y jb b
Y
j
Y Y
Z Z
,
in in
Z Y d
ZL
YS
A
Y
0
Z
Y0
d
1
n
jb
,
A n
Y
,
L n
Y
1
n
G
Matching Circuit (cont.)
Admittance chart
13.
13
Example 5
ZL
Z0
ls
Z0s
d
0 50[]
Z
100 100 [ ]
L
Z j
, 2 2
L n
Z j
,
1
0.25 .25
2 2
L n
Y j
j
/6 o
0.62 0.62 30
j
L e
0
0
1
1
L Ln
L
L Ln
Z Z Z
Z Z Z
In this example we will
use the “usual” Smith
chart, but as an
admittance calculator.
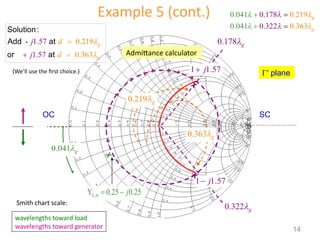
14.
14
Example 5 (cont.)
X
X
0.178g
,
Y 0.25 0. 5
2
L n j
1 1.57
j
1 1.57
j
0.322 g
0.363 g
0.219 g
0.041 g
X
0.219
-
0.36
1.57
1.57 3
g
g
d
d
j
j
Solution:
Add at
or at
0.17
0 0.2
.0 9
8
1 1
4 g
0.32
0 0.3
.0 3
2
1 6
4 g
wavelengths toward load
wavelengths toward generator
Smith chart scale:
Admittance calculator
plane
SC
OC
(We’ll use the first choice.)
15.
15
Example 5 (cont.)
S/ C
X
0 1.57
j
0.09
O / C
Admittance calculator
, cot
1.57 cot
1
cot 1.57; tan
1.57
2
0.567 [radians]
s n
B l
l
l l
l l
0.09
s g
l
From the Smith chart:
0.0903
s g
l
Analytically:
16.
16
0
0
0
tan
tan
L T
in T
TL
Z jZ
Z Z
Z jZ
2
/ 4
4 2
g
g
g
2
0
1
2
0
T
in
L
T in L
Z
Z
Z
Z Z Z
0
1
2
0 0
in
T L
Z Z
Z Z Z
ZL
Z0 Z0T
Zin, Gin
ZL is real
/ 4
g
Quarter-Wave Transformer
At f0 :
For in = 0
17.
17
Match 100 load to 50 transmission Line at f0.
0 100 50
70.7
T
Z
0
0
0
0
2 2 2
g f
r r
f
k k
Example 6
0 70.7
T
Z
1
r
b, 50 Ω Z0T
/ 4
g
100 Ω


![13
Example 5
ZL
Z0
ls
Z0s
d
0 50[ ]
Z
100 100 [ ]
L
Z j
, 2 2
L n
Z j
,
1
0.25 .25
2 2
L n
Y j
j
/6 o
0.62 0.62 30
j
L e
0
0
1
1
L Ln
L
L Ln
Z Z Z
Z Z Z
In this example we will
use the “usual” Smith
chart, but as an
admittance calculator.](https://image.slidesharecdn.com/notes3-smithchartexamples-250323015218-dd76f8c3/85/Notes-3-Smith-chart-examples-pptx-for-electrical-engineers-13-320.jpg)
![15
Example 5 (cont.)
S / C
X
0 1.57
j
0.09
O / C
Admittance calculator
, cot
1.57 cot
1
cot 1.57; tan
1.57
2
0.567 [radians]
s n
B l
l
l l
l l
0.09
s g
l
From the Smith chart:
0.0903
s g
l
Analytically:](https://image.slidesharecdn.com/notes3-smithchartexamples-250323015218-dd76f8c3/85/Notes-3-Smith-chart-examples-pptx-for-electrical-engineers-15-320.jpg)


![RF Circuit Design - [Ch2-2] Smith Chart](https://cdn.slidesharecdn.com/ss_thumbnails/ch2-2-150613064401-lva1-app6891-thumbnail.jpg?width=640&height=640&fit=bounds)