Downloaded 32 times
![“We're going to continue to deepen
our trilateral cooperation in this hemisphere
and around the world. And, in short, we're
going to do more to speak with one, united
North American voice on the world stage [...]
I'm confident that we're going to continue
to advance regional copperation and
integration, and that's not just going to be good
for our own people, that will be good for
the world, as well.”
Barack Obama
NALS, 2016
“It's gratifying that once again
we are able to come together as
leaders of three truly great nations
to honor that enduring friendship and
to once again deliver real results for the
people of Canada, Mexico, the United States
and, indeed, the entire global community.”
Justin Trudeau
NALS, 2016
“The North American Leaders Summit bears witness
that isolated national efforts are insufficient. If we
want favorable results for the benefit of our societies,
it is better to work together as a region. We all know
these global challenges -- isolationism is not the
solution. In contrast, with what happens in other
corners of the world, the countries in North America,
we have decided to be closer, to work as a team, and
to complement each other and to make progress
together as the most competitive region
in the world.”
Enrique Peña Nieto
NALS, 2016
THE LEADERS’ PERSPECTIVE](https://image.slidesharecdn.com/northamericaengsep16-161009011630/85/North-America-22-320.jpg)

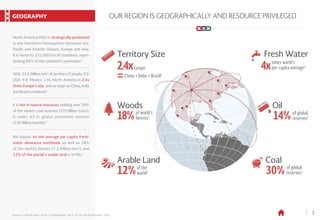
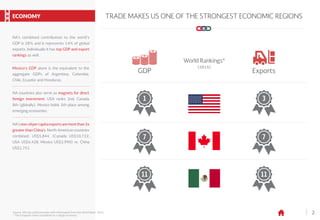
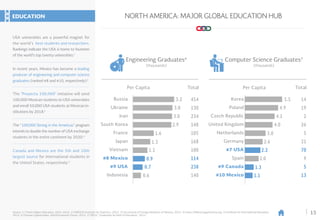
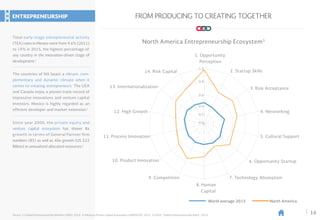
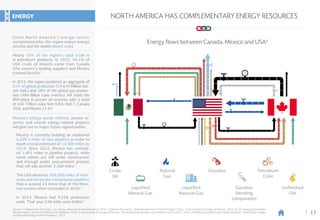
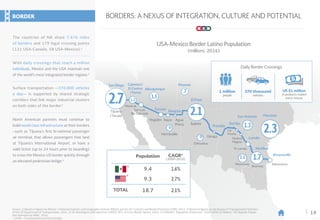
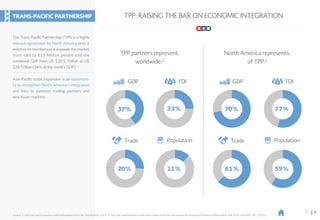
The document outlines the strategic advantages of North America, comprising Canada, the USA, and Mexico, in terms of geography, resources, and economy, highlighting their significant contributions to global trade and the importance of intra-regional collaboration. It details the economic integration achieved through NAFTA, showcasing growth in GDP, trade, and foreign investment, along with the success of key industries such as automotive, aerospace, and agriculture. Additionally, it emphasizes the role of tourism and demographic trends in bolstering economic prospects for the region.