Introduction:-
Karsanbhai startedNirma
• The detergent was phosphate free.
• The packs were handmade.
• They were delivered at the doorstep by Karsanbhai, on his bicycle
while going to his work place, which was 17 km from his home.
• They were sold for Rs. 3 per kg, which was one-third of the then
least priced popular detergents.
• Even at this price, he managed to give a money back guarantee
with every pack that was sold!
• The detergent was environment friendly too.
• The process of detergent production was labor intensive and this
gave employment to a large number of people.
3.
In theearly 1970s, when Nirma washing
powder was introduced in the low-income
market.
That time there was very few detergent
brand. They were MNCs like HLL (surf)
Starting as a one-product one-man outfit
in Nirma became a Rs 17 billion
company within three decades.
In 2008, Nirma had a 15% share in the
toilet soap segment and more than 30%
share in the detergent market.
4.
Nirma Ltd:-
Nirmais one of the most recognizable Indian brands
Nirma has about 14, 000 employee-base and annual
turnover of more than Rs. 25, 00 crores
Nirma rewrote the marking rules and its success story
became one of the widely discussed case studies in the B-
schools across the world
Today, Nirma has one of the largest volume sales with a
single brand name in the world
In 2004, Nirma's annual sales touched 800,000 tones.
Though it has been declining since then
5.
Detergent War
1980'sSurf suffered huge losses at the hands of
Nirma Chemicals
It evicted HUL's Surf from the No. 1 position in 1985
HUL then came up with lower priced Wheel (green)
and Rin (blue) detergent powders targeted at
different market segments
In 1987, Ghari was launched by RSPL (Rohit
Surfactancts Pvt. Ltd.)
In late 2011 and early 2012, Ghari beats Wheel and
takes the numero-uno spot in Indian detergent industry.
6.
Currently, Ghariis
the market leader
with a market share
of 17.3%, Wheel is
at number 2 with a
share of 16.9%,
Tide is 3rd with a
market share of
13.5%. Nirma has
market share of less
than 6% now
7.
Products:-
Industrial
LAB (Linear Alkyl Benzene )
AOS ( Alfa Olefin Sulfonate )
Sulfuric Acid
Glycerin
Soda Ash
Pure salt
Vacuum Evaporated Iodized Salt
SSP- Single Super Phosphate
Sodium silicate
Supply Chain ofNirma
Nirma Limited markets its products through its fully owned subsidiary
Nirma Consumer Care Limited (NCCL), which was incepted in 1985.
NCCL in turn resells these products in the market under the umbrella
brands “NIRMA” and “NIMA” along with extensions.
Operates with two parallel distribution networks
Principal Channel [Nirma Products]:
Lowest Cost system in India
Speed in distribution
Flexibility
Parallel Channel [Nima Products]:
Wider Reach
Speedy Market Intelligence
Competitive edge & Better focus
Complementing Principal Channel
10.
Nirma’s SWOTAnalysis
Strengths:
Market leadership in detergents and fabric wash and
second largest player in toilet soaps. Company has Wide
distribution network.
Weakness:
High interest burden. Less presence in premium segment.
Lacks global tie-ups and thus finding it hard to tap export
markets.
Opportunities: Acquisitions for strengthening its distribution
tie-ups.
Threats: MNCs coming, to India particularly in Toilet and
Soap industry. Emergence of small but strong regional
players.
12.
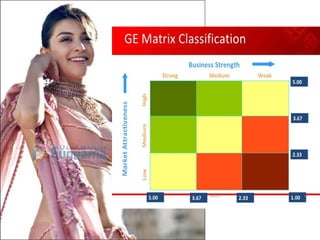
Business UnitStrength
The horizontal axis of the GE / McKinsey matrix is
the strength of the business unit. Some factors
that can be used to determine business unit
strength include:
• Market share
• Growth in market share
• Brand equity
• Distribution channel access
• Production capacity
• Profit margins relative to competitors
13.
Industry Attractiveness
The verticalaxis of the GE / McKinsey
matrix is industry attractiveness, which is
determined by factors such as the
following:
•Market growth rate
•Market size
•Demand variability
•Industry profitability
•Industry rivalry
•Global opportunities
•Macroenvironmental factors (PEST)

![Supply Chain of Nirma
Nirma Limited markets its products through its fully owned subsidiary
Nirma Consumer Care Limited (NCCL), which was incepted in 1985.
NCCL in turn resells these products in the market under the umbrella
brands “NIRMA” and “NIMA” along with extensions.
Operates with two parallel distribution networks
Principal Channel [Nirma Products]:
Lowest Cost system in India
Speed in distribution
Flexibility
Parallel Channel [Nima Products]:
Wider Reach
Speedy Market Intelligence
Competitive edge & Better focus
Complementing Principal Channel](https://image.slidesharecdn.com/nirma-pptsubjectnirmapresentation-250329063024-a30df19f/85/nirma-ppt_Subject-nirma-presentation-pptx-9-320.jpg)


![Since 1969 [autosaved]](https://cdn.slidesharecdn.com/ss_thumbnails/since1969autosaved-191204141637-thumbnail.jpg?width=640&height=640&fit=bounds)


