Downloaded 13 times


![Python scripting in undodb-gdb and gdb.
repeat_until_breakpoint.py
'''
Repeatedly run debuggee until it hits a breakpoint.
'''
import gdb
events = []
def event_handler( event):
events.append( event)
gdb.events.exited.connect( event_handler)
gdb.events.stop.connect( event_handler)
while 1:
print '-' * 40
events = []
gdb.execute( 'run')
breakpoint = None
for event in events:
if isinstance( event, gdb.BreakpointEvent):
breakpoint = event
break
if breakpoint:
print( 'have hit breakpoint: %s' % breakpoint)
break](https://image.slidesharecdn.com/undo-slides-meetingcpp-170113112959/85/Next-Generation-Debugging-12-320.jpg)
![Python scripting in undodb-gdb and gdb.
repeat_until_signal.py
'''
Repeatedly run debuggee until it receives SIGSEGV.
'''
import gdb
import signal
events = []
def event_handler( event):
events.append( event)
gdb.events.exited.connect( event_handler)
gdb.events.stop.connect( event_handler)
while 1:
print '-' * 40
events = []
gdb.execute( 'run')
breakpoint = None
for event in events:
if ( isinstance( event, gdb.SignalEvent)
and event.stop_signal == 'SIGSEGV'
):
breakpoint = event
break
if breakpoint:
print( 'have hit breakpoint: %s' % breakpoint.stop_signal)
break](https://image.slidesharecdn.com/undo-slides-meetingcpp-170113112959/85/Next-Generation-Debugging-13-320.jpg)


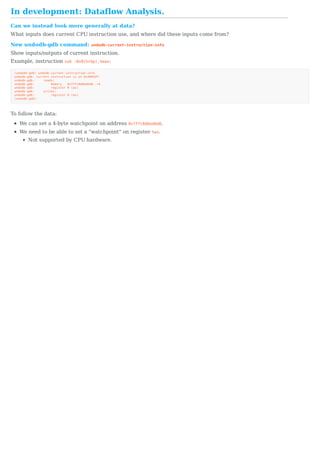
![Strace.
Linux/unix-specific.
Get a detailed log of all syscalls.
> strace date
execve("/bin/date", ["date"], [/* 34 vars */]) = 0
brk(0) = 0xd50000
access("/etc/ld.so.nohwcap", F_OK) = -1 ENOENT (No such file or directory)
mmap(NULL, 8192, PROT_READ|PROT_WRITE, MAP_PRIVATE|MAP_ANONYMOUS, -1, 0) = 0x7f7602059000
access("/etc/ld.so.preload", R_OK) = -1 ENOENT (No such file or directory)
open("/etc/ld.so.cache", O_RDONLY|O_CLOEXEC) = 3</etc/ld.so.cache>
fstat(3</etc/ld.so.cache>, {st_mode=S_IFREG|0644, st_size=144491, ...}) = 0
mmap(NULL, 144491, PROT_READ, MAP_PRIVATE, 3</etc/ld.so.cache>, 0) = 0x7f7602035000
close(3</etc/ld.so.cache>) = 0
access("/etc/ld.so.nohwcap", F_OK) = -1 ENOENT (No such file or directory)
open("/lib/x86_64-linux-gnu/libc.so.6", O_RDONLY|O_CLOEXEC) = 3</lib/x86_64-linux-gnu/libc-2.19.so>
read(3</lib/x86_64-linux-gnu/libc-2.19.so>, "177ELF21130000000030>01000P34200000"..., 832) = 832
fstat(3</lib/x86_64-linux-gnu/libc-2.19.so>, {st_mode=S_IFREG|0755, st_size=1738176, ...}) = 0
mmap(NULL, 3844640, PROT_READ|PROT_EXEC, MAP_PRIVATE|MAP_DENYWRITE, 3</lib/x86_64-linux-gnu/libc-2.19.so>, 0) = 0x7f7601a90000
mprotect(0x7f7601c32000, 2093056, PROT_NONE) = 0
mmap(0x7f7601e31000, 24576, PROT_READ|PROT_WRITE, MAP_PRIVATE|MAP_FIXED|MAP_DENYWRITE, 3</lib/x86_64-linux-gnu/libc-2.19.so>, 0x1a1000) =
0x7f7601e31000
mmap(0x7f7601e37000, 14880, PROT_READ|PROT_WRITE, MAP_PRIVATE|MAP_FIXED|MAP_ANONYMOUS, -1, 0) = 0x7f7601e37000
close(3</lib/x86_64-linux-gnu/libc-2.19.so>) = 0
mmap(NULL, 4096, PROT_READ|PROT_WRITE, MAP_PRIVATE|MAP_ANONYMOUS, -1, 0) = 0x7f7602034000
mmap(NULL, 4096, PROT_READ|PROT_WRITE, MAP_PRIVATE|MAP_ANONYMOUS, -1, 0) = 0x7f7602033000
mmap(NULL, 4096, PROT_READ|PROT_WRITE, MAP_PRIVATE|MAP_ANONYMOUS, -1, 0) = 0x7f7602032000
arch_prctl(ARCH_SET_FS, 0x7f7602033700) = 0
mprotect(0x7f7601e31000, 16384, PROT_READ) = 0
mprotect(0x60e000, 4096, PROT_READ) = 0
mprotect(0x7f760205b000, 4096, PROT_READ) = 0
munmap(0x7f7602035000, 144491) = 0
brk(0) = 0xd50000
brk(0xd71000) = 0xd71000
open("/usr/lib/locale/locale-archive", O_RDONLY|O_CLOEXEC) = 3</usr/lib/locale/locale-archive>
fstat(3</usr/lib/locale/locale-archive>, {st_mode=S_IFREG|0644, st_size=1607760, ...}) = 0
mmap(NULL, 1607760, PROT_READ, MAP_PRIVATE, 3</usr/lib/locale/locale-archive>, 0) = 0x7f7601ea9000
close(3</usr/lib/locale/locale-archive>) = 0
open("/etc/localtime", O_RDONLY|O_CLOEXEC) = 3</etc/localtime>
fstat(3</etc/localtime>, {st_mode=S_IFREG|0644, st_size=3661, ...}) = 0
fstat(3</etc/localtime>, {st_mode=S_IFREG|0644, st_size=3661, ...}) = 0
mmap(NULL, 4096, PROT_READ|PROT_WRITE, MAP_PRIVATE|MAP_ANONYMOUS, -1, 0) = 0x7f7602058000
read(3</etc/localtime>, "TZif2000000000000000000700070000"..., 4096) = 3661
lseek(3</etc/localtime>, -2338, SEEK_CUR) = 1323
read(3</etc/localtime>, "TZif200000000000000000010000100000"..., 4096) = 2338
close(3</etc/localtime>) = 0
munmap(0x7f7602058000, 4096) = 0
fstat(1</dev/pts/50>, {st_mode=S_IFCHR|0620, st_rdev=makedev(136, 50), ...}) = 0
mmap(NULL, 4096, PROT_READ|PROT_WRITE, MAP_PRIVATE|MAP_ANONYMOUS, -1, 0) = 0x7f7602058000
write(1</dev/pts/50>, "Mon 26 Sep 12:27:50 BST 2016n", 29Mon 26 Sep 12:27:50 BST 2016
) = 29
close(1</dev/pts/50>) = 0
munmap(0x7f7602058000, 4096) = 0
close(2</dev/pts/50>) = 0
exit_group(0) = ?
+++ exited with 0 +++
Subset of syscalls - file operations:
> strace -y -e trace=file date
execve("/bin/date", ["date"], [/* 34 vars */]) = 0
access("/etc/ld.so.nohwcap", F_OK) = -1 ENOENT (No such file or directory)
access("/etc/ld.so.preload", R_OK) = -1 ENOENT (No such file or directory)
open("/etc/ld.so.cache", O_RDONLY|O_CLOEXEC) = 3</etc/ld.so.cache>
access("/etc/ld.so.nohwcap", F_OK) = -1 ENOENT (No such file or directory)
open("/lib/x86_64-linux-gnu/libc.so.6", O_RDONLY|O_CLOEXEC) = 3</lib/x86_64-linux-gnu/libc-2.19.so>
open("/usr/lib/locale/locale-archive", O_RDONLY|O_CLOEXEC) = 3</usr/lib/locale/locale-archive>
open("/etc/localtime", O_RDONLY|O_CLOEXEC) = 3</etc/localtime>
Mon 26 Sep 12:29:01 BST 2016
+++ exited with 0 +++
Subset of syscalls - memory operations:
> strace -y -e trace=memory date
brk(0) = 0x25b8000
mmap(NULL, 8192, PROT_READ|PROT_WRITE, MAP_PRIVATE|MAP_ANONYMOUS, -1, 0) = 0x7f14cc871000
mmap(NULL, 144491, PROT_READ, MAP_PRIVATE, 3</etc/ld.so.cache>, 0) = 0x7f14cc84d000
mmap(NULL, 3844640, PROT_READ|PROT_EXEC, MAP_PRIVATE|MAP_DENYWRITE, 3</lib/x86_64-linux-gnu/libc-2.19.so>, 0) = 0x7f14cc2a8000
mprotect(0x7f14cc44a000, 2093056, PROT_NONE) = 0
mmap(0x7f14cc649000, 24576, PROT_READ|PROT_WRITE, MAP_PRIVATE|MAP_FIXED|MAP_DENYWRITE, 3</lib/x86_64-linux-gnu/libc-2.19.so>, 0x1a1000) =
0x7f14cc649000
mmap(0x7f14cc64f000, 14880, PROT_READ|PROT_WRITE, MAP_PRIVATE|MAP_FIXED|MAP_ANONYMOUS, -1, 0) = 0x7f14cc64f000
mmap(NULL, 4096, PROT_READ|PROT_WRITE, MAP_PRIVATE|MAP_ANONYMOUS, -1, 0) = 0x7f14cc84c000
mmap(NULL, 4096, PROT_READ|PROT_WRITE, MAP_PRIVATE|MAP_ANONYMOUS, -1, 0) = 0x7f14cc84b000
mmap(NULL, 4096, PROT_READ|PROT_WRITE, MAP_PRIVATE|MAP_ANONYMOUS, -1, 0) = 0x7f14cc84a000
mprotect(0x7f14cc649000, 16384, PROT_READ) = 0
mprotect(0x60e000, 4096, PROT_READ) = 0
mprotect(0x7f14cc873000, 4096, PROT_READ) = 0
munmap(0x7f14cc84d000, 144491) = 0
brk(0) = 0x25b8000
brk(0x25d9000) = 0x25d9000
mmap(NULL, 1607760, PROT_READ, MAP_PRIVATE, 3</usr/lib/locale/locale-archive>, 0) = 0x7f14cc6c1000
mmap(NULL, 4096, PROT_READ|PROT_WRITE, MAP_PRIVATE|MAP_ANONYMOUS, -1, 0) = 0x7f14cc870000
munmap(0x7f14cc870000, 4096) = 0
mmap(NULL, 4096, PROT_READ|PROT_WRITE, MAP_PRIVATE|MAP_ANONYMOUS, -1, 0) = 0x7f14cc870000
Mon 26 Sep 12:29:40 BST 2016
munmap(0x7f14cc870000, 4096) = 0
+++ exited with 0 +++](https://image.slidesharecdn.com/undo-slides-meetingcpp-170113112959/85/Next-Generation-Debugging-21-320.jpg)


The document covers advanced debugging techniques, focusing on tools like gdb, strace, and valgrind for analyzing and resolving test failures in software development. It discusses the challenges of debugging intermittent failures and emphasizes the importance of scripted debugging using Python in gdb. Additionally, it provides examples of controlling logging levels and capturing system calls to enhance troubleshooting during testing.