Nevada - housing market summary
•
0 likes•12 views

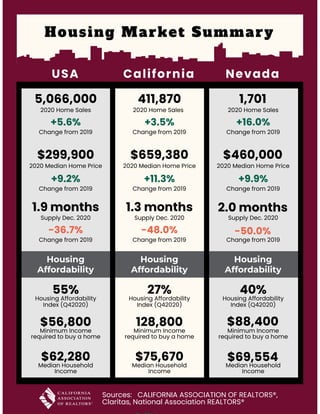
Take a look at these annual side-by-side comparisons to see how your county sales and affordability hold up next to the state and country as a whole. Indicators provided are sales, median prices, supply, and affordability.

Recommended
More Related Content
What's hot
What's hot (19)
Similar to Nevada - housing market summary
Similar to Nevada - housing market summary (20)
More from Lynne Watanabe-MacFarlane
More from Lynne Watanabe-MacFarlane (20)
Recently uploaded
Recently uploaded (17)
Nevada - housing market summary
- 1. Housing Market Summary Housing Affordability Housing Affordability Housing Affordability USA California Nevada 1,701 2020 Home Sales +16.0% Change from 2019 $460,000 2020 Median Home Price +9.9% Change from 2019 2.0 months Supply Dec. 2020 -50.0% Change from 2019 $88,400 Minimum Income required to buy a home 40% Housing Affordability Index (Q42020) $69,554 Median Household Income Sources: CALIFORNIA ASSOCIATION OF REALTORS®, Claritas, National Association REALTORS® 411,870 2020 Home Sales +3.5% Change from 2019 $659,380 2020 Median Home Price +11.3% Change from 2019 1.3 months Supply Dec. 2020 -48.0% Change from 2019 128,800 Minimum Income required to buy a home 27% Housing Affordability Index (Q42020) $75,670 Median Household Income 5,066,000 2020 Home Sales +5.6% Change from 2019 $299,900 2020 Median Home Price +9.2% Change from 2019 1.9 months Supply Dec. 2020 -36.7% Change from 2019 $56,800 Minimum Income required to buy a home 55% Housing Affordability Index (Q42020) $62,280 Median Household Income