Download to read offline
![815
improve detection rate and lower false alert rate in the process of anomaly detection is inherently
operational deployments. limited both inaccuracy and timeliness by the
precision of the measurement system used to gather
The final step in our investigation of KS3’s capabilities is an data.
initial case study in which we asked a network operator to
inspect all of the alerts generated by S3 over a one week A.Instrumentation
period. During this time, KS3 identified 8 anomaly episodes. The fine time scale data used for this study was
The network operator investigated and diagnosed these and collected using a dedicated monitoring machine
determined that all alerts were true positives. This result running Linux 2.4 with an Endace DAG4.3GE
lends important additional support to the utility of our network monitoring card, dual Intel Xeon
approach. processors, and multiple SCSI disks. The monitoring
card was connected to an optical tap on a link from
Insummary, thispapermakesthefollowingcontributions: one of our campus border routers to our primary
More recent work by Barford et al. explores the use of Internetserviceprovider.
wavelets as the basis for detecting anomalies in NetFlow data The one second rate values from NeTraMet were
[5]. The smoothing function used in our detector is similar to continually downloaded from the DAG monitor via
the mid frequency filter developed in that work. That study SNMP (on fifteen second intervals), post-processed
also used an annotated anomaly log as the basis for testing andpushed intoaroundrobin-database(rrd) file.
their detector. Lakina et al. pioneered the use of SNMP and
NetFlow data sets from multiple sites and Principle Once in the database, these rate “signals” could be accessed
Components Analysis (PCA) as the basis for network-wide by our detectors.
anomaly detection [15], [16], [17]. Recent work by Ringberg B.MeasurementData
et al. provides important insights on the difficulties in tuning This enabled us to group the events into the following
network-wide PCA-based detectors in practice [18]. Two categories:
additional studies that describe promising methods for • Abuse: Typically a Denial-of-Service event, usually flood-
network-wide anomaly detection include [6], [19]. Our based. For instance: an outbound flood of UDP packets from
detection method could easily be adapted for use in a a campus host that has had its security compromised and is
network-wide detection framework such as [6]. Finally, a beingremotelycontrolledbyamaliciousparty.
recent reference to singular value decomposition in the • Flash: A flash crowd event. For instance: hundreds of
context of traffic anomaly detection appeared in [20]. The clients outside our campus receiving a live video stream of a
basic formulation of the anomaly detection method sporting event sourced from a server on campus.
described in that work-in-progress differs substantially from Measurement: An anomaly due to legitimate traffic or
ours.The idea of using packet symmetry for the purpose(i) an measurement system failures. For example: a campus host
initial examination of anomaly features that are exposed at participating in TCP bulk data transfer with a host at another
fine time scales, (ii) introduction of a new anomaly detection campusas partofaresearchproject.
method based on multiple complementary signals and a • Network: A network failure event or temporary miss
Bayes Network that is both accurate and timely, and offers configuration resulting in a connectivity problem or outage.
opportunities for site specific tuning and continued For instance: a scheduled code upgrade on our service
refinement, and (iii) Evaluation of the new method along provider’s router.
with two standard methods for anomaly detection in traffic • Unknown:An anomaly for which evidence was found, but
overalongdurationwithanoperatorsupplied.anomalylog the root cause was not identified. Engineers operating the
campus network identified, researched, and tagged events
II. RELATED WORK resulting in a log of 94 confirmed anomalies suitable for
Network anomaly detection has been an active area of evaluatingour detectionmethod.
research for some time. Early efforts were focused on the C. SampleAnomalies
practical problem of network fault detection [7], [8], and in The time series data collected in this study offers an unusual
using time series methods to detect traffic anomalies [9], [4]. perspective even for experienced network
Several studies have shown that entropy-based methods can operators since most. The distribution and counts of these
be effective for anomaly detection [10], [11] including who anomaliesareshown inSect4
use entropy to classify traffic in packet traces taken from an
ISP backbone [12]. The denial of service attack detection
was introduced by Mirkovic et al. in [1].That work identifies
malicious activity if the smoothed ratio of packets sent to
packets received exceeds a simple threshold on a per flow
basis. Kreibich . expand the idea of packet symmetry by
proposing that it be adopted as a principle of protocol design
[2].
III. DATA COLLECTION
Our study is motivated in part by the simple fact that](https://image.slidesharecdn.com/icact143-160531145131/85/Network-Traffic-Anomaly-Detection-Through-Bayes-Net-2-320.jpg)
![816
Fig. 1. Example of a rapid probe of an entire class B network. 48 hour perspective at 5 minute granularity (top), 20
This anomaly is invisible in 5 minute aggregate data. 48 hour minute perspectiveat one second granularity(bottom).
perspective at 5 minute granularity (top), 10 minute
perspectiveatonesecondgranularity. (bottom). During a scheduled network maintenance outage. The top
graph shows the rates as five minute averages over 48 hours;
Networking equipment is not capable of exposing traffic a drop to zero is clearly evident in the mid-point of the graph.
rates in so timely or granular a fashion. These additional (The earlier inbound spike is an unrelated anomaly.) The
features may well serve as a basis for improving detection, or lower graph shows the rate in one second averages over 20
anomalyclassificationinfuturework. minutes; a gradual return of the traffic is evident. Unlike the
Figure 1 shows the inbound and outbound packet rates when prior examples, this event is strongly symmetric with respect
a host in the outside world sent a single 46 byte packet to the to packet rates. This highlights a challenge for a detector
TCPport 512 (the “exec” service) of each IPaddress in one of basedonlyonidentifyingasymmetricchangesintraffic.
our campus’classB networks. Presumablythiswas toelicita
response in preparation to attempt to compromise campus IV. BUILDING A DETECTOR
hosts’ security and is therefore likely malicious abuse of the
network. Our process for building an anomaly detector has
The lower graph shows the rate in one second averages over two steps.
hours; a series of irregularly-sized steps is present, The first is identifying the set of signals whose behavior
suggesting that each of the source hosts began flooding at a can be correlated with anomalous traffic. This step can be
different time, that all three flooded simultaneously, and that decomposed into (i) identifying a time series that can be
thesecondhost wasthelasttoceaseflooding. extracted from the high performance monitors, and (ii)
applying a transformation to this time series that enhances
the wise to develop a detector that is applied to the signal
set to identify anomalies by distinguish “abnormal” from
“normal. Changing in traffic symmetry. While traffic
symmetry may not be asuseful for exposing anomalies on
e.g., core routing
paths, we expect that segments that form gateways
between networks will be good candidates for taking
advantage of this important property. A. From
Measurements to Signals
The measurements we considered in this work –
ingress/egress bit and packet count time series – are
straightforward to produce by passive measurement
and it is well known that changes in these streams
can correlate with important types of anomalies.
While many other time series from packet monitors
may be useful anomalies, we for detecting traffic
Fig. 2.ExampleofaprogressivelymoreintenseUDPflood leave the analysis of these to future work.
anomaly from three hosts: 48 hour perspective at 5 minute 1) First component: smoothness estimator: This
granularity (top), 2 hour perspective at one second component examine
granularity(bottom)rates 2) Each of the ingress/egress packet count time
series, and actually measures the lack of
smoothness (i.e., related to variance) in the
data. This is a standard procedure: first, the
time series is decomposed into a hierarchy of
detail coefficients (via a waveletsmoothness).
Our data is that the four normalized vectors are well
approximated by a 2-dimensional plane. This characteristic
is observable over a wide range of time scales, times of day
and volumes in traffic. While this 2-dimensional
approximate abilityphenomenon may seem surprising at
first, a closer examination of prevailing network
characteristics shows this phenomenon to be the case under
the following realistic assumptions. The first assumption is
that packet count and byte count are dominated, in non
anomalous periods, by large TCP-based flows (so called
elephantflows [22]).
Fig. 3. Example of a network anomaly due to routine
maitaince:](https://image.slidesharecdn.com/icact143-160531145131/85/Network-Traffic-Anomaly-Detection-Through-Bayes-Net-3-320.jpg)
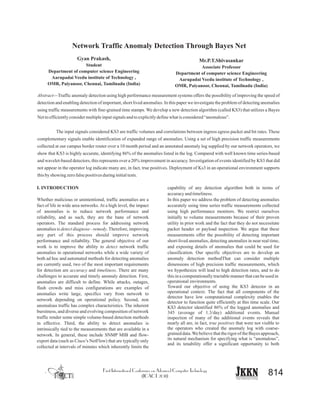
![817
Table-IIThe second assumption is that the outgoing TCP traffic
EVALUATION RESULTS: COUNT OF CANDIDATEduring a short period of time (e.g., 15 minutes) is
ANOMALIES DETECTED BY THE HOLT-WINTERS,homogeneous, i.e., tends to exhibit an almost constant ratio
DEVIATION SCORE, AND S3 METHODS.
between the number of outgoing data packets and the number
of incomingacknowledgmentpackets.
The smoothness of each time series is governed primarily by
the initiation and termination of short lived flows, as well as
by flows that behave erratically. Most of the data volume
does not belong to these flows, and is filtered out by the
wavelet tool. We implemented a detection method that uses
the smoothness and symmetry estimates as input to a Bayes
Network [31]. The Bayes Net method offers a systematic
means for establishing differences between normal and
anomalous behavior with multiple input signals. Bayesian
Networks are a general purpose tool used to infer causal
relationships between multiple random variables. More
specifically, they are graphical models which use directed
acyclicgraph.
We used the MATLAB Bayes Net Toolbox for this portion of
S3.To create a Bayes network of a size that would be suitable
for an operational deployment, we encoded the smoothness
and correlation signals as integer values. The smoothness
signal was reduced to a boolean value while the signals were
encoded as integers ranging from 1 to 4. Specifically, for Serves to influence the S3 detector’s sensitivity to
each 90 minute period in a day, the 5th and 95th percentiles of short-lived events.
the smoothness estimators were found and saved. Values Shorter windows increase the sensitivity. The number of
below the 5th percentile or above the 95th percentile are available wavelet levels is limited by the size of the time
considered “in the tails” and therefore candidates as window. We usually set the number of wavelet levels to be
anomalies. The correlation estimators were organized into 1 approximately log2(WindowSize). The size of the window
of the following 4 categories: [0, 0.7), [0.7 0.8), [0.8, 0.92) shift determines the granularity of the analysis. A list of the
and[0.92,1]. parameters used in the KS3 Bayes Net detector evaluation is
Weekdays of theentire10monthdatawerethusly given in Table I. We plan to investigate automated methods
partitioned and encoded. The encoded data were used to for tuningthedetectorinfuturework.
estimate the six dimensional (empirical) joint distributions
for each of the 90 minute periods. “Normal” behavior is V.DETECTOR EVALUATION
therefore assumed to be the dominant characteristic in the
encoded data. Conversely, “anomalous” behavior is assumed We evaluated S3’s performance and compare its capabilities
to have occurred infrequently, although we do not relativetotwootheranomalydetectiontechniques.
distinguish this in the training data so it is also encoded in the To do this we had to first build and then tune these other
jointdistribution. detectors to operate on fine time scale data.Tuning is a fact of
Table-I life for all statistical anomaly detectors. Our objective in
S3 BAYES NET DETECTOR PARAMETER LIST tuning the detectors used in this study was to identify as
AND SETTINGS USED IN THISSTUDY. many of the ground truth anomalies from the operator’s
journal possible without an explosion in the number of
additional events detected. Our aim in terms of the latter was
to keep the average number of additional events detected on
theorderof 1 to2perdayoverthe266daydataset.
A.Methodology
To evaluate each anomaly detector’s performance,
we matched the anomalies they reported with
anomalies in the operator’s log. To do this, we first
selected a subset of the logged anomalies that
occurred within the time range of our measurement
data. (Some occurred during the two week
measurement outage period.) then, for each
candidateanomaly.
window size 900 Seconds
Wavelet Levels 8 levels
Window Shift 60 seconds
Day Partition Size 90 minutes
Smoothness Partitions 0.05 and 0.95percentiles
Correlation Partitions 0.7, 0.8 and 0.92
Detector Threshold 1e-4
Parameter Description Parameter Value
Value
Anomoly
type
Condida
te Cont
HW
Detecte
d
DS
Detecte
S3
Bayes
Detecte
d
Abuse 76
Flash 2 1(50%) 0(0%) 0 (0%)
Measurement 8 4(50%) 4(50%) 4(50%)
Network 4 2(50%) 1(25%) 4(100%)
Unknown 4 0(0%) 0(0%) 2(50%)
Total 94 61(65%) 59(63%) 81(86%)
54(71%) 54(71%) 71 (93%)](https://image.slidesharecdn.com/icact143-160531145131/85/Network-Traffic-Anomaly-Detection-Through-Bayes-Net-4-320.jpg)
![818
B. KS3 Detector Performance when a spike occurred and the increase was
sustained for minutes. Compounding DS’ false
The right-most column of Table II summarizes the detection positive reports, it produced many spurious alarms in
performance of our KS3 method indicating 86% success in weeks that contained many real spike based
identifying the logged anomalies. The application of each a n o m a l i e s w i t h s i m i l a r m a g n i t u d e .
detector was made in one minute steps, thus an anomaly This accounted for a substantial portion of the DS
might be detected within one minute of its inception. While false negatives. These shortcomings suggest that
the S3 detector performed very well, it did not identify anomaly detectors based solely on smoothness
several symmetric anomalies, such as an exchange of HTTP measures or that rely on periodic normalization may
traffic at a very high rate between a client and server. In each belimitedintheireffectiveness.
case, KS3 signaled a distortion that we believe will be
recognizedby futureversionsofthedetector. F. OnlineS3BayesPerformance
C. Holt-Winters Time Series-based Detector Performance Since the evaluation reported above leaves open the
question of whether the reported events were false
To gain perspective on the capabilities of S3, we tested an positives or merely oversights in the historical
alternative detector which has been shown to perform well operator’s log, we performed an initial near real time
on coarser time scale data: the aberrant behavior detection evaluation of S3. Over five days, January 22 through
tool available in RRD tool. This tool is based on Holt- January 26 2007, we ran the S3 Bayes detector
Winters tri series forecasting and identifies anomalous (trained with a subset of the 10 month data set and
behavior based on a prediction and a confidence band of tuned as described above), and used its reports to
varying width, each of which is influenced by the past values, direct an operator’s attention to anomalous periods
taking into account both seasonal (e.g. daily) variations and of trafficforinvestigationandverification.
recent behavior. RRD tool “FAILURES” RRA had a non-
zero value any time within the given event’s evaluation VI. CONCLUSIONSAND FUTUREWORK
window.
In this paper we investigate the problem of traffic
D. Wavelet-based Detector Performance anomaly detection using traffic measurements at fine
time scales. We develop a new detection algorithm
We also implemented and evaluated the performance of a for this data that considers both changes in volume
Deviation Score (DS) detector. This detector was based on and changes in correlations of ingress and egress
wavelet decomposition of packet count time series as traffic on a link, and raises alerts using a Bayes Net.
described in [5], but configured to detect anomalies at finer We evaluate the capability of our S3 detector on an
time scales. This general method was also shown to perform extensive time series of traffic rates taken at our
very well in [6].After trying several different parameters for campus border router using a high performance
computing the deviation scores, we noted that improving the passive measurement system. Our data set also
detection rate without increasing the total hit count was quite includes a log of actual anomalies that was
difficult. This behavior is similar in some ways to the maintained by our network operations group
smoothness indicato 3We chose a delta value of 5, greater t h r o u g h o u t t h e c o u r s e o f o u r s t u d y .
than the values prescribed by [32] and [4], each of which Our detector also identified a set of events that took
suggest values between 2 and 3, to reduce the number of false place on short time scales but did not appear in the
reports that occurred frequently due to the bursty packet rates set of operator logged anomalies. The configuration
observed when using an interval of one second interval of S3 used in this study reported fewer than two of
insteadof severalminutes,as used inpriorwork. these events per day over the course of our study.
While we’ve demonstrated that our S3 detector
E. Results Discussion works well with time series inputs synthesized from
packet and bit rates, we envision that its Bayes Net
In comparing the S3 detector results with those of the HW performance could be enhanced by utilizing
and DS detectors, we find that Ks3 performed better overall additional inputs derived from flow counts or packet
providing an 86% detect rate of the anomalies listed in the header and payload data. We plan to investigate
operator’s journal versus 65% for the next best detector with thesepossibilitiesinfuturework.
similaradditionalalarmrates.Of thejournalanomalies,most
were ABUSE anomalies; KS3 detected 93% of these REFERENCES
important events, as opposed to 71% for HW
and DS. To provide meaningful improvement in overall [1] J. Mirkovic, G. Prier, and “Attacking DDoS at
detection rates. One reason for HW method’s poorer the Source,”in Proceedings of 10th IEEE
detection performance appears to be that, as configured, it International Conference on NetworkProtocols,
quickly adjusted or displaced its confidence band November2002.](https://image.slidesharecdn.com/icact143-160531145131/85/Network-Traffic-Anomaly-Detection-Through-Bayes-Net-5-320.jpg)
![819
[2] Endace Measurement Systems, “DAG Network
MonitoringInterface Card,” http://www.endace.com,
[3] P. Barford, J. Kline, D. Plonka, , “A Signal
A n a l y s i s o f N e t w o r k Tr a ff i c A n o m a l i e s , ”
Marseilles,France,November2002.
[4] Y. Zhang, Z. Ge, A. Greenberg, and M.
Roughan, “Network Anomography,” Internet
Measurement, 2005.Conference ’05, Brekeley, CA,
October2005
[5] I. Katzela and M. Schwartz, “Schemes for in
C o m m u n i c a t i o n s N e t w o r k s , ” I E E E / A C M
T r a n s a c t i o n s o n N e t w o r k i n g
vol.3(6), pp.753–764, December1995.](https://image.slidesharecdn.com/icact143-160531145131/85/Network-Traffic-Anomaly-Detection-Through-Bayes-Net-6-320.jpg)

This document presents an anomaly detection algorithm, referred to as KS3, using Bayesian networks to analyze network traffic measurements with fine-grained timestamps. The algorithm achieved an 86% accuracy rate in identifying anomalies, surpassing traditional methods by over 20%, and demonstrated zero false positives during initial operational tests. The study emphasizes the importance of precision in traffic measurement for real-time anomaly detection and highlights the algorithm's effectiveness in distinguishing between normal and anomalous behaviors.