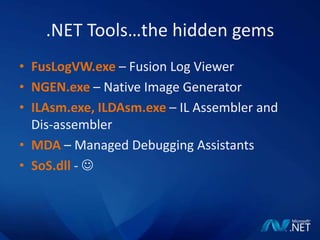
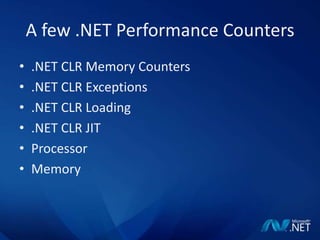
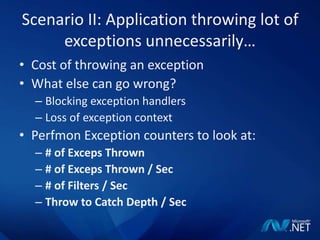
This document discusses .NET performance tips and techniques. It provides an overview of common .NET performance issues such as memory leaks, exceptions, and slow loading applications. It also introduces tools in the .NET framework that can help debug these issues, such as Fusion Log Viewer, Native Image Generator, and Performance Monitor counters. Specific scenarios are presented around resolving FileNotFoundExceptions, improving load time, identifying memory leaks, and troubleshooting PInvoke issues. The document emphasizes that performance is relative and introduces approaches like adding trace messages and using debugging tools to analyze problems.
Reliability Patterns for Distributed ApplicationsAndrew Hamilton
Description of different practices to help improve the reliability of a distributed applications. This presentation starts by establishing a good base of practices and then build upon those practices to create a robust and reliable system.
Improving Performance in .NET Applicationsjasonbock
We all want to write fast code. But writing code that performs well doesn't come for free. Developers must be cognizant of what their code will do when it is executed, and what tools to use when you want to find the hot spots. In this session, we'll cover what a .NET developer needs to know to improve the performance of their applications.
Adam Sitnik "State of the .NET Performance"Yulia Tsisyk
MSK DOT NET #5
2016-12-07
In this talk Adam will describe how latest changes in.NET are affecting performance.
Adam wants to go through:
C# 7: ref locals and ref returns, ValueTuples.
.NET Core: Spans, Buffers, ValueTasks
And how all of these things help build zero-copy streams aka Channels/Pipelines which are going to be a game changer in the next year.
How to Do a Performance Audit of Your .NET WebsiteDNN
The hardest part about website performance optimization is identifying the root cause.
In this presentation, Bruce Chapman, Director of Cloud and Web Operations at DNN, shows you how to perform a comprehensive performance audit of your .NET website.
You’ll learn how to uncover the causes of performance issues, and understand that improving performance is often straightforward once the root cause is identified.
Four Practices to Fix Your Top .NET Performance ProblemsAndreas Grabner
Inefficient Database Access, Inefficien Pool usage and Sizing, Bad Synchronization, Bad Web Page Design - these are the problems that crash .NET Apps. Learn how to analyze them and fix these problems
Metrics Driven DevOps - Automate Scalability and Performance Into your PipelineAndreas Grabner
Continuous Delivery only works if you combine automation with automatic metrics driven quality gates focusing on architectural, scalabilty and performance metrics.
In this presentation I start with several dashboard examples explaining key metrics in production and explain how to automate these metrics into your delivery pipeline.
Это будет 6 живых демо взлома. Идея не обсудить сухую теория, а увидеть на практике, как не всегда очевидные ошибки являются источником серьезных уязвимостей в твоем JavScript приложении.
Akhtar Hossain: AWS San Francisco Startup Day, 9/7/17
Architecture: Manual vs Automation:
When to start automating your processes - There is a breaking point for every process where investing the time to automate it will outweigh the time spent manually doing it. Taking on these tasks too early can divert resources where they could be better allocated. We’ll look at how to determine if and when the right time to automate a process is. We’ll cover automation in many forms including building APIs, Chat-ops, Config Management, and even the value of highly customized keyboard shortcuts.
JVM Support for Multitenant Applications - Steve Poole (IBM)jaxLondonConference
Presented at JAX London 2013
Per-tenant resource management can help ensure that collocated tenants peacefully share computational resources based on individual quotas. This session begins with a comparison of deployment models (shared: hardware, OS, middleware, everything) to motivate the multitenant approach. The main topic is an exploration of experimental data isolation and resource management primitives in IBM’s JDK that combine to help make multitenant applications smaller and more predictable.
What is Microsoft Student Partner Program?Rishu Mehra
Microsoft Student Partner is a program for students which gives recognition among community to perform in a different manner for Microsoft technology with true passion and creativity.
The Metaverse and AI: how can decision-makers harness the Metaverse for their...Jen Stirrup
The Metaverse is popularized in science fiction, and now it is becoming closer to being a part of our daily lives through the use of social media and shopping companies. How can businesses survive in a world where Artificial Intelligence is becoming the present as well as the future of technology, and how does the Metaverse fit into business strategy when futurist ideas are developing into reality at accelerated rates? How do we do this when our data isn't up to scratch? How can we move towards success with our data so we are set up for the Metaverse when it arrives?
How can you help your company evolve, adapt, and succeed using Artificial Intelligence and the Metaverse to stay ahead of the competition? What are the potential issues, complications, and benefits that these technologies could bring to us and our organizations? In this session, Jen Stirrup will explain how to start thinking about these technologies as an organisation.
GraphRAG is All You need? LLM & Knowledge GraphGuy Korland
Guy Korland, CEO and Co-founder of FalkorDB, will review two articles on the integration of language models with knowledge graphs.
1. Unifying Large Language Models and Knowledge Graphs: A Roadmap.
https://arxiv.org/abs/2306.08302
2. Microsoft Research's GraphRAG paper and a review paper on various uses of knowledge graphs:
https://www.microsoft.com/en-us/research/blog/graphrag-unlocking-llm-discovery-on-narrative-private-data/
Welcome to the first live UiPath Community Day Dubai! Join us for this unique occasion to meet our local and global UiPath Community and leaders. You will get a full view of the MEA region's automation landscape and the AI Powered automation technology capabilities of UiPath. Also, hosted by our local partners Marc Ellis, you will enjoy a half-day packed with industry insights and automation peers networking.
📕 Curious on our agenda? Wait no more!
10:00 Welcome note - UiPath Community in Dubai
Lovely Sinha, UiPath Community Chapter Leader, UiPath MVPx3, Hyper-automation Consultant, First Abu Dhabi Bank
10:20 A UiPath cross-region MEA overview
Ashraf El Zarka, VP and Managing Director MEA, UiPath
10:35: Customer Success Journey
Deepthi Deepak, Head of Intelligent Automation CoE, First Abu Dhabi Bank
11:15 The UiPath approach to GenAI with our three principles: improve accuracy, supercharge productivity, and automate more
Boris Krumrey, Global VP, Automation Innovation, UiPath
12:15 To discover how Marc Ellis leverages tech-driven solutions in recruitment and managed services.
Brendan Lingam, Director of Sales and Business Development, Marc Ellis
A tale of scale & speed: How the US Navy is enabling software delivery from l...sonjaschweigert1
Rapid and secure feature delivery is a goal across every application team and every branch of the DoD. The Navy’s DevSecOps platform, Party Barge, has achieved:
- Reduction in onboarding time from 5 weeks to 1 day
- Improved developer experience and productivity through actionable findings and reduction of false positives
- Maintenance of superior security standards and inherent policy enforcement with Authorization to Operate (ATO)
Development teams can ship efficiently and ensure applications are cyber ready for Navy Authorizing Officials (AOs). In this webinar, Sigma Defense and Anchore will give attendees a look behind the scenes and demo secure pipeline automation and security artifacts that speed up application ATO and time to production.
We will cover:
- How to remove silos in DevSecOps
- How to build efficient development pipeline roles and component templates
- How to deliver security artifacts that matter for ATO’s (SBOMs, vulnerability reports, and policy evidence)
- How to streamline operations with automated policy checks on container images
GDG Cloud Southlake #33: Boule & Rebala: Effective AppSec in SDLC using Deplo...James Anderson
Effective Application Security in Software Delivery lifecycle using Deployment Firewall and DBOM
The modern software delivery process (or the CI/CD process) includes many tools, distributed teams, open-source code, and cloud platforms. Constant focus on speed to release software to market, along with the traditional slow and manual security checks has caused gaps in continuous security as an important piece in the software supply chain. Today organizations feel more susceptible to external and internal cyber threats due to the vast attack surface in their applications supply chain and the lack of end-to-end governance and risk management.
The software team must secure its software delivery process to avoid vulnerability and security breaches. This needs to be achieved with existing tool chains and without extensive rework of the delivery processes. This talk will present strategies and techniques for providing visibility into the true risk of the existing vulnerabilities, preventing the introduction of security issues in the software, resolving vulnerabilities in production environments quickly, and capturing the deployment bill of materials (DBOM).
Speakers:
Bob Boule
Robert Boule is a technology enthusiast with PASSION for technology and making things work along with a knack for helping others understand how things work. He comes with around 20 years of solution engineering experience in application security, software continuous delivery, and SaaS platforms. He is known for his dynamic presentations in CI/CD and application security integrated in software delivery lifecycle.
Gopinath Rebala
Gopinath Rebala is the CTO of OpsMx, where he has overall responsibility for the machine learning and data processing architectures for Secure Software Delivery. Gopi also has a strong connection with our customers, leading design and architecture for strategic implementations. Gopi is a frequent speaker and well-known leader in continuous delivery and integrating security into software delivery.
SAP Sapphire 2024 - ASUG301 building better apps with SAP Fiori.pdfPeter Spielvogel
Building better applications for business users with SAP Fiori.
• What is SAP Fiori and why it matters to you
• How a better user experience drives measurable business benefits
• How to get started with SAP Fiori today
• How SAP Fiori elements accelerates application development
• How SAP Build Code includes SAP Fiori tools and other generative artificial intelligence capabilities
• How SAP Fiori paves the way for using AI in SAP apps
Accelerate your Kubernetes clusters with Varnish CachingThijs Feryn
A presentation about the usage and availability of Varnish on Kubernetes. This talk explores the capabilities of Varnish caching and shows how to use the Varnish Helm chart to deploy it to Kubernetes.
This presentation was delivered at K8SUG Singapore. See https://feryn.eu/presentations/accelerate-your-kubernetes-clusters-with-varnish-caching-k8sug-singapore-28-2024 for more details.
Elevating Tactical DDD Patterns Through Object CalisthenicsDorra BARTAGUIZ
After immersing yourself in the blue book and its red counterpart, attending DDD-focused conferences, and applying tactical patterns, you're left with a crucial question: How do I ensure my design is effective? Tactical patterns within Domain-Driven Design (DDD) serve as guiding principles for creating clear and manageable domain models. However, achieving success with these patterns requires additional guidance. Interestingly, we've observed that a set of constraints initially designed for training purposes remarkably aligns with effective pattern implementation, offering a more ‘mechanical’ approach. Let's explore together how Object Calisthenics can elevate the design of your tactical DDD patterns, offering concrete help for those venturing into DDD for the first time!
Encryption in Microsoft 365 - ExpertsLive Netherlands 2024Albert Hoitingh
In this session I delve into the encryption technology used in Microsoft 365 and Microsoft Purview. Including the concepts of Customer Key and Double Key Encryption.
DevOps and Testing slides at DASA ConnectKari Kakkonen
My and Rik Marselis slides at 30.5.2024 DASA Connect conference. We discuss about what is testing, then what is agile testing and finally what is Testing in DevOps. Finally we had lovely workshop with the participants trying to find out different ways to think about quality and testing in different parts of the DevOps infinity loop.
Enhancing Performance with Globus and the Science DMZGlobus
ESnet has led the way in helping national facilities—and many other institutions in the research community—configure Science DMZs and troubleshoot network issues to maximize data transfer performance. In this talk we will present a summary of approaches and tips for getting the most out of your network infrastructure using Globus Connect Server.
zkStudyClub - Reef: Fast Succinct Non-Interactive Zero-Knowledge Regex ProofsAlex Pruden
This paper presents Reef, a system for generating publicly verifiable succinct non-interactive zero-knowledge proofs that a committed document matches or does not match a regular expression. We describe applications such as proving the strength of passwords, the provenance of email despite redactions, the validity of oblivious DNS queries, and the existence of mutations in DNA. Reef supports the Perl Compatible Regular Expression syntax, including wildcards, alternation, ranges, capture groups, Kleene star, negations, and lookarounds. Reef introduces a new type of automata, Skipping Alternating Finite Automata (SAFA), that skips irrelevant parts of a document when producing proofs without undermining soundness, and instantiates SAFA with a lookup argument. Our experimental evaluation confirms that Reef can generate proofs for documents with 32M characters; the proofs are small and cheap to verify (under a second).
Paper: https://eprint.iacr.org/2023/1886
Essentials of Automations: The Art of Triggers and Actions in FMESafe Software
In this second installment of our Essentials of Automations webinar series, we’ll explore the landscape of triggers and actions, guiding you through the nuances of authoring and adapting workspaces for seamless automations. Gain an understanding of the full spectrum of triggers and actions available in FME, empowering you to enhance your workspaces for efficient automation.
We’ll kick things off by showcasing the most commonly used event-based triggers, introducing you to various automation workflows like manual triggers, schedules, directory watchers, and more. Plus, see how these elements play out in real scenarios.
Whether you’re tweaking your current setup or building from the ground up, this session will arm you with the tools and insights needed to transform your FME usage into a powerhouse of productivity. Join us to discover effective strategies that simplify complex processes, enhancing your productivity and transforming your data management practices with FME. Let’s turn complexity into clarity and make your workspaces work wonders!
Observability Concepts EVERY Developer Should Know -- DeveloperWeek Europe.pdfPaige Cruz
Monitoring and observability aren’t traditionally found in software curriculums and many of us cobble this knowledge together from whatever vendor or ecosystem we were first introduced to and whatever is a part of your current company’s observability stack.
While the dev and ops silo continues to crumble….many organizations still relegate monitoring & observability as the purview of ops, infra and SRE teams. This is a mistake - achieving a highly observable system requires collaboration up and down the stack.
I, a former op, would like to extend an invitation to all application developers to join the observability party will share these foundational concepts to build on:
Leading Change strategies and insights for effective change management pdf 1.pdf
.Net Performance by Bijoy Singhal
1. .NetPerformance – Tips and Techniques Bijoy Singhal Developer Evangelist Microsoft India bsinghal@microsoft.com
2. Key Take Aways… Understanding reasons behind common issues that a .NET developer faces day to day How to leverage the tools in .NET framework to solve day to day issues… Performance: What and How… MOST IMPORTANT: The POWER of .NET framework…
4. Perfmon: What is it? The name says it all. Used to monitor the performance parameters of the system and the user applications. How to use it? What are the parameters that we can track?
6. Scenario I: Application Consuming lot of memory What should I look at? Memory counters list Indicators: Memory Leak? # bytes in all Heaps increasing Gen 2 Heap Size increasing # GC handles increasing # total committed/Reserved Bytes increasing % Time in GC Indicators: Memory Fragmentation? # total reserved Bytes significantly larger than # total committed Bytes # of Pinned Objects increasing # GC handles increasing # bytes in all heaps always increasing.
7. Scenario II: Application throwing lot of exceptions unnecessarily… Cost of throwing an exception What else can go wrong? Blocking exception handlers Loss of exception context Perfmon Exception counters to look at: # of Exceps Thrown # of Exceps Thrown / Sec # of Filters / Sec Throw to Catch Depth / Sec
8. Scenario III: Application Takes too long to Load Possible Reasons: Too many assemblies to load Too much of jitting happening. Perfmon counters to look at: % Time in Loading Current Assemblies Rate of Assemblies/AppDomains # of IL Bytes JITted # of methods JITed % time in JIT
9. A Quick note on ASP.NET specific counters Two types: System Counters Application Counters Few important Counters: ASP.NET/Application Restarts. ASP.NET/Requests Queued ASP.NET Application/Requests/sec ASP.NET Application/Errors Total AND many more…
10. .NET Application Performance Performance is a relative term: What is good for you may not be good for others. Performance Bottlenecks in .NET: Am I loading too many assemblies at the start? Am I doing too many memory operations? Am I trying to deal with the memory management on my own? Am I misusing Exceptions and defeating their purpose? The list is long…
11. .NET Application Performance Way outs: Add trace messages in your application. Debug it. Use Debugging tools to do post mortem analysis. Use Perfmon.
12. Scenario I: FileNotFoundException “Our application ran successfully on the Development machine but it is failing with FileNotFoundException when we deploy it in production” Fusion – How the CLR locates assemblies. How can the fusion log viewer help us here How to look into the Fusion Log Fusion Log Viewer: Fuslogvw.exe Demo
13. Scenario II: Slow To Load “Our application takes too long to load for the first time. It exhibits the same behavior once in a while…” What happens when a .NET application runs for the first time Native Images and how they speed up the loading process NGEN: Native image generation How NGEN will help us here Demo
14. Scenario III: Memory Leak “ My application is consuming lot of memory. It looks like a ‘Memory Leak’ to me…” .NET Memory Manager: GC How to get managed heap information How the CLRProfiler can help us here Demo
15. Scenario IV: PInvoke Issues “ I used PInvoke to call a native API, I’m doing everything correct, but the call is failing/ the application is failing with AccessViolationException…” Crucial to match the native API signature exactly without any exception What is MDA How MDA will help us here Demo
16. Thank You Questions ??? Contact me: bsinghal@microsoft.com http://blogs.msdn.com/bsinghal
Editor's Notes
.NET is a powerful platform to build mission critical, robust enterprise applications. While, .NET makes it very easy to build almost any kind of application, it is important that we as developers understand what is going on under the hood. Know, how the architecture of .Net should be leveraged in the best possible way and are aware about the tools available to measure and optimize the performance of our .NET applications. In this session – we will share some secrets to write performant .NET applications. We will touch upon performance counters, performance monitor, CLR profiler etc…
IndicatorsMemory Leaks Indicators: # bytes in all Heaps increasingGen 2 Heap Size increasing# GC handles increasing# of Pinned Objects increasing # total committed Bytes increasing# total reserved Bytes increasingLarge Object Heap increasing Virtual Address Space Fragmentation Indicators: # total reserved Bytes significantly larger than # total committed Bytes# of Pinned Objects increasing# GC handles increasing# bytes in all heaps always increasing. CPU Spin Indicators: Current Queue Length is very close to Threads Count and stays that way for a long time.% Processor Time is continuously at a fixed level for a long period of time (as long as the Current Queue Length is at the same value). Managed Deadlock Indicators: Current Queue Length is very close to Threads Count and stays that way for a long time.% Processor Time is 0 (or close to 0) (as long as the Current Queue Length is at the same value) and the application stopped responding. Blocked Finalizer Thread Indicators: # bytes in all heaps increasingPrivate BytesincresingVirtual Bytes increasing
When is Exception Thrown.:I can think of 3 reasons off the top of my head. Exceptions are expensive. Exceptions can take you into unnecessary code paths. Exceptions are generally thrown when something went wrong. 2. Cost:Grab a stack trace by interpreting metadata emitted by the compiler to guide our stack unwind. Run through a chain of handlers up the stack, calling each handler twice. Compensate for mismatches between SEH, C++ and managed exceptions. Allocate a managed Exception instance and run its constructor. Most likely, this involves looking up resources for the various error messages. Probably take a trip through the OS kernel. Often take a hardware exception. Notify any attached debuggers, profilers, vectored exception handlers and other interested parties. Resources:1. http://blogs.msdn.com/tess/archive/2005/11/30/are-you-aware-that-you-have-thrown-over-40-000-exceptions-in-the-last-3-hours.aspx 2. http://msdn.microsoft.com/en-us/library/kfhcywhs.aspx
1. http://codebetter.com/blogs/raymond.lewallen/archive/2005/05/05/62809.aspx # of Methods Jitted – This counter displays the total number of methods compiled Just-In-Time (JIT) by the CLR JIT compiler since the start of the application. This counter does not include the pre-jitted methods.% Time in Jit – This counter displays the percentage of elapsed time spent in JIT compilation since the last JIT compilation phase. This counter is updated at the end of every JIT compilation phase. A JIT compilation phase is the phase when a method and its dependencies are being compiled.Standard Jit Failures – This counter displays the peak number of methods the JIT compiler has failed to JIT since the start of the application. This failure can occur if the IL cannot be verified or if there was an internal error in the JIT compiler.Total # of IL Bytes Jitted – This counter displays the total IL bytes jitted since the start of the application. This counter is exactly equivalent to the "# of IL Bytes Jitted" counter.2. JIT Overview: http://blogs.msdn.com/davidnotario/archive/2004/10/26/247792.aspx
http://msdn.microsoft.com/en-us/library/fxk122b4.aspxSystem performance counters are exposed in the Windows Performance monitor as the ASP.NET performance counter object.Application performance counters are exposed as the ASP.NET Applications performance object.
Things to look at:Fuslogvw.exe, Default and Native sections.How to enable fusion logging using registry:Set [HKLMSoftwareMicrosoftFusionLogPath] to point to some directory (like c:FusLog)Set [HKLMSoftwareMicrosoftFusionForceLog] as a DWORD value, to 1Fusion References:http://blogs.msdn.com/suzcook/archive/2003/05/29/57120.aspxhttp://msdn.microsoft.com/en-us/library/e74a18c4(VS.80).aspx
Useful Commands: 1. To display contents of Native assembly Cache NGEN display /verbose 2. To install assembly in NGEN cache NGEN install assemblyname 3. To uninstall assembly from NGEN cache NGEN uninstall assemblynameReferences: http://msdn.microsoft.com/en-us/library/6t9t5wcf(VS.80).aspxhttp://blogs.msdn.com/clrcodegeneration/
How to load SoS.dll in VSIn order to load sos.dll you have to open up the Immediate Window (Debug/Windows/Immediate or Ctrl+D, I) and type .load C:WINDOWSMicrosoft.NETFrameworkv2.0.50727sos.dll2. This should yield the response extension C:WINDOWSMicrosoft.NETFrameworkv2.0.50727sos.dll loaded2. References:http://blogs.msdn.com/tess/archive/2007/10/19/net-finalizer-memory-leak-debugging-with-sos-dll-in-visual-studio.aspxhttp://msdn.microsoft.com/en-us/library/bb190764.aspxhttp://blogs.msdn.com/vancem/archive/2006/03/07/545596.aspx
Enable MDA by adding following registry: Windows Registry Editor Version 5.00 [HKEY_LOCAL_MACHINESOFTWAREMicrosoft.NETFramework] "MDA"="1"2. Add App.exe.mda.config file:<?xml version="1.0" encoding="UTF-8" ?> <mdaConfig> <assistants> <pInvokeStackImbalance /> </assistants> </mdaConfig>3. References:http://blogs.msdn.com/jmstall/archive/2005/11/10/introducing_mdas.aspx http://msdn.microsoft.com/en-us/library/d21c150d.aspxhttp://pinvoke.net