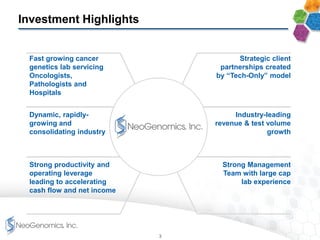
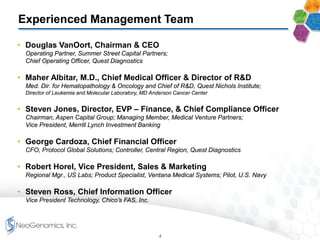
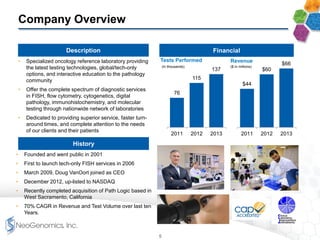
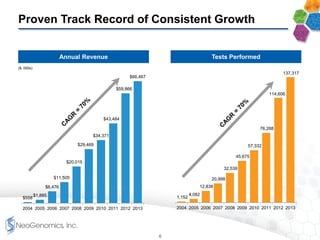
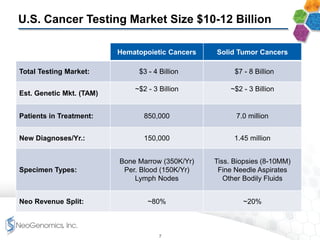
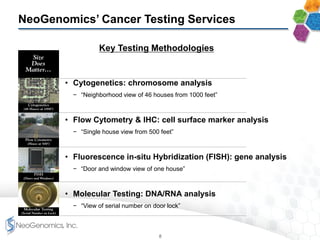
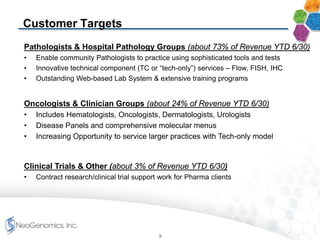
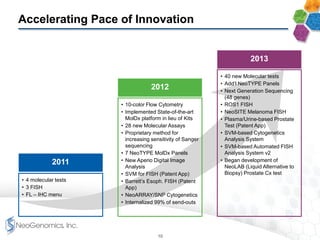
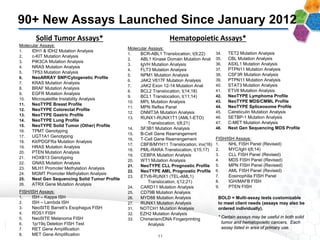
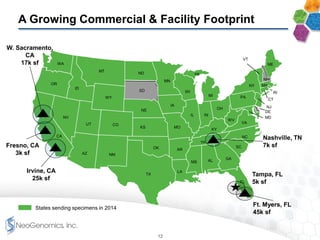
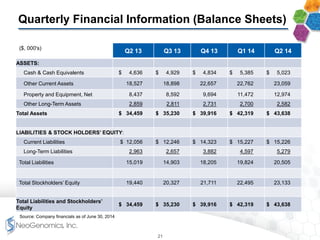
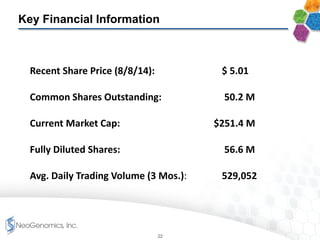
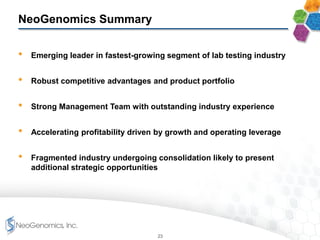
NeoGenomics is a fast growing cancer genetics lab servicing Oncologists, Pathologists and Hospitals. This is August 2014 Company Overview Presentation.
Call Girls in Mohali Surbhi ā¤ļøš 9907093804 šš«¦ Independent Escort Service Mohali
Ā
Neo company overview presentation 2014 08 14
1. Company Overview Presentation
August 2014
āImproving Patient Care
through exceptional cancer
genetic testing services!ā
Time Matters. Results Count!
2. Forward-looking Statements
This presentation contains statements which constitute forward-looking statements within the meaning
of Section 27A of the Securities Act, as amended; Section 21E of the Securities Exchange Act of 1934;
and the Private Securities Litigation Reform Act of 1995. The words āmayā, āwouldā, ācouldā, āwillā,
āexpectā, āestimateā, āanticipateā, ābelieveā, āintendā, āplanā, āgoalā, and similar expressions and
variations thereof are intended to specifically identify forward-looking statements. All statements that
are not statements of historical fact are forward-looking statements.
Investors and prospective investors are cautioned that any such forward-looking statements are not
guarantees of future performance and involve risks and uncertainties, and that actual results may differ
materially from those projected in the forward-looking statements as a result of various factors. The
risks that might cause such differences are identified in our filings with the Securities and Exchange
Commission. We undertake no obligation to publicly update or revise the forward looking statements
made in this presentation to reflect events or circumstances after the date of this presentation or to
reflect the occurrence of unanticipated events.
1
3. Investment Highlights
Fast growing cancer
genetics lab servicing
Oncologists,
Pathologists and
Hospitals
Strategic client
partnerships created
by āTech-Onlyā model
Dynamic, rapidly-
growing and
consolidating industry
Industry-leading
revenue & test volume
growth
Strong productivity and
operating leverage
leading to accelerating
cash flow and net income
Strong Management
Team with large cap
lab experience
3
4. Experienced Management Team
ā¢ Douglas VanOort, Chairman & CEO
Operating Partner, Summer Street Capital Partners;
Chief Operating Officer, Quest Diagnostics
ā¢ Maher Albitar, M.D., Chief Medical Officer & Director of R&D
Med. Dir. for Hematopathology & Oncology and Chief of R&D, Quest Nichols Institute;
Director of Leukemia and Molecular Laboratory, MD Anderson Cancer Center
ā¢ Steven Jones, Director, EVP ā Finance, & Chief Compliance Officer
Chairman, Aspen Capital Group; Managing Member, Medical Venture Partners;
Vice President, Merrill Lynch Investment Banking
ā¢ George Cardoza, Chief Financial Officer
CFO, Protocol Global Solutions; Controller, Central Region, Quest Diagnostics
ā¢ Robert Horel, Vice President, Sales & Marketing
Regional Mgr., US Labs; Product Specialist, Ventana Medical Systems; Pilot, U.S. Navy
ā¢ Steven Ross, Chief Information Officer
Vice President Technology, Chicoās FAS, Inc.
4
5. $44
$60
$66
2011 2012 2013
Company Overview
ā¢ Specialized oncology reference laboratory providing
the latest testing technologies, global/tech-only
options, and interactive education to the pathology
community
ā¢ Offer the complete spectrum of diagnostic services
in FISH, flow cytometry, cytogenetics, digital
pathology, immunohistochemistry, and molecular
testing through nationwide network of laboratories
ā¢ Dedicated to providing superior service, faster turn-
around times, and complete attention to the needs
of our clients and their patients
ā¢ Founded and went public in 2001
ā¢ First to launch tech-only FISH services in 2006
ā¢ March 2009, Doug VanOort joined as CEO
ā¢ December 2012, up-listed to NASDAQ
ā¢ Recently completed acquisition of Path Logic based in
West Sacramento, California
ā¢ 70% CAGR in Revenue and Test Volume over last ten
Years.
Description Financial
History
76
115
137
2011 2012 2013
($ in millions)
RevenueTests Performed
(in thousands)
5
7. U.S. Cancer Testing Market Size $10-12 Billion
Hematopoietic Cancers Solid Tumor Cancers
Total Testing Market: $3 - 4 Billion $7 - 8 Billion
Est. Genetic Mkt. (TAM)
~$2 - 3 Billion ~$2 - 3 Billion
Patients in Treatment: 850,000 7.0 million
New Diagnoses/Yr.: 150,000 1.45 million
Specimen Types:
Bone Marrow (350K/Yr)
Per. Blood (150K/Yr)
Lymph Nodes
Tiss. Biopsies (8-10MM)
Fine Needle Aspirates
Other Bodily Fluids
Neo Revenue Split: ~80% ~20%
7
8. NeoGenomicsā Cancer Testing Services
Key Testing Methodologies
ā¢ Cytogenetics: chromosome analysis
ā āNeighborhood view of 46 houses from 1000 feetā
ā¢ Flow Cytometry & IHC: cell surface marker analysis
ā āSingle house view from 500 feetā
ā¢ Fluorescence in-situ Hybridization (FISH): gene analysis
ā āDoor and window view of one houseā
ā¢ Molecular Testing: DNA/RNA analysis
ā āView of serial number on door lockā
8
9. Customer Targets
Pathologists & Hospital Pathology Groups (about 73% of Revenue YTD 6/30)
ā¢ Enable community Pathologists to practice using sophisticated tools and tests
ā¢ Innovative technical component (TC or ātech-onlyā) services ā Flow, FISH, IHC
ā¢ Outstanding Web-based Lab System & extensive training programs
Oncologists & Clinician Groups (about 24% of Revenue YTD 6/30)
ā¢ Includes Hematologists, Oncologists, Dermatologists, Urologists
ā¢ Disease Panels and comprehensive molecular menus
ā¢ Increasing Opportunity to service larger practices with Tech-only model
Clinical Trials & Other (about 3% of Revenue YTD 6/30)
ā¢ Contract research/clinical trial support work for Pharma clients
9
10. Accelerating Pace of Innovation
ā¢ 4 molecular tests
ā¢ 3 FISH
ā¢ FL ā IHC menu
ā¢ 10-color Flow Cytometry
ā¢ Implemented State-of-the-art
MolDx platform in lieu of Kits
ā¢ 28 new Molecular Assays
ā¢ Proprietary method for
increasing sensitivity of Sanger
sequencing
ā¢ 7 NeoTYPE MolDx Panels
ā¢ New Aperio Digital Image
Analysis
ā¢ SVM for FISH (Patent App)
ā¢ Barrettās Esoph. FISH (Patent
App)
ā¢ NeoARRAY/SNP Cytogenetics
ā¢ Internalized 99% of send-outs
ā¢ 40 new Molecular tests
ā¢ Addāl NeoTYPE Panels
ā¢ Next Generation Sequencing
(48 genes)
ā¢ ROS1 FISH
ā¢ NeoSITE Melanoma FISH
ā¢ Plasma/Urine-based Prostate
Test (Patent App)
ā¢ SVM-based Cytogenetics
Analysis System
ā¢ SVM-based Automated FISH
Analysis System v2
ā¢ Began development of
NeoLAB (Liquid Alternative to
Biopsy) Prostate Cx test
2011
2012
2013
10
11. Solid Tumor Assays* Hematopoietic Assays*
90+ New Assays Launched Since January 2012
Molecular Assays:
1. IDH1 & IDH2 Mutation Analysis
2. c-KIT Mutation Analysis
3. PIK3CA Mutation Analysis
4. NRAS Mutation Analysis
5. TP53 Mutation Analysis
6. NeoARRAY SNP/Cytogenetic Profile
7. KRAS Mutation Analysis
8. BRAF Mutation Analysis
9. EGFR Mutation Analysis
10. Microsatellite Instability Analysis
11. NeoTYPE Breast Profile
12. NeoTYPE Colorectal Profile
13. NeoTYPE Gastric Profile
14. NeoTYPE Lung Profile
15. NeoTYPE Solid Tumor (Other) Profile
16. TPMT Genotyping
17. UGT1A1 Genotyping
18. Kit/PDGFRa Mutation Analysis
19. HRAS Mutation Analysis
20. PTEN Mutation Analysis
21. HOXB13 Genotyping
22. GNAS Mutation Analysis
23. MLH1 Promoter Methylation Analysis
24. MGMT Promoter Methylation Analysis
25. Next Gen Sequencing Solid Tumor Profile
26. ATRX Gene Mutation Analysis
FISH/ISH Assays:
1. ISH ā Kappa ISH
2. ISH ā Lambda ISH
3. NeoSITE Barrettās Esophagus FISH
4. ROS1 FISH
5. NeoSITE Melanoma FISH
6. 1p/19q Deletion FISH Test
7. RET Gene Amplification
8. MET Gene Amplification
Molecular Assays:
1. BCR-ABL1 Translocation, t(9;22)
2. ABL1 Kinase Domain Mutation Anal
3. IgVH Mutation Analysis
4. FLT3 Mutation Analysis
5. NPM1 Mutation Analysis
6. JAK2 V617F Mutation Analysis
7. JAK2 Exon 12-14 Mutation Anal
8. BCL2 Translocation, t(14;18)
9. BCL1 Translocation, t(11;14)
10. MPL Mutation Analysis
11. MPN Reflex Panel
12. DNMT3A Mutation Analysis
13. RUNX1-RUNX1T1 (AML1-ETO)
Translocation, t(8;21)
14. SF3B1 Mutation Analysis
15. B-Cell Gene Rearrangement
16. T-Cell Gene Rearrangement
17. CBFB/MYH11 Translocation, inv(16)
18. PML-RARA Translocation, t(15;17)
19. CEBPA Mutation Analysis
20. WT1 Mutation Analysis
21. NeoTYPE CLL Prognostic Profile
22. NeoTYPE AML Prognostic Profile
23. ETV6-RUNX1 (TEL-AML1)
Translocation, t(12;21)
24. CARD11 Mutation Analysis
25. CD79B Mutation Analysis
26. MYD88 Mutation Analysis
27. RUNX1 Mutation Analysis
31. NOTCH1 Mutation Analysis
32. EZH2 Mutation Analysis
33. Chimerism/DNA Fingerprinting
Analysis
34. TET2 Mutation Analysis
35. CBL Mutation Analysis
36. ASXL1 Mutation Analysis
37. PTPN11 Mutation Analysis
38. CSF3R Mutation Analysis
39. PTPN11 Mutation Analysis
40. STAT3 Mutation Analysis
41. ETV6 Mutation Analysis
42. NeoTYPE Lymphoma Profile
43. NeoTYPE MDS/CMML Profile
44. NeoTYPE Spliceosome Profile
45. Calreticulin Mutation Analysis
46. SETBP-1 Mutation Analysis
47. C-MET Mutation Analysis
48. Next Gen Sequencing MDS Profile
FISH/ISH Assays:
1. NHL FISH Panel (Revised)
2. MYC/IgH t(8;14)
3. CLL FISH Panel (Revised)
4. MDS FISH Panel (Revised)
5. MPN FISH Panel (Revised)
6. AML FISH Panel (Revised)
7. Eosinophilia FISH Panel
8. IGH/MAFB FISH
9. PTEN FISH
BOLD = Multi-assay tests customizable
to meet client needs (assays may also be
ordered individually).
* Certain assays may be useful in both solid
tumor and hematopoietic cancers. Each
assay listed in area of primary use.
11
12. A Growing Commercial & Facility Footprint
NV
OR
WA
MT
MN
NE
SD
ND
ID
WY
OK
KS
COUT
TX
NM
SC
FL
GAALMS
LA
AR
MO
IA
VA
NC
IN
KY
IL
MI
WI
PA
WV
VT
RI
NH
AZ
OH
DE
MD
NY
CA
NJ
MI
MA
States sending specimens in 2014
ME
CT
Irvine, CA
25k sf
Nashville, TN
7k sf
Ft. Myers, FL
45k sf
Tampa, FL
5k sf
W. Sacramento,
CA
17k sf
Fresno, CA
3k sf
12
13. $10
ā¢ On July 8, 2014, NEO announced and closed the
acquisition of Path Labs, LLC dba āPath Logicā for $6
million
ļ§ 2013 Revenue of $9.9 million
ļ§ Implied Enterprise Value/Revenue of 0.6x
ļ§ Includes $150,000 in capital lease obligations
ļ§ $5.85 million at closing paid with cash on hand and
borrowings from its revolving credit facility with and
$.60 million held in escrow
ā¢ Path Logic will operate as a wholly-owned subsidiary of
NeoGenomics
Acquisition of Path Logic
Strategic RationalePath Logic Overview
Transaction Summary
ā¢ A specialized AP laboratory serving California and the
western United States
ā¢ Sub-specialties in renal pathology, dermatopathology,
womenās health and gastrointestinal and genitourinary
pathology
ā¢ Approximately 65 employees as of July 2014, including
9 in-house pathologists and 12 consulting pathologists
ā¢ Founded in 1999 and headquartered in West
Sacramento, California
ā¢ NEO expects $3 ā 4 million of revenue synergies
by offering NEO tests to Path Logic customers and
Path Logic tests to NEO customers
ā¢ Additional cost synergies with increased run rate
and NeoGenomics experience
ā¢ Doubles pathology staff
ā¢ Expansion of geographic footprint in Northern
California with West Sacramento, California
laboratory
- Location to be added to NeoGenomics
- Locations to be discontinued
13
14. Strategic Alliance (Nov 2013)
ā¢ Exclusive 5 year Agreement, with a two year renewal option.
ā¢ Leverages Pathologists expertise, Lab systems, Tech-only model,
comprehensive menus for new segment.
ā¢ Ability to expand into world-wide markets
ā¢ Potential for developing companion diagnostics
ā¢ NEO provides professional interpretations for all AP and Histology testing
ordered with new trials
ā¢ NEO provides technical component services for all U.S. based testing that is
not otherwise performed by Covanceās Lab-within-a-Lab (LWL) facility at NEO
ā NEO does all TC FISH for U.S. based testing
14
15. 2014 and 2015 Strategic Priorities
ā¢ Next Gen Sequencing
ā¢ Develop Prostate Cancer Test
ā¢ Launch New Products
ā¢ Grow Clinical Trials
ā¢ Optimize Covance partnership
ā¢ Higher Productivity
ā¢ Lower Costs
ā¢ Become a āDigital Labā
ā¢ Expand Sales Team
ā¢ Add new clients
ā¢ Improve Informatics
Growth Get LEAN
InnovateDiversify
15
20. Quarterly Financial Information (P&L)
($, 000's) Q2 13(1) Q3 13 Q4 13 Q1 14(2) Q2 14(2)
Total Revenue $ 15,603 $ 16,884 $ 18,323 $ 18,182 $ 20,670
% Growth (YoY) -0.1% 18.9% 23.0% 16.1% 32.5%
Total Gross Margin 7,157 8,171 9,163 8,710
10,240
Gross Margin % 45.9% 48.4% 50.0% 47.9% 49.5%
Total SG&A (Incl R&D) Exp 6,651 7,011 7,959 8,316 9,661
SG&A as a % of Rev 42.6% 41.5% 43.4% 45.7% 46.7%
Net Income/(Loss) $ 273 $ 900 $ 858 $ 102 $ 274
Diluted EPS $0.01 $0.02 $0.02 $0.00 $0.01
Adjusted EBITDA $ 1,825 $ 2,163 $ 2,733 $ 1,685 $ 2,114
Summary Operating Data
% Growth in Tests Performed (YoY) 12.7% 19.1% 27.8% 20.7% 39.8%
Avg. Revenue/Test $ 480 $ 501 $ 470 $ 469 $ 455
% Change (YoY) -11.3% -0.2% -3.7% -3.8% -5.3%
Avg. COGS/Test $ 260 $ 258 $ 235 $ 245 $ 229
% Change (YoY) -9.1% -12.0% -15.3% -6.7% -11.7%
(1) YoY comparisons impacted by a reduction in revenue of $1.3 MM/Qtr as a result of the expiration of the TC Grandfather Clause.
(2) Q1 & Q2 2014 Revenue Impacted by Company's Election to Account for Medicare FISH Revenue using a worst case interpretation of the recent NCCI Guidelines, which
CMS has yet to clarify.
20
21. Quarterly Financial Information (Balance Sheets)
($, 000's)
Q2 13 Q3 13 Q4 13 Q1 14 Q2 14
ASSETS:
Cash & Cash Equivalents $ 4,636 $ 4,929 $ 4,834 $ 5,385 $ 5,023
Other Current Assets 18,527 18,898 22,657 22,762 23,059
Property and Equipment, Net 8,437 8,592 9,694 11,472 12,974
Other Long-Term Assets 2,859 2,811 2,731 2,700 2,582
Total Assets $ 34,459 $ 35,230 $ 39,916 $ 42,319 $ 43,638
LIABILITIES & STOCK HOLDERSā EQUITY:
Current Liabilities $ 12,056 $ 12,246 $ 14,323 $ 15,227 $ 15,226
Long-Term Liabilities 2,963 2,657 3,882 4,597 5,279
Total Liabilities 15,019 14,903 18,205 19,824 20,505
Total Stockholdersā Equity 19,440 20,327 21,711 22,495 23,133
Total Liabilities and Stockholdersā
Equity
$ 34,459 $ 35,230 $ 39,916 $ 42,319 $ 43,638
Source: Company financials as of June 30, 2014
21
22. Recent Share Price (8/8/14): $ 5.01
Common Shares Outstanding: 50.2 M
Current Market Cap: $251.4 M
Fully Diluted Shares: 56.6 M
Avg. Daily Trading Volume (3 Mos.): 529,052
Key Financial Information
22
23. NeoGenomics Summary
ā¢ Emerging leader in fastest-growing segment of lab testing industry
ā¢ Robust competitive advantages and product portfolio
ā¢ Strong Management Team with outstanding industry experience
ā¢ Accelerating profitability driven by growth and operating leverage
ā¢ Fragmented industry undergoing consolidation likely to present
additional strategic opportunities
23