National monitoring system of the situation with internally displaced persons. Report 1, May 2016
•
0 likes•27 views

National monitoring system of the situation with internally displaced persons. Report 1, May 2016

Recommended
Recommended
More Related Content
Similar to National monitoring system of the situation with internally displaced persons. Report 1, May 2016
Similar to National monitoring system of the situation with internally displaced persons. Report 1, May 2016 (20)
More from DonbassFullAccess
More from DonbassFullAccess (20)
Recently uploaded
Recently uploaded (20)
National monitoring system of the situation with internally displaced persons. Report 1, May 2016
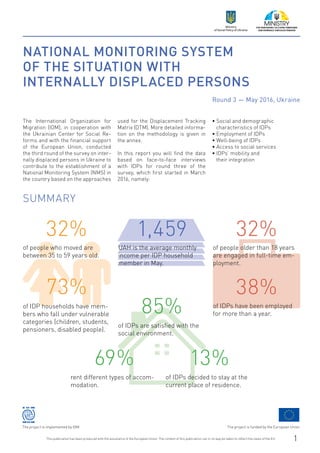
- 1. The project is funded by the European UnionThe project is implemented by IOM This publication has been produced with the assistance of the European Union. The content of this publication can in no way be taken to reflect the views of the EU. 1 Ministry of Social Policy of Ukraine NATIONAL MONITORING SYSTEM OF THE SITUATION WITH INTERNALLY DISPLACED PERSONS Round 3 — May 2016, Ukraine The International Organization for Migration (IOM), in cooperation with the Ukrainian Center for Social Re- forms and with the financial support of the European Union, conducted the third round of the survey on inter- nally displaced persons in Ukraine to contribute to the establishment of a National Monitoring System (NMS) in the country based on the approaches used for the Displacement Tracking Matrix (DTM). More detailed informa- tion on the methodology is given in the annex. In this report you will find the data based on face-to-face interviews with IDPs for round three of the survey, which first started in March 2016, namely: • Social and demographic characteristics of IDPs • Employment of IDPs • Well-being of IDPs • Access to social services • IDPs’ mobility and their integration SUMMARY 32% of people who moved are between 35 to 59 years old. 73% of IDP households have mem- bers who fall under vulnerable categories (children, students, pensioners, disabled people). 32% of people older than 18 years are engaged in full-time em- ployment. 38% of IDPs have been employed for more than a year. 1,459 UAH is the average monthly income per IDP household member in May. 69% rent different types of accom- modation. 85% of IDPs are satisfied with the social environment. 13% of IDPs decided to stay at the current place of residence.
- 2. The project is funded by the European Union The project is implemented by IOM This publication has been produced with the assistance of the European Union. The content of this publication can in no way be taken to reflect the views of the EU.2 Ministry of Social Policy of Ukraine SOCIAL AND DEMOGRAPHIC CHARACTERISTICS OF IDPS During the survey, respondents were asked about all household members who live with them, so the informa- tion on age, sex and social status of household members of surveyed IDPs was received. The demographic characteristics of IDPs remained almost unchanged in all three rounds. Thus, the sex dis- aggregation of IDP household mem- bers over three rounds is presented in figure 1. The prevalence of wom- en is steady in all rounds of the NMS survey with a 57% share of women and 43% share of men among IDP household members. The figures are close to the State Statistics Service’s estimates for the general population of 46% men and 54% women1 . As per figure, the largest share of people who moved are the age group from 35 to 59 years old (32% in the third round), followed by the 18 to 34 age group with 26%. These two cate- gories make up 58% of people of an employable age (18-59 years)2 . 1 According to data as of January 1, 2016, as estimated by State Statistics Service of Ukraine based on administrative data and latest census data http://ukrstat.gov.ua/operativ/operativ2007/ds/nas_rik/nas_u/nas_rik_u.html 2 According to data as of January 1, 2016, as estimated by State Statistics Service of Ukraine based on administrative data and latest census data, the share of people at employable age makes up about 60% http://ukrstat.gov.ua/operativ/operativ2007/ds/nas_rik/nas_u/nas_rik_u.html Figure 1. Sex disaggregation of IDP household members, % 4258 Female Male 4357 Male Round 1 Rounds 2 and 3 Female 0 10 20 30 40 Figure 2. Age disaggregation of surveyed IDP household members, % 60+ 35 — 59 18 — 34 5 — 17 0 — 4 Round 1 Round 2 Round 3 15 13 14 29 34 32 24 23 26 21 20 18 11 10 10
- 3. The project is funded by the European UnionThe project is implemented by IOM This publication has been produced with the assistance of the European Union. The content of this publication can in no way be taken to reflect the views of the EU. 3 Ministry of Social Policy of Ukraine Round 1 Round 2 Round 3 Households with members of vulnerable categories 81 73 73 Households with members of no vulnerable categories 19 27 27 Table 1. Households with members of vulnerable categories (children, students, pensioners, disabled people), % of surveyed households Round 1 Round 2 Round 3 Households with working/non-working retired pensioners (according to respondents) 28 29 30 Table 2. IDP households with pensioners as household members, % of surveyed households Socially vulnerable groups needing priority assistance from the state include: pensioners, the disabled, families with children, orphaned children, youth, women, the unem- ployed, victims of the Chernobyl accident, poor people, and margin- alized sections of the population (homeless, addicted to alcohol and drug addicts). Round 1 Round 2 Round 3 Households with disabled persons 14 10 9 Households with no disabled persons 86 90 91 Table 3. Households with disabled persons (1-3 groups, disabled since childhood), % of surveyed households, % of surveyed households Figure 3. Children in the family, % 4555 With children Without children 4852 With children Without children Round 1 Round 2 5347 With children Without children Round 3 Figure 4. Households with children, % of surveyed households ≥3 children 2 children 1 child 0 10 30 50 70 13 11 8 32 30 29 55 59 63 Round 1 Round 2 Round 3 Round 1 Round 2 Round 3 Households with students 3 7 5 Households with no students 97 93 95 Table 4. Households with students, % of surveyed households
- 4. The project is funded by the European Union The project is implemented by IOM This publication has been produced with the assistance of the European Union. The content of this publication can in no way be taken to reflect the views of the EU.4 Ministry of Social Policy of Ukraine With regard to social characteristics, certain changes have been observed IDPs engaged in full-time employ- ment — 32% in the third round (Ta- ble 8) — represent a plurality based on the social status of respondents in the IDP households over the age of 18. The unemployed (that is with- out work, but available for work and seeking work) account for 15% of IDPs in the third round, and less than a half of them receive unemployment benefits. During the observation pe- riod, there was a steady increase (by 4% each round from 24% to 32%) in the share of people who work full- time. At the same time, the share of unemployed without unemployment benefits decreased by six per cent in the third round as compared to the first round (from 15% to 9%). This could suggest an improvement in employment opportunities for IDPs and social protection of unemployed IDPs. Social Status Round 1 Round 2 Round 3 In full-time employment 24 28 32 In part-time employment 6 8 8 Working retirement pensioners 1 2 1 Self-employed 1 1 1 Non-working retirement pensioners 20 22 22 Unemployed without unemployment benefits 15 12 9 Unemployed, receives unemployment benefits 5 5 6 Do not work, receive pension or benefits (disabled persons; persons on maternity leave) 16 13 13 Unemployed (householder; students) 11 7 7 Other 1 2 1 Table 5. Distribution of households of surveyed IDPs by social status of 18+ respondents Centre for early childhood development, established by IOM-supported IDPs in Odesa Photo:BenRobinson/IOM2016
- 5. The project is funded by the European UnionThe project is implemented by IOM This publication has been produced with the assistance of the European Union. The content of this publication can in no way be taken to reflect the views of the EU. 5 Ministry of Social Policy of Ukraine EMPLOYMENT OF IDPS Less than half of the IDP households surveyed have regular income from employment. In the third round, there is still an uptick of 5% in the share of IDPs who name a salary as one of the sources of income for their household and of 5% in the share of IDPs with irregular side jobs as compared to the first round. Howev- er, the second round had shown an increase of 8% from the first round in the share of irregular side jobs. Such fluctuations are not unusual for this income -generating modali- ty (Table 6, please see Table 10 for a more detailed breakdown of income sources). The involvement of IDPs in employ- ment is quite low at the new places of residence. Thirty-five per cent of IDPs consider themselves as em- ployed in the third round, or four per cent more than the relevant share in the first round of the survey (Table 7). If we compare the structure of em- ployment after displacement with the structure of employment before displacement for three rounds, we can note fluctuations in the share of people employed in activities related to industry (Table 8). Household Income Source Share of IDPs with Relevant Income Source Round 1 Round 2 Round 3 Salary 40 41 45 Irregular side jobs 14 22 19 Table 6. IDPs citing income from employment as main income source of their households, % Note. Respondents could select several options. Curently employed Employed before displacement Round 1 Round 2 Round 3 Yes No Yes No Yes No Yes 27 4 28 5 31 4 No 39 30 34 34 28 37 Table 7. Change in employment status after displacement, % Sector of Activity before Displacement Share of people employed in the relevant sector out of all people employed before displacement Share of people employed after displacement out of those engaged in the relevant sector Round 1 Round 2 Round 3 Round 1 Round 2 Round 3 Industry 22 15 17 10 12 17 Transportation 4 5 3 2 2 4 Trade 17 19 19 17 19 19 Services 24 20 24 30 28 26 Construction 4 4 6 7 4 6 Other 28 10 6 34 14 4 Education — 9 10 — 7 11 Public administration — 12 11 — 9 10 Health care — 6 4 — 4 3 Table 8. IDPs employed before and after displacement by sector of activity, %
- 6. The project is funded by the European Union The project is implemented by IOM This publication has been produced with the assistance of the European Union. The content of this publication can in no way be taken to reflect the views of the EU.6 Ministry of Social Policy of Ukraine IDPs who managed to find a job af- ter displacement mostly have stable jobs. Thirty-eight per cent in the third round have been in their current jobs for more than a year. The category of “more than one year in employment” is the largest one in this round fol- lowed by “from 6 months to one year” that had the highest value in the pre- vious round (Figure 5). Most IDPs who do not have a job re- ported the need for support in finding employment. The main type of pos- sible solution that IDPs prefer is the direct provision of a job. Ten per cent of the unemployed are interested in starting their own business (Table 9). 6 months to a year More than a year Less than 6 months Less than a month Did not respond Figure 5. IDPs employed after displacement by duration of employment, % 0 10 20 30 40 32 39 31 32 26 38 27 29 21 8 5 5 1 1 5 Round 1 Round 2 Round 3 Type of Support Round 1 Round 2 Round 3 Retraining 4 9 6 Employment 39 31 38 Support in establishment of own business 7 10 10 Consultation in employment center 4 4 1 Other 7 3 3 Do not need a job 36 39 36 Did not respond 3 4 6 Table 9. IDPs who do not have jobs by type of preferred support, % IOM-supported IDP engaged in furniture production in Odesa Photo:BenRobinson/IOM2016
- 7. The project is funded by the European UnionThe project is implemented by IOM This publication has been produced with the assistance of the European Union. The content of this publication can in no way be taken to reflect the views of the EU. 7 Ministry of Social Policy of Ukraine WELL-BEING OF IDPS The average monthly income per IDP household member for 50 percent of the surveyed IDPs is up to 1,330 UAH, down from 65 percent in the first round. Forty per cent have 1,331- 2,500 UAH on average per household member, and ten per cent have more than 2,501 UAH (Figure 6). There is a noticeable increase by 12% in the share of people who state having an income within 1,331-2500 UAH per household member that could ex- plained by some rise in social bene- fits implemented by the state3 . The main sources of income for peo- ple in displacement are given in ta- ble 10. The most important source of income is provided by social benefits and IDP allowances. Salaries and pensions also comprise a signifi- cant share in the total income of IDP households. For a third of respon- dents, humanitarian aid is an im- portant source of subsistence. Irreg- ular earnings and family support are the main sources of income for 19% and 16% in the third round, respec- tively (Table 10). In case respondents will have no job or livelihood opportunities, most of them (61%) will cut down their ex- penses first to cope with this and then work more hours (27%), ad- dress relatives/friends (28%) and various agencies for support (52%). Five per cent of respondents will de- cide for return to NGCA (Table 11). 3 According to Article 7 of the Law of Ukraine “On State Budget of Ukraine for 2016”, the minimum monthly subsistence level per capita established by the state for 1 January-30 April 2016 is 1,330 UAH, and for 1 May-30 November 2016 is 1,399 UAH. The minimum subsistence level for people able to work is 1,450 UAH since May 1, 2016 (http://zakon5.rada.gov.ua/laws/show/928-19). UAH: Up to 1330 1331 — 2500 2501 — 3000 3001 — 4000 4001 — 5000 5001 and more 70 50 30 10 65 27 4 3 0.4 1 59 28 6 4 2 1 Figure 6. Distribution of IDP households by income level and average monthly income per household member, % Round 1 Round 2 Round 3 50 40 7 2 0.7 0.3 Round 1 Round 2 Round 3 Salary 40 41 45 Part time or irregular job 14 22 19 Pension 38 36 32 Support of relatives 13 12 16 IDP allowance 44 54 48 Social benefits 45 44 46 Humanitarian assistance 30 37 32 Table 10. Main sources of income in IDP household, % Round 1 Round 2 Round 3 Reduce household expenditures 45 61 61 Will agree to unsafe or illegal job 5 6 6 Will agree to work on weekend or more hours per day 22 22 27 Will sell things 8 3 5 Receive support from relatives and friends 19 21 28 Try to address state authorities 32 29 29 Try to access NGO or international organization 26 31 23 Return to place of living before displacement 8 6 5 Table 11. Coping strategies in case of no job and livelihood opportunities, % of respondents
- 8. The project is funded by the European Union The project is implemented by IOM This publication has been produced with the assistance of the European Union. The content of this publication can in no way be taken to reflect the views of the EU.8 Ministry of Social Policy of Ukraine LIVING CONDITIONS AND ACCOMMODATION TYPES According to the results of round III, most IDPs live in and pay for their accommodation. Sixty-two per cent (62%) live in rented separate ac- commodation — rented apartments (47%) and rented houses (15%). A significant share of IDPs (20%) live with relatives or hosting families. Seven per cent of IDPs live in dormi- tories, 2% stay in collective centers and 15% rent a room in an apartment (Figure 7). Most IDPs are satisfied with their liv- ing conditions. Major complaints re- fer to insulation and living space as well as sewerage and heating (Figure 8). Fewer concerns relate to safety and the availability of electricity. Rented apartment Rented room Rented house Hosting family or relatives Dormitory Collective centre Other 0 10 20 30 40 50 Figure 7. IDP accommodation type, % Round 1 Round 2 Round 3 35 42 47 8 6 7 13 20 15 19 22 20 13 6 7 9 1 2 3 3 2 0 20 40 60 80 100 Figure 8. IDP satisfaction with living conditions, % of respondents Round 1 Round 2 Round 3 Availability of electricity Living space Supply of water Safety Heating Thermal insulation Sewage 85 91 93 67 76 82 73 83 88 78 88 90 71 77 83 65 72 81 68 79 86 IDP family trying to make their current home in Zaporizhia look beautiful Photo:BenRobinson/IOM2016
- 9. The project is funded by the European UnionThe project is implemented by IOM This publication has been produced with the assistance of the European Union. The content of this publication can in no way be taken to reflect the views of the EU. 9 Ministry of Social Policy of Ukraine ACCESS TO SOCIAL SERVICES The accessibility of social services for IDPs reveals the ability to meet the needs of IDPs in vital services and is an important aspect of their integration into the host community. The main point of respondents’ con- cern is the lack of employment op- portunities (Figure 9 and 10). The vast majority of respondents (85%) are satisfied with the social environment of their current place of residence in the third round. This is 11% higher than in the first round, and that is an important illustration of the positive attitude of host com- munities to IDPs and IDPs’ own incli- nation towards integration. Only 3% of respondents are not satisfied with the social environment. The levels of IDPs’ satisfaction with the possibility of receiving social as- sistance (72%) and pensions (49% — down from 68% in round one) are rel- atively high. Nine per cent (9%) and three per cent (3%) of respondents, respectively, are dissatisfied with the aforementioned services (Figures 9 and 10). Table 9 provides more de- tailed information on responses of households which members receive pensions. The accessibility of such important public services as education and medical care raises some concerns amongst IDPs. Nine per cent (9%) of respondents are dissatisfied with the possibilities for accessing medi- cal care in the third round, while 7% neutrally evaluate the issue, 80% are satisfied, and the rest either did not respond or are undecided. A con- siderable uptick (by 21 %) in the IDP satisfaction level with the medical care facilities during the observation period of March-May 2016 should be noted. Three per cent (3%) of respondents are dissatisfied with the possibilities of obtaining an education or enrolling children in schools and/or kinder- gartens, almost eight per cent (7%) of respondents are neutral about access to education, twenty per cent (20%) are undecided, sixty per cent (60%) are satisfied with existing ca- pabilities to obtain education, the re- maining share refer to no response (Figures 9 and 10). Table 12. Satisfaction of IDPs with the possibility of receiving a pension, % Speaking about your current place of residence, how satisfied are you with the possibility of receiving a pension4 , % Totally satisfied Somewhat satisfied Neither satisfied, nor dissatisfied Somewhat dissatisfied Totally dissatisfied Do not know No response Households with work- ing and non-working pensioners 62.3% 20.5% 6.4% 2.6% 3.4% 2.9% 1.9% Households with mem- bers with special needs 41.6% 29.6% 13.7% 4.0% 5.9% 2.2% 3.0% 4 The Law of Ukraine on “Pension Provision” differentiates the following types of pensions: labour pension, pension by age, pension by disability, pension for loss of breadwinner, long-service pension (http://zakon5.rada.gov.ua/laws/show/1788-12). Disability pension is assigned for the duration of disability and are to be re-confirmed. When people with disabilities reach the retirement age, the disability pension is appointed for life and re-examination of such people are conducted only at their request. In case of change of disability group, the amount of pension is also changing.
- 10. The project is funded by the European Union The project is implemented by IOM This publication has been produced with the assistance of the European Union. The content of this publication can in no way be taken to reflect the views of the EU.10 Ministry of Social Policy of Ukraine Job opportunities raise the most con- cerns. Twenty-six per cent (26%)% of respondents noted that they are dis- satisfied with opportunities to get a job, while sixteen per cent (16%) are neutral, and thirty eight per cent (38%) are satisfied. It is also confirmed by the responses of IDPs on the reasons behind fur- ther displacement — that problems with housing, high rental payments and lack of employment opportuni- ties are the most challenging (please see Figure 9 below for more de- tailed information). All other areas — health, education, social protection, public services — are considered by most of key informants to be rather accessible for IDPs The main reasons for IDPs’ dis- satisfaction with public services is the lack of jobs (56%), lack of funds (21%), lack of information support (21%), gross attitudes towards dis- placed (14%) and corruption (15%) (Table 13). 0 20 40 60 80 100 Accessibility of health care services Employment opportunities Possibilities to obtain education and enroll children in schools/ kindergartens Possibility of receiving pension payments Possibility of receiving social support Social environment 59 73 80 31 38 38 57 64 60 68 53 49 68 71 72 74 80 85 Figure 9. IDPs satisfaction with public services and environment, % of respondents Round 1 Round 2 Round 3 0 5 15 25 35 Accessibility of health care services Employment opportunities Possibilities to obtain education and enroll children in schools/ kindergartens Possibility of receiving pension payments Possibility of receiving social support Social environment Figure 10. IDPs dissatisfaction with public services and environment, % of respondents Round 1 Round 2 Round 3 22 15 9 34 33 26 12 6 3 13 5 3 13 17 9 8 6 3 IOM-supported IDPs growing strawberry in Zhytomyr Region Photo:BenRobinson/IOM2016
- 11. The project is funded by the European UnionThe project is implemented by IOM This publication has been produced with the assistance of the European Union. The content of this publication can in no way be taken to reflect the views of the EU. 11 Ministry of Social Policy of Ukraine Round 1 Round 2 Round 3 Lack of necessary documents 13 8 7 Lack of funds 44 24 21 Lack of information 30 34 21 Corruption 20 21 15 Brusque treatment 28 22 14 Transport accessibility 5 9 10 Other 27 13 12 Lack of job vacancies — 38 56 Table 13. Reasons for IDPs’ dissatisfaction with public services, % of respondents who responded positively IDPS’ MOBILITY AND THEIR INTEGRATION Almost 99% of the surveyed IDPs come from the Donbas, and the number of people who left Donetsk Oblast is nearly twice the number of those who were displaced from Lu- hansk Oblast (Table 14). The interviewed IDPs reside in host areas for quite a long time. The share of people staying 18 months and more at the current place of res- idence was steadily increasing from round to round and comprised 45% in round 3 (25% growth in the cate- gory) (Table 15). Round 1 Round 2 Round 3 AR Crimea 1.3 1.4 1.6 Donetsk Oblast 63.5 66.9 66.4 Luhansk Oblast 35.2 31.7 32.0 Table 14. Distribution of IDPs by place of origin, % Round 1 Round 2 Round 3 Up to 6 months 8 11 5 6-12 months inclusive 21 17 16 12-18 months inclusive 51 35 34 More than 18 months 20 37 45 Table 15 . Distribution of IDPs by duration of stay in current place of living by rounds, % Round 1 Total Round 2 Total Round 3 TotalAR Crimea Donetsk Oblast Luhansk Oblast AR Crimea Donetsk Oblast Luhansk Oblast AR Crimea Donetsk Oblast Luhansk Oblast Did not move after displacement from place of origin 80 72 71 71 96 75 74 75 80 82 83 82 Moved farther, including: 20 28 29 29 4 25 26 25 20 18 16 18 Once 1 15 7 12 0 10 6 9 0 8 5 8 Twice 0 8 13 10 4 8 13 10 0 7 6 7 Three and more 19 5 9 7 0 6 7 6 20 3 5 3 Table 16. Distribution of IDPs by number of movements in displacement, % by place of origin
- 12. The project is funded by the European Union The project is implemented by IOM This publication has been produced with the assistance of the European Union. The content of this publication can in no way be taken to reflect the views of the EU.12 Ministry of Social Policy of Ukraine For the vast majority of IDPs, the current place of residence is the first location after displacement, where they have lived for at least a month. IDPs who initially moved from Crimea most rarely moved, as compared to people displaced from the NGCA of Luhansk Oblast (Table 16). The main reasons that prod IDPs to move again after displacement are issues with housing. On the oth- er hand, the unavailability of health care facilities and lack of educational possibilities have rarely been deter- mined as reasons to move farther (Table 17). According to the third round data, ev- ery eighth IDP intends to remain per- manently in the current place of res- idence. The highest rate is for IDPs from Crimea, and the lowest is for IDPs coming from Donetsk Oblast. Over one-half of IDPs plan to remain in the current settlement till the end of the conflict (52%) or for at least a year (10%) (Table 18). The vast ma- jority of those who intend to relocate plan to settle in Ukraine. Almost one-fifth of IDPs are willing to return at some point in time to the NGCA. The majority of IDPs with such intentions come from Donetsk Oblast. About half of the IDPs from Donetsk and Luhansk oblasts and more than one-third of the IDPs from Crimea are undecided about their intentions to return to their place of residence before displacement (Table 19). Round 1 Round 2 Round 3 Lack of employment opportunities 17 14 12 Problems with housing 40 41 41 High rental payment for housing 29 36 36 Safety issues 12 9 7 Lack of education possibilities 2 1 4 Inaccessibility of healthcare facilities 2 2 3 Social environment 3 6 6 Table 17. IDPs’ reasons to move again after displacement (% of people who responded to the relevant question) Do you plan to stay in the current place of living? Round 1 Total Round 2 Total Round 3 TotalAR Crimea Donetsk Oblast Luhansk Oblast AR Crimea Donetsk Oblast Luhansk Oblast AR Crimea Donetsk Oblast Luhansk Oblast Yes, forever 20 10 17 13 23 11 15 12 17 14 11 13 Yes, at least for a year 0.0 12 1 11 16 9 14 11 10 7,5 16 10 Yes, till the conflict ends 52 54 41 49 18 54 40 49 23 53 52 52 Yes, other 14 1 3 2 4 2 9 4 0 1 2 2 No 8 5 10 7 1 5 5 5 4 4 4 4 Difficult to respond / no response 6 18 18 18 38 19 17 19 46 28 15 19 Table 18. Distribution of IDPs by intention to stay in the current place of living, % Do you plan to return to your place of living before displacement? Round 1 Total Round 2 Total Round 3 TotalAR Crimea Donetsk Oblast Luhansk Oblast AR Crimea Donetsk Oblast Luhansk Oblast AR Crimea Donetsk Oblast Luhansk Oblast Yes 8 47 39 44 8 43 24 37 20 40 25 33 No 22 19 27 22 58 17 28 21 31 20 28 27 Difficult to respond / no response 70 34 34 34 34 40 48 42 49 40 47 40 Table 19. Distribution of IDPs by intention to return to their places of living before displacement, %
- 13. The project is funded by the European UnionThe project is implemented by IOM This publication has been produced with the assistance of the European Union. The content of this publication can in no way be taken to reflect the views of the EU. 13 Ministry of Social Policy of Ukraine ANNEX. METHODOLOGY The information support of NMS in the third round is performed by com- bining data obtained from multiple sources, namely: • administrative data; • data of sample surveys of IDP households; • available relevant data from other sources. The object of the NMS is the IDP pop- ulation at their place of settlement in 24 oblasts of Ukraine and the city of Kyiv. The subject of this survey is the situa- tion and problems related to IDPs’ lo- cation, their movements or intentions to move further, return intentions, and local communities’ perception of the IDPs’ situation in 24 oblasts of Ukraine and the city of Kyiv. Target groups — IDP individuals and households. The survey collects information on: socioeconomic characteristics of IDPs and IDP households, IDP trends and movement intentions, employ- ment and livelihood of IDPs, IDP access to social services, preferred sustainable solutions and assistance needs as well as analysis and recom- mendations on the ways to solve the problems. With the purpose to conduct face-to- face interviews with key informants and IDP households, a territorial sample comprising 300 units was de- vised (sample distribution by oblasts is provided in Table 1). The gener- al population of registered IDPs as of December 2015 was stratified by oblast. The selection of territorial units was carried out with the prob- ability proportional to the number of registered IDPs in each of them. In each territorial unit, two key infor- mants and two IDP households were selected for the third round of the NMS. The sample survey of IDP house- holds for face-to-face interviews envisages the formation of a strat- ified multistage probability sample of households. The monthly sam- ple size makes up no less than 600 households. The cumulative sample size will be no less than 2,400 house- holds. This will provide a reliable assessment of key indicators at the national level (on a monthly basis) as well as a regional one based on data consolidated during March-May 2016. The distribution of IDP house- holds for face-to-face interviews within the second round of the NMS is provided in Table 2. IDP child in Zhytomyr Photo:BenRobinson/IOM2016
- 14. The project is funded by the European Union The project is implemented by IOM This publication has been produced with the assistance of the European Union. The content of this publication can in no way be taken to reflect the views of the EU.14 Ministry of Social Policy of Ukraine Oblast Number of territorial units selected Total 300 Vinnytsia 5 Volyn 5 Dnipropetrovsk 13 Donetsk 88 Zhytomyr 5 Zakarpattya 5 Zaporizhia 18 Ivano-Frankivsk 5 Kyiv city 18 Kyiv oblast (excluding Kyiv) 7 Kirovohrad 5 Luhansk 35 Lviv 5 Mykolaiv 5 Odesa 6 Poltava 5 Rivne 5 Sumy 5 Ternopil 5 Kharkiv 30 Kherson 5 Khmelnytsky 5 Cherkasy 5 Chernivtsi 5 Chernihiv 5 Oblast Number of key informants Total 600 Vinnitsa 10 Volyn 10 Dnipropetrovsk 26 Donetsk 176 Zhytomyr 10 Zakarpattya 10 Zaporizhia 36 Ivano-Frankivsk 10 Kyiv city 36 Kyiv (excluding Kyiv) 14 Kirovohrad 10 Luhansk 70 Lviv 10 Mykolaiv 10 Odesa 12 Poltava 10 Rivne 10 Sumy 10 Ternopil 10 Kharkiv 60 Kherson 10 Khmelnytsky 10 Cherkasy 10 Chernivtsi 10 Chernihiv 10 Table 1. Distribution of the sample for territorial units within oblasts of Ukraine Table 2. Distribution of IDP households for face-to-face interviews Monthly assessments of situation with internally displaced persons (IDPs) in all oblasts of Ukraine are implemented within the framework of the EU-funded project ‘Comprehensive Stabilization Support to IDPs and the Affected Population in Ukraine’, implemented by the International Organization for Migration (IOM), Mission in Ukraine in partnership with the Ukrainian Center of Social Reforms. For more information please contact International Organization for Migration (IOM) Mission in Ukraine: 8 Mykhailivska Street, Kyiv, Ukraine, 01001 Tel: (044) 568-50-15 Fax: (044) 568-50-16 E-mail: iomkievcomm@iom.int