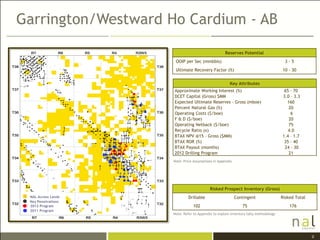
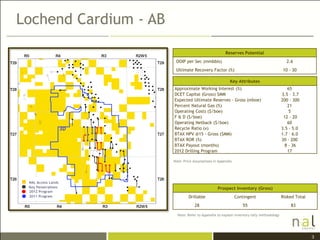
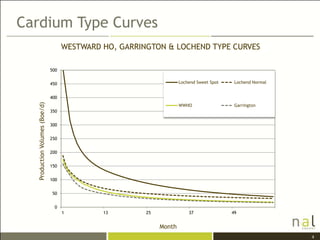
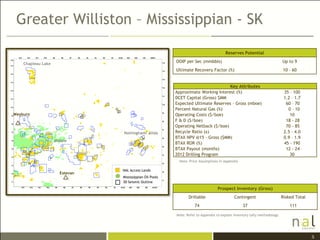
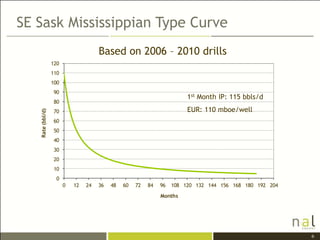
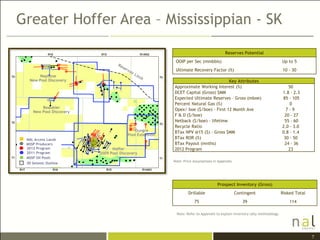
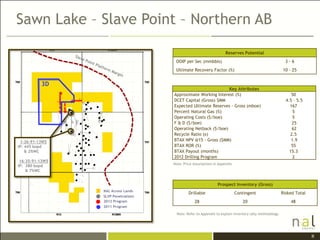
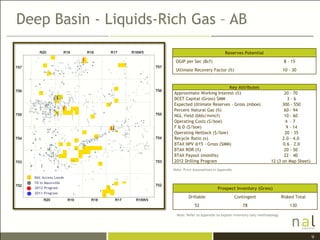
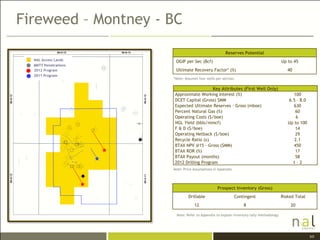
SlideShare a Scribd company logo
Operational Map Montages
Garrington/Westward Ho Cardium - AB

                                                    Reserves Potential
                      OOIP per Sec (mmbbls)                                             3-5
                      Ultimate Recovery Factor (%)                                    10 - 30


                                                       Key Attributes
                     Approximate Working Interest (%)                                  65 - 70
                     DCET Capital (Gross) $MM                                         3.0 – 3.3
                     Expected Ultimate Reserves - Gross (mboe)                          160
                     Percent Natural Gas (%)                                             20
                     Operating Costs ($/boe)                                              6
                     F & D ($/boe)                                                       20
                     Operating Netback ($/boe)                                           75
                     Recycle Ratio (x)                                                   4.0
                     BTAX NPV @15 - Gross ($MM)                                       1.4 – 1.7
                     BTAX ROR (%)                                                      35 - 40
                     BTAX Payout (months)                                              24 - 30
                     2012 Drilling Program                                               21
                     Note: Price Assumptions in Appendix


                                           Risked Prospect Inventory (Gross)
 NAL Access Lands             Drillable                    Contingent                 Risked Total
 Key Penetrations
 2012 Program                    102                           75                         176
 2011 Program
                     Note: Refer to Appendix to explain inventory tally methodology


                                                                                                     2
Lochend Cardium - AB

                                                        Reserves Potential
                          OOIP per Sec (mmbbls)                                               2.6
                          Ultimate Recovery Factor (%)                                      10 - 30

                                                          Key Attributes
                         Approximate Working Interest (%)                                      65
                         DCET Capital (Gross) $MM                                           3.5 – 3.7
                         Expected Ultimate Reserves - Gross (mboe)                          200 - 300
                         Percent Natural Gas (%)                                               21
                         Operating Costs ($/boe)                                                5
                         F & D ($/boe)                                                       12 - 20
                         Operating Netback ($/boe)                                             60
                    3D   Recycle Ratio (x)                                                  3.5 - 5.0
                         BTAX NPV @15 - Gross ($MM)                                         1.7 – 6.0
                         BTAX ROR (%)                                                       30 - 200
                         BTAX Payout (months)                                                 8 - 36
                         2012 Drilling Program                                                 17

                         Note: Price Assumptions in Appendix


 NAL Access Lands
 Key Penetrations                                  Prospect Inventory (Gross)
 2012 Program
 2011 Program                     Drillable                    Contingent                   Risked Total
                                     28                           55                            83

                           Note: Refer to Appendix to explain inventory tally methodology


                                                                                                           3
Cardium Type Curves
                                     WESTWARD HO, GARRINGTON & LOCHEND TYPE CURVES

                               500


                               450                                   Lochend Sweet Spot    Lochend Normal


                               400
  Production Volumes (Boe/d)


                                                                     WWHO                  Garrington
                               350


                               300


                               250


                               200


                               150


                               100


                               50


                                0
                                     1        13        25               37               49


                                                             Month
                                                                                                            4
Greater Williston – Mississippian - SK

                                                                                       Reserves Potential

    Chapleau Lake
                                                          OOIP per Sec (mmbbls)                                            Up to 9
                                                          Ultimate Recovery Factor (%)                                     10 - 60


                                                                                    Key Attributes
                                                          Approximate Working Interest (%)                                  35 – 100
                                                          DCET Capital (Gross) $MM                                          1.2 – 1.7
                                                          Expected Ultimate Reserves - Gross (mboe)                          60 – 70
                                                          Percent Natural Gas (%)                                             0 – 10
Weyburn                                                   Operating Costs ($/boe)                                              10
                                                          F & D ($/boe)                                                      18 - 28
                                                          Operating Netback ($/boe)                                          70 - 85
                                Nottingham/ Alida         Recycle Ratio (x)                                                 2.5 - 4.0
                                                          BTAX NPV @15 - Gross ($MM)                                        0.9 – 1.9
                    Midale
                                                          BTAX ROR (%)                                                      45 - 190
                                                          BTAX Payout (months)                                               12 - 24
                                                          2012 Drilling Program                                                30
                                                           Note: Price Assumptions in Appendix

                                NAL Access Lands
                      Estevan
                                Mississippian Oil Pools
                                3D Seismic Outline
                                                                                   Prospect Inventory (Gross)
                                                                 Drillable                   Contingent                    Risked Total
                                                                     74                           37                           111

                                                          Note: Refer to Appendix to explain inventory tally methodology


                                                                                                                                          5
SE Sask Mississippian Type Curve
                                      Based on 2006 – 2010 drills
                  120
                  110
                  100
                   90
                                                                         1st Month IP: 115 bbls/d
                   80
                   70                                                    EUR: 110 mboe/well
   Rate (bbl/d)


                   60
                   50
                   40
                   30
                   20
                   10
                    0
                        0   12   24   36   48   60   72   84   96   108 120 132 144 156 168 180 192 204
                                                               Months


                                                                                                          6
Greater Hoffer Area – Mississippian - SK

                                                                                       Reserves Potential
                                                         OOIP per Sec (mmbbls)                                            Up to 5
                                                         Ultimate Recovery Factor (%)                                     10 - 30
       Neptune
  New Pool Discovery                                                               Key Attributes
                                                        Approximate Working Interest (%)                                     50
                                                        DCET Capital (Gross) $MM                                          1.8 – 2.3
                                                        Expected Ultimate Reserves - Gross (mboe)                         85 - 105
                                                        Percent Natural Gas (%)                                               0
        Beaubier
    New Pool Discovery
                                                        Opex/ boe ($/boe) - First 12 Month Ave                              7-9
                                                        F & D ($/boe)                                                      20 - 27
                                                        Netback ($/boe) - lifetime                                         55 - 60
                                                        Recycle Ratio                                                     2.0 - 3.0
                                          Oungre        BTax NPV @15 ($) - Gross $MM                                      0.8 – 1.4
                                       Pool Extension
 NAL Access Lands                                       BTax ROR (%)                                                       30 - 50
 MSSP Producers                                         BTax Payout (mnths)                                                24 - 36
 2012 Program                  Hoffer                   2012 Program                                                         23
 2011 Program            2009 Pool Discovery
 MSSP Oil Pools
                                                        Note: Price Assumptions in Appendix
 3D Seismic Outline


                                                                                  Prospect Inventory (Gross)
                                                                Drillable                     Contingent                  Risked Total
                                                                    75                           39                           114

                                                         Note: Refer to Appendix to explain inventory tally methodology


                                                                                                                                         7
Sawn Lake – Slave Point – Northern AB

                                                                    Reserves Potential
                                      OOIP per Sec (mmbbls)                                              3-6
                                      Ultimate Recovery Factor (%)                                     10 - 25


          3D
                                                               Key Attributes
                                     Approximate Working Interest (%)                                       50
                                     DCET Capital (Gross) $MM                                            4.5 – 5.5
                                     Expected Ultimate Reserves - Gross (mboe)                             167
                                     Percent Natural Gas (%)                                                 5
                                     Operating Costs ($/boe)                                                 5
                                     F & D ($/boe)                                                           25
                                     Operating Netback ($/boe)                                               62
                                     Recycle Ratio (x)                                                      2.5
 1-26-91-13W5                        BTAX NPV @15 - Gross ($MM)                                             1.9
IP: 445 bopd                         BTAX ROR (%)                                                           55
    & 2%WC                           BTAX Payout (months)                                                  15.3
                                     2012 Drilling Program                                                   2
 16-35-91-13W5
                                     Note: Price Assumptions in Appendix
IP: 380 bopd
    & 7%WC


                                                               Prospect Inventory (Gross)
                 NAL Access Lands
                                              Drillable                    Contingent                  Risked Total
                 SLVP Penetrations
                 2012 Program                    28                           20                           48
                 2011 Program

                                      Note: Refer to Appendix to explain inventory tally methodology


                                                                                                                      8
Deep Basin - Liquids-Rich Gas – AB

                                                     Reserves Potential
                        OGIP per Sec (Bcf)                                                8 - 15
                        Ultimate Recovery Factor (%)                                     10 - 30


                                                 Key Attributes
                       Approximate Working Interest (%)                                 20 - 70
                       DCET Capital (Gross) $MM                                           3-6
                       Expected Ultimate Reserves - Gross (mboe)                       300 - 550
                       Percent Natural Gas (%)                                          60 - 94
                       NGL Yield (bbls/mmcf)                                            10 - 60
                       Operating Costs ($/boe)                                          4 -7
                       F & D ($/boe)                                                     9 - 14
                       Operating Netback ($/boe)                                        20 - 35
                       Recycle Ratio (x)                                               2.0 - 4.0
                       BTAX NPV @15 - Gross ($MM)                                      0.6 – 2.0
                       BTAX ROR (%)                                                     20 - 50
                       BTAX Payout (months)                                             22 – 40
                       2012 Drilling Program                                     12 (3 on Map Sheet)
                       Note: Price Assumptions in Appendix

  NAL Access Lands
  TD in Mannville
  2012 Program                                   Prospect Inventory (Gross)
  2011 Program
                                Drillable                    Contingent                  Risked Total
                                   52                           78                           130

                        Note: Refer to Appendix to explain inventory tally methodology


                                                                                                        9
Fireweed – Montney - BC

                                                      Reserves Potential
  NAL Access Lands     OGIP per Sec (Bcf)                                               Up to 45
  MNTY Penetrations
  2012 Program         Ultimate Recovery Factor* (%)                                       40
  2011 Program
                      *Note: Assumes four wells per section.

                                         Key Attributes (First Well Only)
                      Approximate Working Interest (%)                                        100
                      DCET Capital (Gross) $MM                                             6.5 – 8.0
                      Expected Ultimate Reserves - Gross (mboe)                               630
                      Percent Natural Gas (%)                                                 60
                      Operating Costs ($/boe)                                                  6
                      NGL Yield (bbls/mmcf)                                                Up to 100
                      F & D ($/boe)                                                           14
                      Operating Netback ($/boe)                                               29
                      Recycle Ratio (x)                                                       2.1
                      BTAX NPV @15 - Gross ($MM)                                              450
                      BTAX ROR (%)                                                            17
                      BTAX Payout (months)                                                    58
                      2012 Drilling Program                                                  1–2
                      Note: Price Assumptions in Appendix


                                                 Prospect Inventory (Gross)
                               Drillable                    Contingent                  Risked Total
                                  12                            8                           20

                       Note: Refer to Appendix to explain inventory tally methodology


                                                                                                       10

More Related Content

What's hot

AEP | Credit Suisse 2011 Energy Summit
AEP | Credit Suisse 2011 Energy SummitAEP | Credit Suisse 2011 Energy Summit
AEP | Credit Suisse 2011 Energy Summit
American Electric Power
 
NAL Energy - 2012 CIBC Presentation
NAL Energy - 2012 CIBC PresentationNAL Energy - 2012 CIBC Presentation
NAL Energy - 2012 CIBC Presentation
NALenergy
 
PEG_MorganStanley
PEG_MorganStanleyPEG_MorganStanley
PEG_MorganStanleyfinance20
 
102604EEIConference
102604EEIConference102604EEIConference
102604EEIConferencefinance20
 
valero energy Credit Suisse Energy Summit - February 5, 2009
valero energy Credit Suisse Energy Summit - February 5, 2009valero energy Credit Suisse Energy Summit - February 5, 2009
valero energy Credit Suisse Energy Summit - February 5, 2009finance2
 
Union Securities Research: Northern Graphite Corp. (TSXv: NGC)
Union Securities Research: Northern Graphite Corp. (TSXv: NGC)Union Securities Research: Northern Graphite Corp. (TSXv: NGC)
Union Securities Research: Northern Graphite Corp. (TSXv: NGC)Graphite Graphite
 
Gail india event update - 200410
Gail india   event update - 200410Gail india   event update - 200410
Gail india event update - 200410Angel Broking
 
Tph report on us shale gas j vs jan 2010
Tph report on us shale gas j vs   jan 2010Tph report on us shale gas j vs   jan 2010
Tph report on us shale gas j vs jan 2010PLSDerrickAdmin
 
dana holdings 0CA5D6ED-FF04-4642-9D47-81A0CF09F4AB_4Q08_ConfCall
dana holdings 0CA5D6ED-FF04-4642-9D47-81A0CF09F4AB_4Q08_ConfCalldana holdings 0CA5D6ED-FF04-4642-9D47-81A0CF09F4AB_4Q08_ConfCall
dana holdings 0CA5D6ED-FF04-4642-9D47-81A0CF09F4AB_4Q08_ConfCallfinance42
 
EP09_03LehmanFoshee_FINAL(Web)
EP09_03LehmanFoshee_FINAL(Web)EP09_03LehmanFoshee_FINAL(Web)
EP09_03LehmanFoshee_FINAL(Web)finance49
 
terex Gabelli120408
terex Gabelli120408terex Gabelli120408
terex Gabelli120408finance42
 
CMS Energy Third Quarter 2012 Results
CMS Energy Third Quarter 2012 ResultsCMS Energy Third Quarter 2012 Results
CMS Energy Third Quarter 2012 Results
twuphaus
 
dana holdings Q208Earnings_080708
dana holdings Q208Earnings_080708dana holdings Q208Earnings_080708
dana holdings Q208Earnings_080708finance42
 

What's hot (15)

AEP | Credit Suisse 2011 Energy Summit
AEP | Credit Suisse 2011 Energy SummitAEP | Credit Suisse 2011 Energy Summit
AEP | Credit Suisse 2011 Energy Summit
 
NAL Energy - 2012 CIBC Presentation
NAL Energy - 2012 CIBC PresentationNAL Energy - 2012 CIBC Presentation
NAL Energy - 2012 CIBC Presentation
 
PEG_MorganStanley
PEG_MorganStanleyPEG_MorganStanley
PEG_MorganStanley
 
102604EEIConference
102604EEIConference102604EEIConference
102604EEIConference
 
valero energy Credit Suisse Energy Summit - February 5, 2009
valero energy Credit Suisse Energy Summit - February 5, 2009valero energy Credit Suisse Energy Summit - February 5, 2009
valero energy Credit Suisse Energy Summit - February 5, 2009
 
2392
23922392
2392
 
Union Securities Research: Northern Graphite Corp. (TSXv: NGC)
Union Securities Research: Northern Graphite Corp. (TSXv: NGC)Union Securities Research: Northern Graphite Corp. (TSXv: NGC)
Union Securities Research: Northern Graphite Corp. (TSXv: NGC)
 
Gail india event update - 200410
Gail india   event update - 200410Gail india   event update - 200410
Gail india event update - 200410
 
Tph report on us shale gas j vs jan 2010
Tph report on us shale gas j vs   jan 2010Tph report on us shale gas j vs   jan 2010
Tph report on us shale gas j vs jan 2010
 
dana holdings 0CA5D6ED-FF04-4642-9D47-81A0CF09F4AB_4Q08_ConfCall
dana holdings 0CA5D6ED-FF04-4642-9D47-81A0CF09F4AB_4Q08_ConfCalldana holdings 0CA5D6ED-FF04-4642-9D47-81A0CF09F4AB_4Q08_ConfCall
dana holdings 0CA5D6ED-FF04-4642-9D47-81A0CF09F4AB_4Q08_ConfCall
 
EP09_03LehmanFoshee_FINAL(Web)
EP09_03LehmanFoshee_FINAL(Web)EP09_03LehmanFoshee_FINAL(Web)
EP09_03LehmanFoshee_FINAL(Web)
 
2Q06_RegG
2Q06_RegG2Q06_RegG
2Q06_RegG
 
terex Gabelli120408
terex Gabelli120408terex Gabelli120408
terex Gabelli120408
 
CMS Energy Third Quarter 2012 Results
CMS Energy Third Quarter 2012 ResultsCMS Energy Third Quarter 2012 Results
CMS Energy Third Quarter 2012 Results
 
dana holdings Q208Earnings_080708
dana holdings Q208Earnings_080708dana holdings Q208Earnings_080708
dana holdings Q208Earnings_080708
 

Similar to Nal operational map montages

Cabot Oil & Gas Investor Presentation - March 18, 2013
Cabot Oil & Gas Investor Presentation - March 18, 2013Cabot Oil & Gas Investor Presentation - March 18, 2013
Cabot Oil & Gas Investor Presentation - March 18, 2013
Marcellus Drilling News
 
Abo Oml125
Abo Oml125Abo Oml125
Abo Oml125ennioeni
 
ARC Resources - January 2013 Investor Presentation
ARC Resources - January 2013 Investor PresentationARC Resources - January 2013 Investor Presentation
ARC Resources - January 2013 Investor PresentationARC Resources
 
ARC Resources - December 2012 Investor Presentation
ARC Resources - December 2012 Investor PresentationARC Resources - December 2012 Investor Presentation
ARC Resources - December 2012 Investor PresentationARC Resources
 
alcoa 3Q08 Analyst Presentation
alcoa 3Q08 Analyst Presentation alcoa 3Q08 Analyst Presentation
alcoa 3Q08 Analyst Presentation finance8
 
Duratex - 1st Half 2007
Duratex - 1st Half 2007Duratex - 1st Half 2007
Duratex - 1st Half 2007
Duratex
 
Star Bulk Q3 2012 results presentation
Star Bulk Q3 2012 results presentationStar Bulk Q3 2012 results presentation
Star Bulk Q3 2012 results presentationTradeWindsnews
 
Financial Analysis - OGX Petroleo e Gas Participacoes SA is an oil and gas…
Financial Analysis - OGX Petroleo e Gas Participacoes SA is an oil and gas…Financial Analysis - OGX Petroleo e Gas Participacoes SA is an oil and gas…
Financial Analysis - OGX Petroleo e Gas Participacoes SA is an oil and gas…BCV
 
ARC Resources - February 2013 Investor Presentation
ARC Resources - February 2013 Investor PresentationARC Resources - February 2013 Investor Presentation
ARC Resources - February 2013 Investor PresentationARC Resources
 
01.06.2009 Presentation of Investor Relations Executive Manager, Theodore M....
01.06.2009  Presentation of Investor Relations Executive Manager, Theodore M....01.06.2009  Presentation of Investor Relations Executive Manager, Theodore M....
01.06.2009 Presentation of Investor Relations Executive Manager, Theodore M....Petrobras
 
Sintex ru2 qfy2011-121010
Sintex ru2 qfy2011-121010Sintex ru2 qfy2011-121010
Sintex ru2 qfy2011-121010Angel Broking
 
02 09-2008 Almir Guilherme Barbassa - Energy-Power Conference-Iehman Brothers...
02 09-2008 Almir Guilherme Barbassa - Energy-Power Conference-Iehman Brothers...02 09-2008 Almir Guilherme Barbassa - Energy-Power Conference-Iehman Brothers...
02 09-2008 Almir Guilherme Barbassa - Energy-Power Conference-Iehman Brothers...Petrobras
 
"Energy/Power Conference". Lehman Brothers
"Energy/Power Conference". Lehman Brothers "Energy/Power Conference". Lehman Brothers
"Energy/Power Conference". Lehman Brothers Petrobras
 
Braskem presentation 3_q08_20091201_en
Braskem presentation 3_q08_20091201_enBraskem presentation 3_q08_20091201_en
Braskem presentation 3_q08_20091201_enBraskem_RI
 
Braskem presentation 3_q08_20091201_en
Braskem presentation 3_q08_20091201_enBraskem presentation 3_q08_20091201_en
Braskem presentation 3_q08_20091201_enBraskem_RI
 
Conference call presentation 3 q08 results
Conference call presentation   3 q08 resultsConference call presentation   3 q08 results
Conference call presentation 3 q08 resultsBraskem_RI
 
Mitsubishi ufj securities_ing
Mitsubishi ufj securities_ingMitsubishi ufj securities_ing
Mitsubishi ufj securities_ingPetrobras
 

Similar to Nal operational map montages (20)

Cabot Oil & Gas Investor Presentation - March 18, 2013
Cabot Oil & Gas Investor Presentation - March 18, 2013Cabot Oil & Gas Investor Presentation - March 18, 2013
Cabot Oil & Gas Investor Presentation - March 18, 2013
 
Abo Oml125
Abo Oml125Abo Oml125
Abo Oml125
 
ARC Resources - January 2013 Investor Presentation
ARC Resources - January 2013 Investor PresentationARC Resources - January 2013 Investor Presentation
ARC Resources - January 2013 Investor Presentation
 
ARC Resources - December 2012 Investor Presentation
ARC Resources - December 2012 Investor PresentationARC Resources - December 2012 Investor Presentation
ARC Resources - December 2012 Investor Presentation
 
alcoa 3Q08 Analyst Presentation
alcoa 3Q08 Analyst Presentation alcoa 3Q08 Analyst Presentation
alcoa 3Q08 Analyst Presentation
 
Duratex - 1st Half 2007
Duratex - 1st Half 2007Duratex - 1st Half 2007
Duratex - 1st Half 2007
 
Star Bulk Q3 2012 results presentation
Star Bulk Q3 2012 results presentationStar Bulk Q3 2012 results presentation
Star Bulk Q3 2012 results presentation
 
Financial Analysis - OGX Petroleo e Gas Participacoes SA is an oil and gas…
Financial Analysis - OGX Petroleo e Gas Participacoes SA is an oil and gas…Financial Analysis - OGX Petroleo e Gas Participacoes SA is an oil and gas…
Financial Analysis - OGX Petroleo e Gas Participacoes SA is an oil and gas…
 
ARC Resources - February 2013 Investor Presentation
ARC Resources - February 2013 Investor PresentationARC Resources - February 2013 Investor Presentation
ARC Resources - February 2013 Investor Presentation
 
Tcw
TcwTcw
Tcw
 
01.06.2009 Presentation of Investor Relations Executive Manager, Theodore M....
01.06.2009  Presentation of Investor Relations Executive Manager, Theodore M....01.06.2009  Presentation of Investor Relations Executive Manager, Theodore M....
01.06.2009 Presentation of Investor Relations Executive Manager, Theodore M....
 
2324
23242324
2324
 
Sintex ru2 qfy2011-121010
Sintex ru2 qfy2011-121010Sintex ru2 qfy2011-121010
Sintex ru2 qfy2011-121010
 
02 09-2008 Almir Guilherme Barbassa - Energy-Power Conference-Iehman Brothers...
02 09-2008 Almir Guilherme Barbassa - Energy-Power Conference-Iehman Brothers...02 09-2008 Almir Guilherme Barbassa - Energy-Power Conference-Iehman Brothers...
02 09-2008 Almir Guilherme Barbassa - Energy-Power Conference-Iehman Brothers...
 
"Energy/Power Conference". Lehman Brothers
"Energy/Power Conference". Lehman Brothers "Energy/Power Conference". Lehman Brothers
"Energy/Power Conference". Lehman Brothers
 
BRCM
BRCMBRCM
BRCM
 
Braskem presentation 3_q08_20091201_en
Braskem presentation 3_q08_20091201_enBraskem presentation 3_q08_20091201_en
Braskem presentation 3_q08_20091201_en
 
Braskem presentation 3_q08_20091201_en
Braskem presentation 3_q08_20091201_enBraskem presentation 3_q08_20091201_en
Braskem presentation 3_q08_20091201_en
 
Conference call presentation 3 q08 results
Conference call presentation   3 q08 resultsConference call presentation   3 q08 results
Conference call presentation 3 q08 results
 
Mitsubishi ufj securities_ing
Mitsubishi ufj securities_ingMitsubishi ufj securities_ing
Mitsubishi ufj securities_ing
 

Nal operational map montages

  • 2. Garrington/Westward Ho Cardium - AB Reserves Potential OOIP per Sec (mmbbls) 3-5 Ultimate Recovery Factor (%) 10 - 30 Key Attributes Approximate Working Interest (%) 65 - 70 DCET Capital (Gross) $MM 3.0 – 3.3 Expected Ultimate Reserves - Gross (mboe) 160 Percent Natural Gas (%) 20 Operating Costs ($/boe) 6 F & D ($/boe) 20 Operating Netback ($/boe) 75 Recycle Ratio (x) 4.0 BTAX NPV @15 - Gross ($MM) 1.4 – 1.7 BTAX ROR (%) 35 - 40 BTAX Payout (months) 24 - 30 2012 Drilling Program 21 Note: Price Assumptions in Appendix Risked Prospect Inventory (Gross) NAL Access Lands Drillable Contingent Risked Total Key Penetrations 2012 Program 102 75 176 2011 Program Note: Refer to Appendix to explain inventory tally methodology 2
  • 3. Lochend Cardium - AB Reserves Potential OOIP per Sec (mmbbls) 2.6 Ultimate Recovery Factor (%) 10 - 30 Key Attributes Approximate Working Interest (%) 65 DCET Capital (Gross) $MM 3.5 – 3.7 Expected Ultimate Reserves - Gross (mboe) 200 - 300 Percent Natural Gas (%) 21 Operating Costs ($/boe) 5 F & D ($/boe) 12 - 20 Operating Netback ($/boe) 60 3D Recycle Ratio (x) 3.5 - 5.0 BTAX NPV @15 - Gross ($MM) 1.7 – 6.0 BTAX ROR (%) 30 - 200 BTAX Payout (months) 8 - 36 2012 Drilling Program 17 Note: Price Assumptions in Appendix NAL Access Lands Key Penetrations Prospect Inventory (Gross) 2012 Program 2011 Program Drillable Contingent Risked Total 28 55 83 Note: Refer to Appendix to explain inventory tally methodology 3
  • 4. Cardium Type Curves WESTWARD HO, GARRINGTON & LOCHEND TYPE CURVES 500 450 Lochend Sweet Spot Lochend Normal 400 Production Volumes (Boe/d) WWHO Garrington 350 300 250 200 150 100 50 0 1 13 25 37 49 Month 4
  • 5. Greater Williston – Mississippian - SK Reserves Potential Chapleau Lake OOIP per Sec (mmbbls) Up to 9 Ultimate Recovery Factor (%) 10 - 60 Key Attributes Approximate Working Interest (%) 35 – 100 DCET Capital (Gross) $MM 1.2 – 1.7 Expected Ultimate Reserves - Gross (mboe) 60 – 70 Percent Natural Gas (%) 0 – 10 Weyburn Operating Costs ($/boe) 10 F & D ($/boe) 18 - 28 Operating Netback ($/boe) 70 - 85 Nottingham/ Alida Recycle Ratio (x) 2.5 - 4.0 BTAX NPV @15 - Gross ($MM) 0.9 – 1.9 Midale BTAX ROR (%) 45 - 190 BTAX Payout (months) 12 - 24 2012 Drilling Program 30 Note: Price Assumptions in Appendix NAL Access Lands Estevan Mississippian Oil Pools 3D Seismic Outline Prospect Inventory (Gross) Drillable Contingent Risked Total 74 37 111 Note: Refer to Appendix to explain inventory tally methodology 5
  • 6. SE Sask Mississippian Type Curve Based on 2006 – 2010 drills 120 110 100 90 1st Month IP: 115 bbls/d 80 70 EUR: 110 mboe/well Rate (bbl/d) 60 50 40 30 20 10 0 0 12 24 36 48 60 72 84 96 108 120 132 144 156 168 180 192 204 Months 6
  • 7. Greater Hoffer Area – Mississippian - SK Reserves Potential OOIP per Sec (mmbbls) Up to 5 Ultimate Recovery Factor (%) 10 - 30 Neptune New Pool Discovery Key Attributes Approximate Working Interest (%) 50 DCET Capital (Gross) $MM 1.8 – 2.3 Expected Ultimate Reserves - Gross (mboe) 85 - 105 Percent Natural Gas (%) 0 Beaubier New Pool Discovery Opex/ boe ($/boe) - First 12 Month Ave 7-9 F & D ($/boe) 20 - 27 Netback ($/boe) - lifetime 55 - 60 Recycle Ratio 2.0 - 3.0 Oungre BTax NPV @15 ($) - Gross $MM 0.8 – 1.4 Pool Extension NAL Access Lands BTax ROR (%) 30 - 50 MSSP Producers BTax Payout (mnths) 24 - 36 2012 Program Hoffer 2012 Program 23 2011 Program 2009 Pool Discovery MSSP Oil Pools Note: Price Assumptions in Appendix 3D Seismic Outline Prospect Inventory (Gross) Drillable Contingent Risked Total 75 39 114 Note: Refer to Appendix to explain inventory tally methodology 7
  • 8. Sawn Lake – Slave Point – Northern AB Reserves Potential OOIP per Sec (mmbbls) 3-6 Ultimate Recovery Factor (%) 10 - 25 3D Key Attributes Approximate Working Interest (%) 50 DCET Capital (Gross) $MM 4.5 – 5.5 Expected Ultimate Reserves - Gross (mboe) 167 Percent Natural Gas (%) 5 Operating Costs ($/boe) 5 F & D ($/boe) 25 Operating Netback ($/boe) 62 Recycle Ratio (x) 2.5 1-26-91-13W5 BTAX NPV @15 - Gross ($MM) 1.9 IP: 445 bopd BTAX ROR (%) 55 & 2%WC BTAX Payout (months) 15.3 2012 Drilling Program 2 16-35-91-13W5 Note: Price Assumptions in Appendix IP: 380 bopd & 7%WC Prospect Inventory (Gross) NAL Access Lands Drillable Contingent Risked Total SLVP Penetrations 2012 Program 28 20 48 2011 Program Note: Refer to Appendix to explain inventory tally methodology 8
  • 9. Deep Basin - Liquids-Rich Gas – AB Reserves Potential OGIP per Sec (Bcf) 8 - 15 Ultimate Recovery Factor (%) 10 - 30 Key Attributes Approximate Working Interest (%) 20 - 70 DCET Capital (Gross) $MM 3-6 Expected Ultimate Reserves - Gross (mboe) 300 - 550 Percent Natural Gas (%) 60 - 94 NGL Yield (bbls/mmcf) 10 - 60 Operating Costs ($/boe) 4 -7 F & D ($/boe) 9 - 14 Operating Netback ($/boe) 20 - 35 Recycle Ratio (x) 2.0 - 4.0 BTAX NPV @15 - Gross ($MM) 0.6 – 2.0 BTAX ROR (%) 20 - 50 BTAX Payout (months) 22 – 40 2012 Drilling Program 12 (3 on Map Sheet) Note: Price Assumptions in Appendix NAL Access Lands TD in Mannville 2012 Program Prospect Inventory (Gross) 2011 Program Drillable Contingent Risked Total 52 78 130 Note: Refer to Appendix to explain inventory tally methodology 9
  • 10. Fireweed – Montney - BC Reserves Potential NAL Access Lands OGIP per Sec (Bcf) Up to 45 MNTY Penetrations 2012 Program Ultimate Recovery Factor* (%) 40 2011 Program *Note: Assumes four wells per section. Key Attributes (First Well Only) Approximate Working Interest (%) 100 DCET Capital (Gross) $MM 6.5 – 8.0 Expected Ultimate Reserves - Gross (mboe) 630 Percent Natural Gas (%) 60 Operating Costs ($/boe) 6 NGL Yield (bbls/mmcf) Up to 100 F & D ($/boe) 14 Operating Netback ($/boe) 29 Recycle Ratio (x) 2.1 BTAX NPV @15 - Gross ($MM) 450 BTAX ROR (%) 17 BTAX Payout (months) 58 2012 Drilling Program 1–2 Note: Price Assumptions in Appendix Prospect Inventory (Gross) Drillable Contingent Risked Total 12 8 20 Note: Refer to Appendix to explain inventory tally methodology 10