Download as PDF, PPTX
![EXPERIMENTS – PHASE II
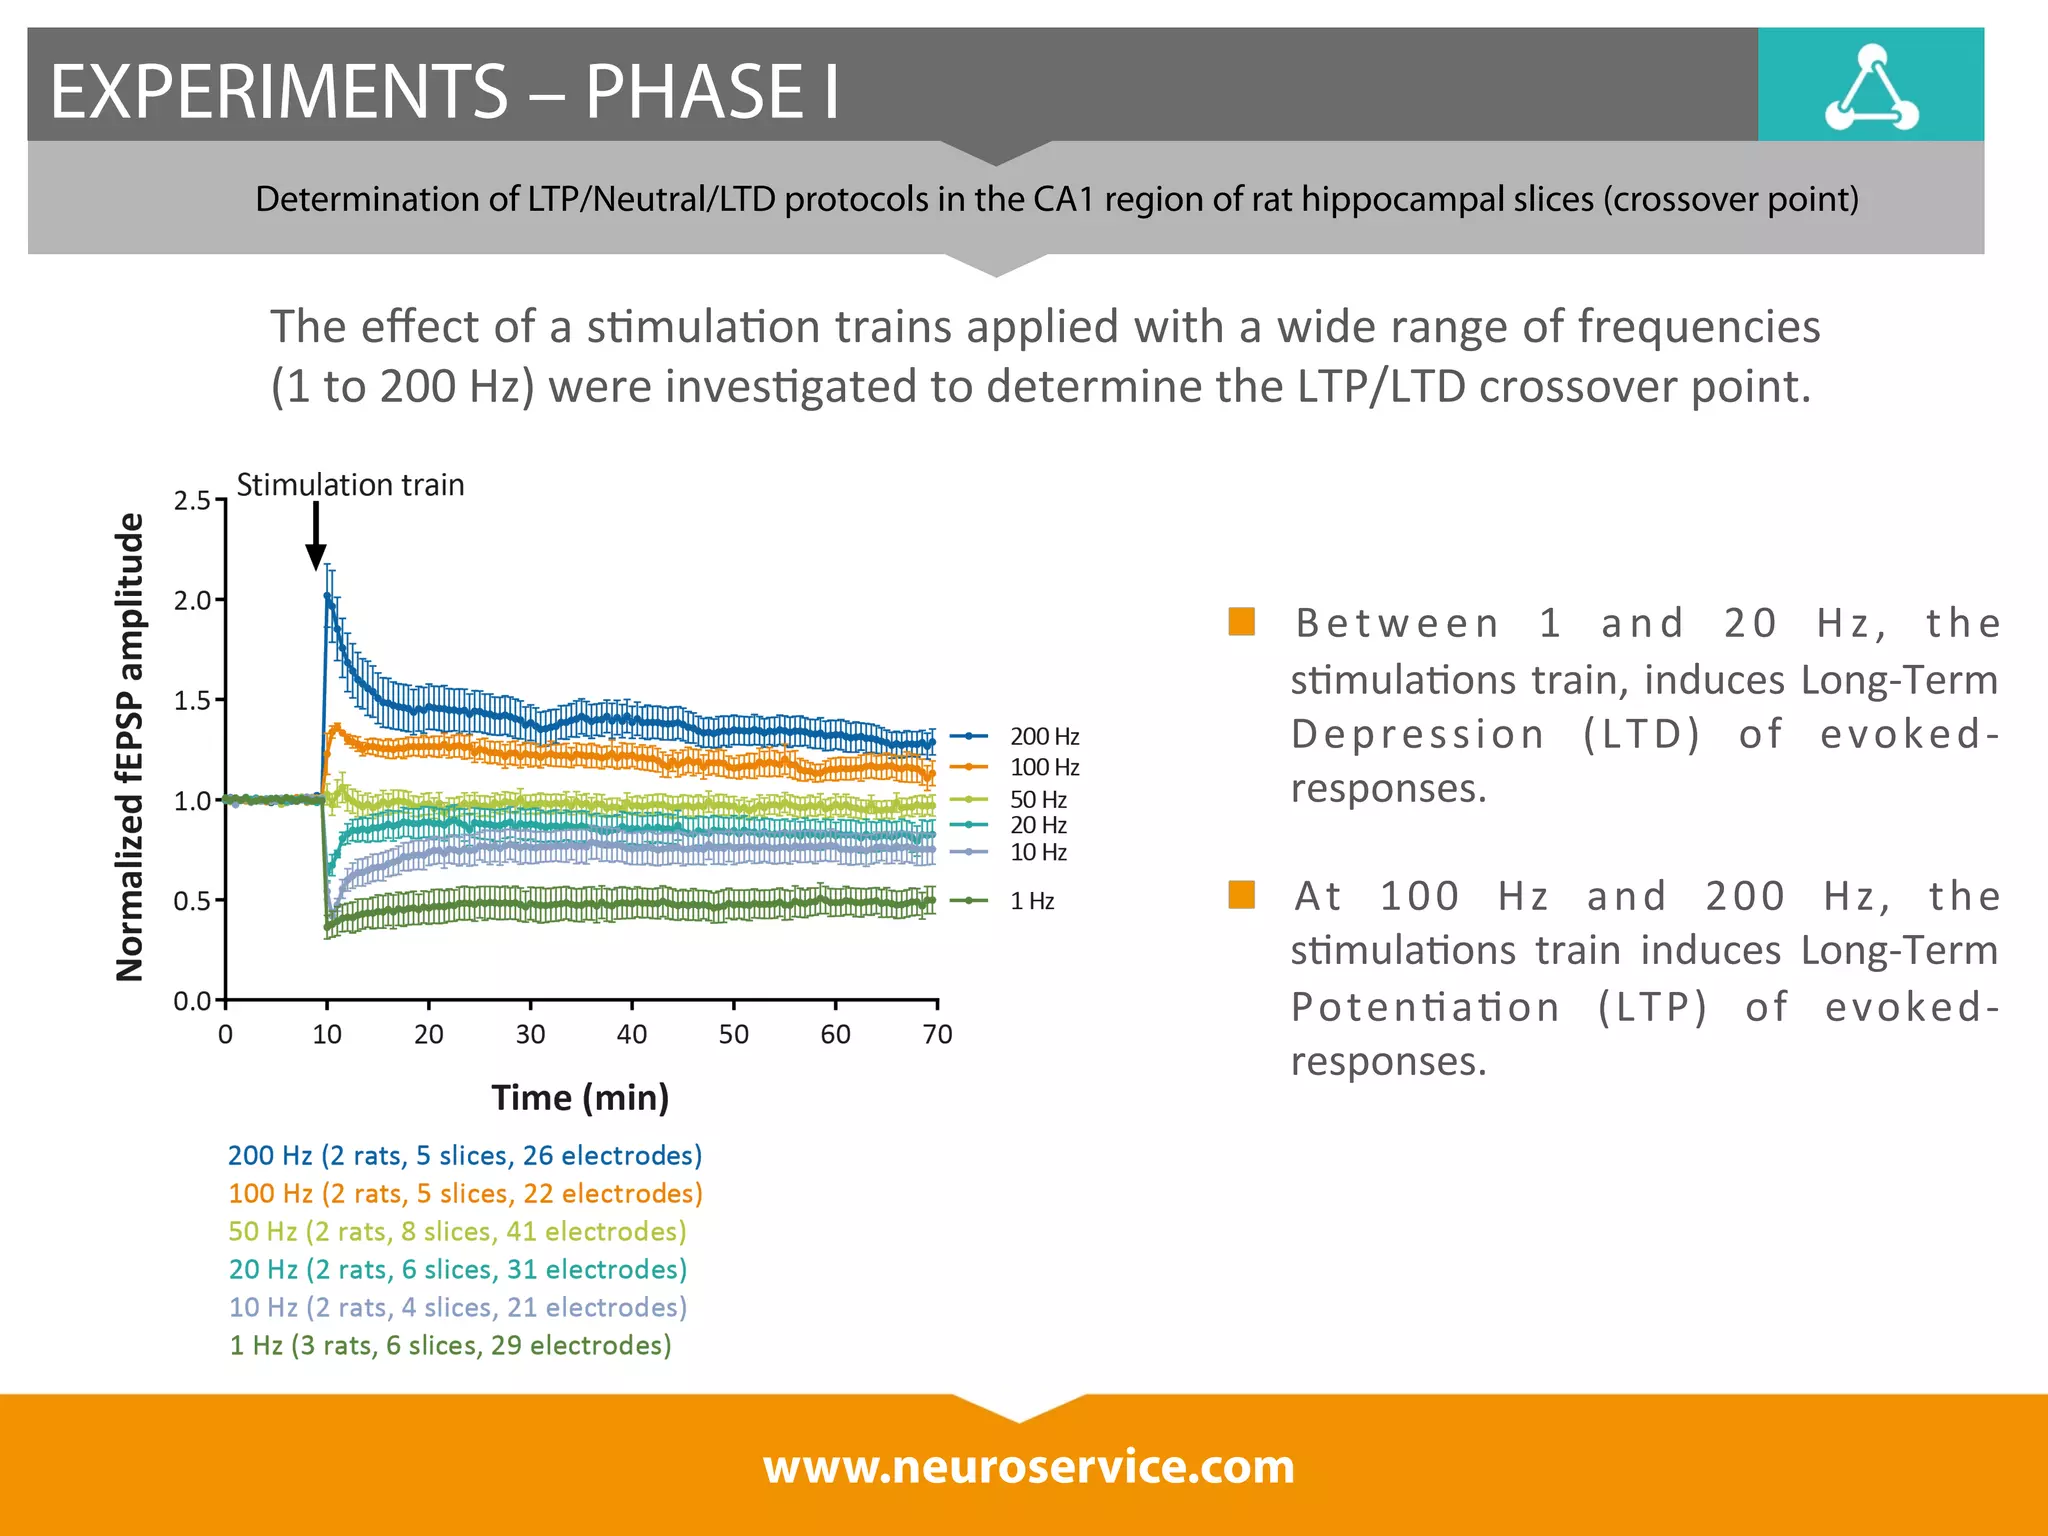
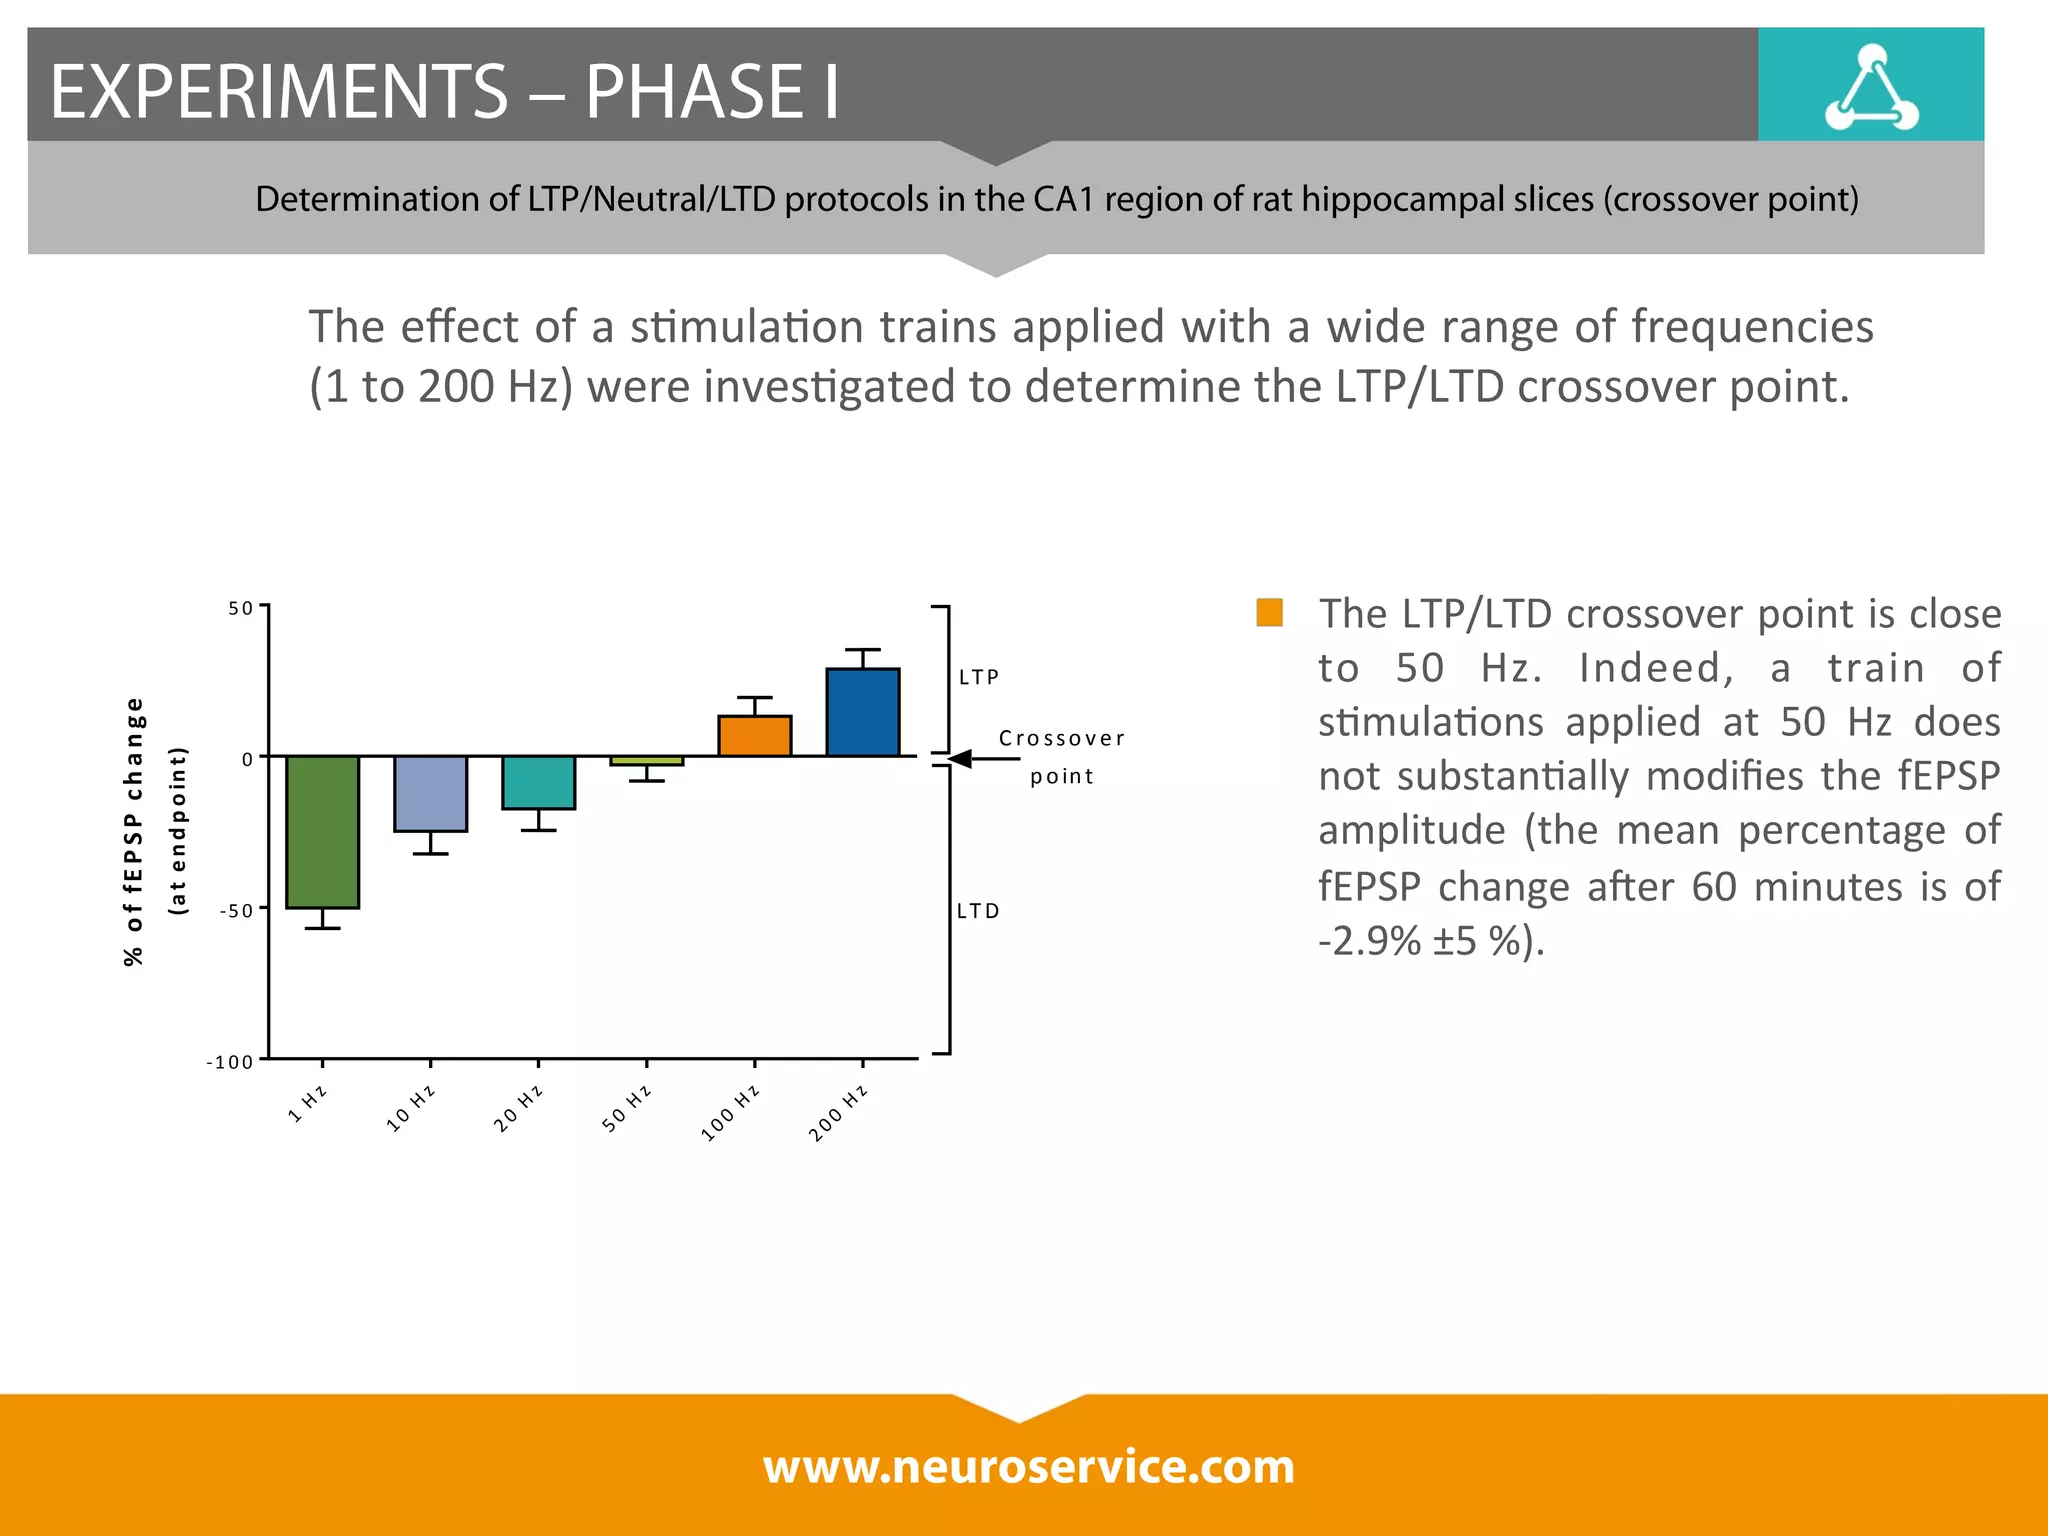
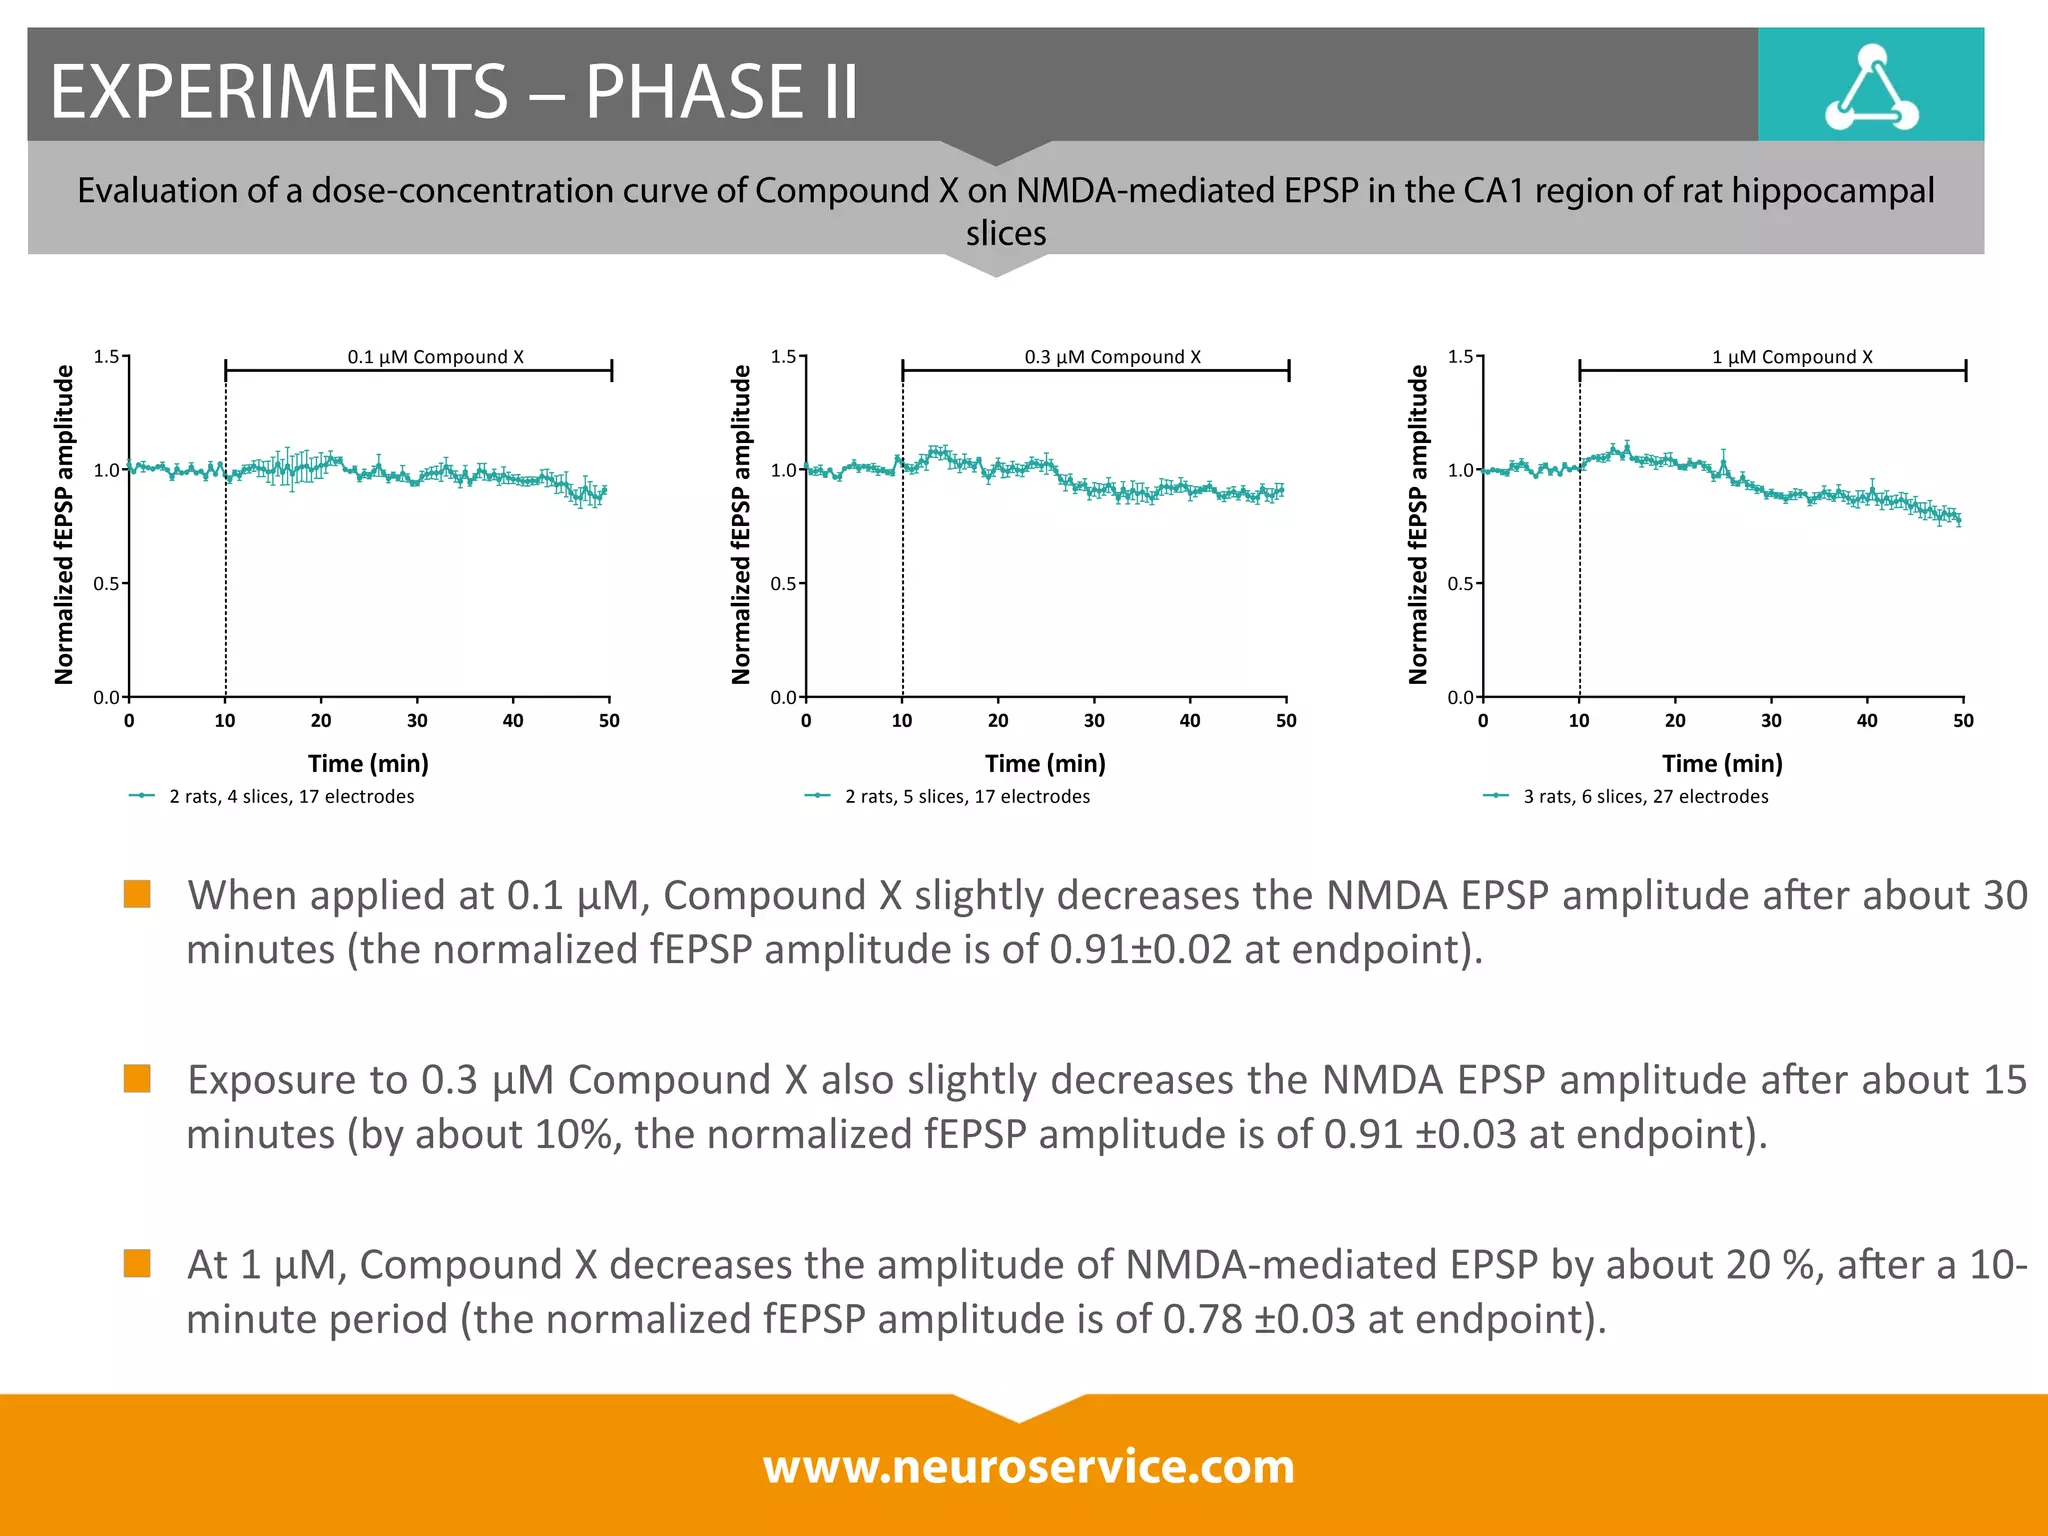
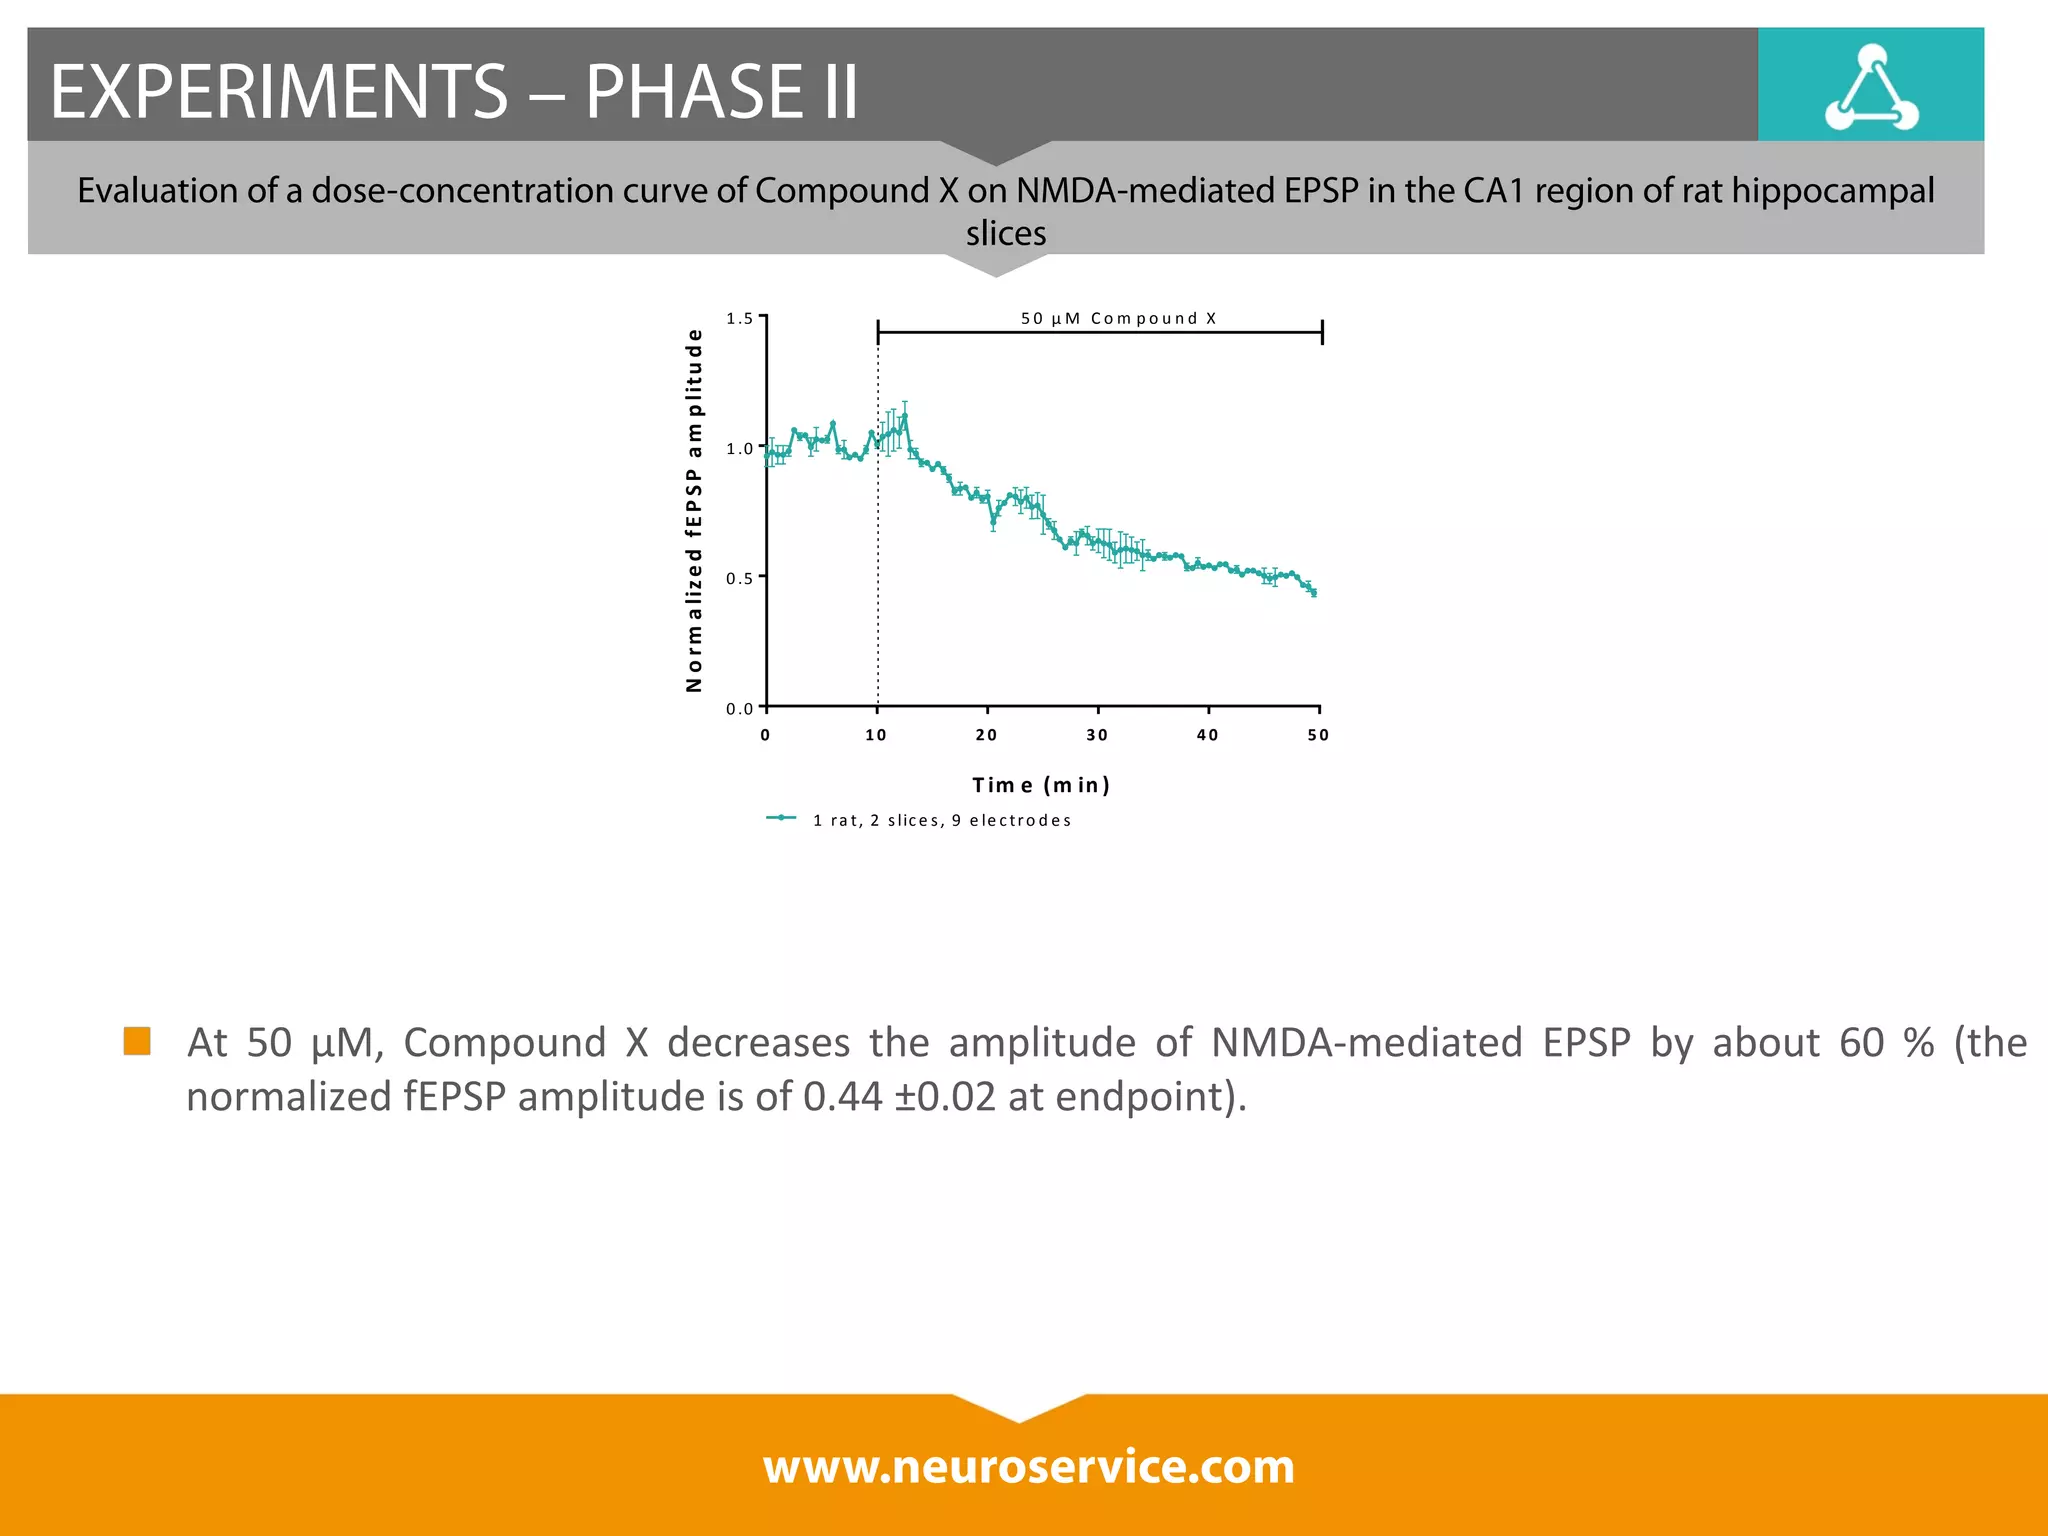
Evaluation of a dose-concentration curve of Compound X on NMDA-mediated EPSP in the CA1 region of rat hippocampal
1 .0
0 .8
0 .6
0 .4
0 .2
Compound
X
dose-‐dependently
decreases
the
amplitude
of
NMDA-‐mediated
EPSP,
with
an
www.neuroservice.com
IC50
of
3.6
μM.
The
top
of
the
concentra*on-‐response
curve
seems
reached
with
30-‐50
μM
Compound
X.
slices
1 .5 C o m p o u n d
X
T im e (m in )
N o rm a liz e d fE P S P am p litu d e
0 1 0 2 0 3 0 4 0 5 0
1 .0
0 .5
0 .0
0 .1
μ M
0 .3
μ M
1
μ M
3
μ M
1 0
μ M
3 0
μ M
5 0
μ M
L o g [C om p o u n d X ] (M )
% o f b a s e lin e fE P S P
a fte r 4 0 ' e x p o su re
-‐7 -‐6 -‐5 -‐4
0 .0](https://image.slidesharecdn.com/mea-evaluationofcompoundsonnmdareceptors-neuroservice-141209023116-conversion-gate02/75/Multi-Electrode-Array-technique-Evaluation-of-compounds-on-NMDA-receptors-10-2048.jpg)

The document describes experiments evaluating the effects of Compound X, a NMDA modulator, on long-term potentiation (LTP) and depression (LTD) in rat hippocampal slices. First, the LTP/LTD crossover point of about 50 Hz is determined. Compound X concentration-dependently decreases NMDA-mediated EPSP, with an IC50 of 3.6 μM. Compound X at concentrations of 0.3-3 μM slightly decreases the amplitude of LTP induced by 100 Hz stimulation compared to controls.


![Neuroservice Presentation Nov 08 [Mode De Compatibilité]](https://cdn.slidesharecdn.com/ss_thumbnails/neuroservice-presentationnov-08-mode-de-compatibilit-1226317912183586-8-thumbnail.jpg?width=640&height=640&fit=bounds)


