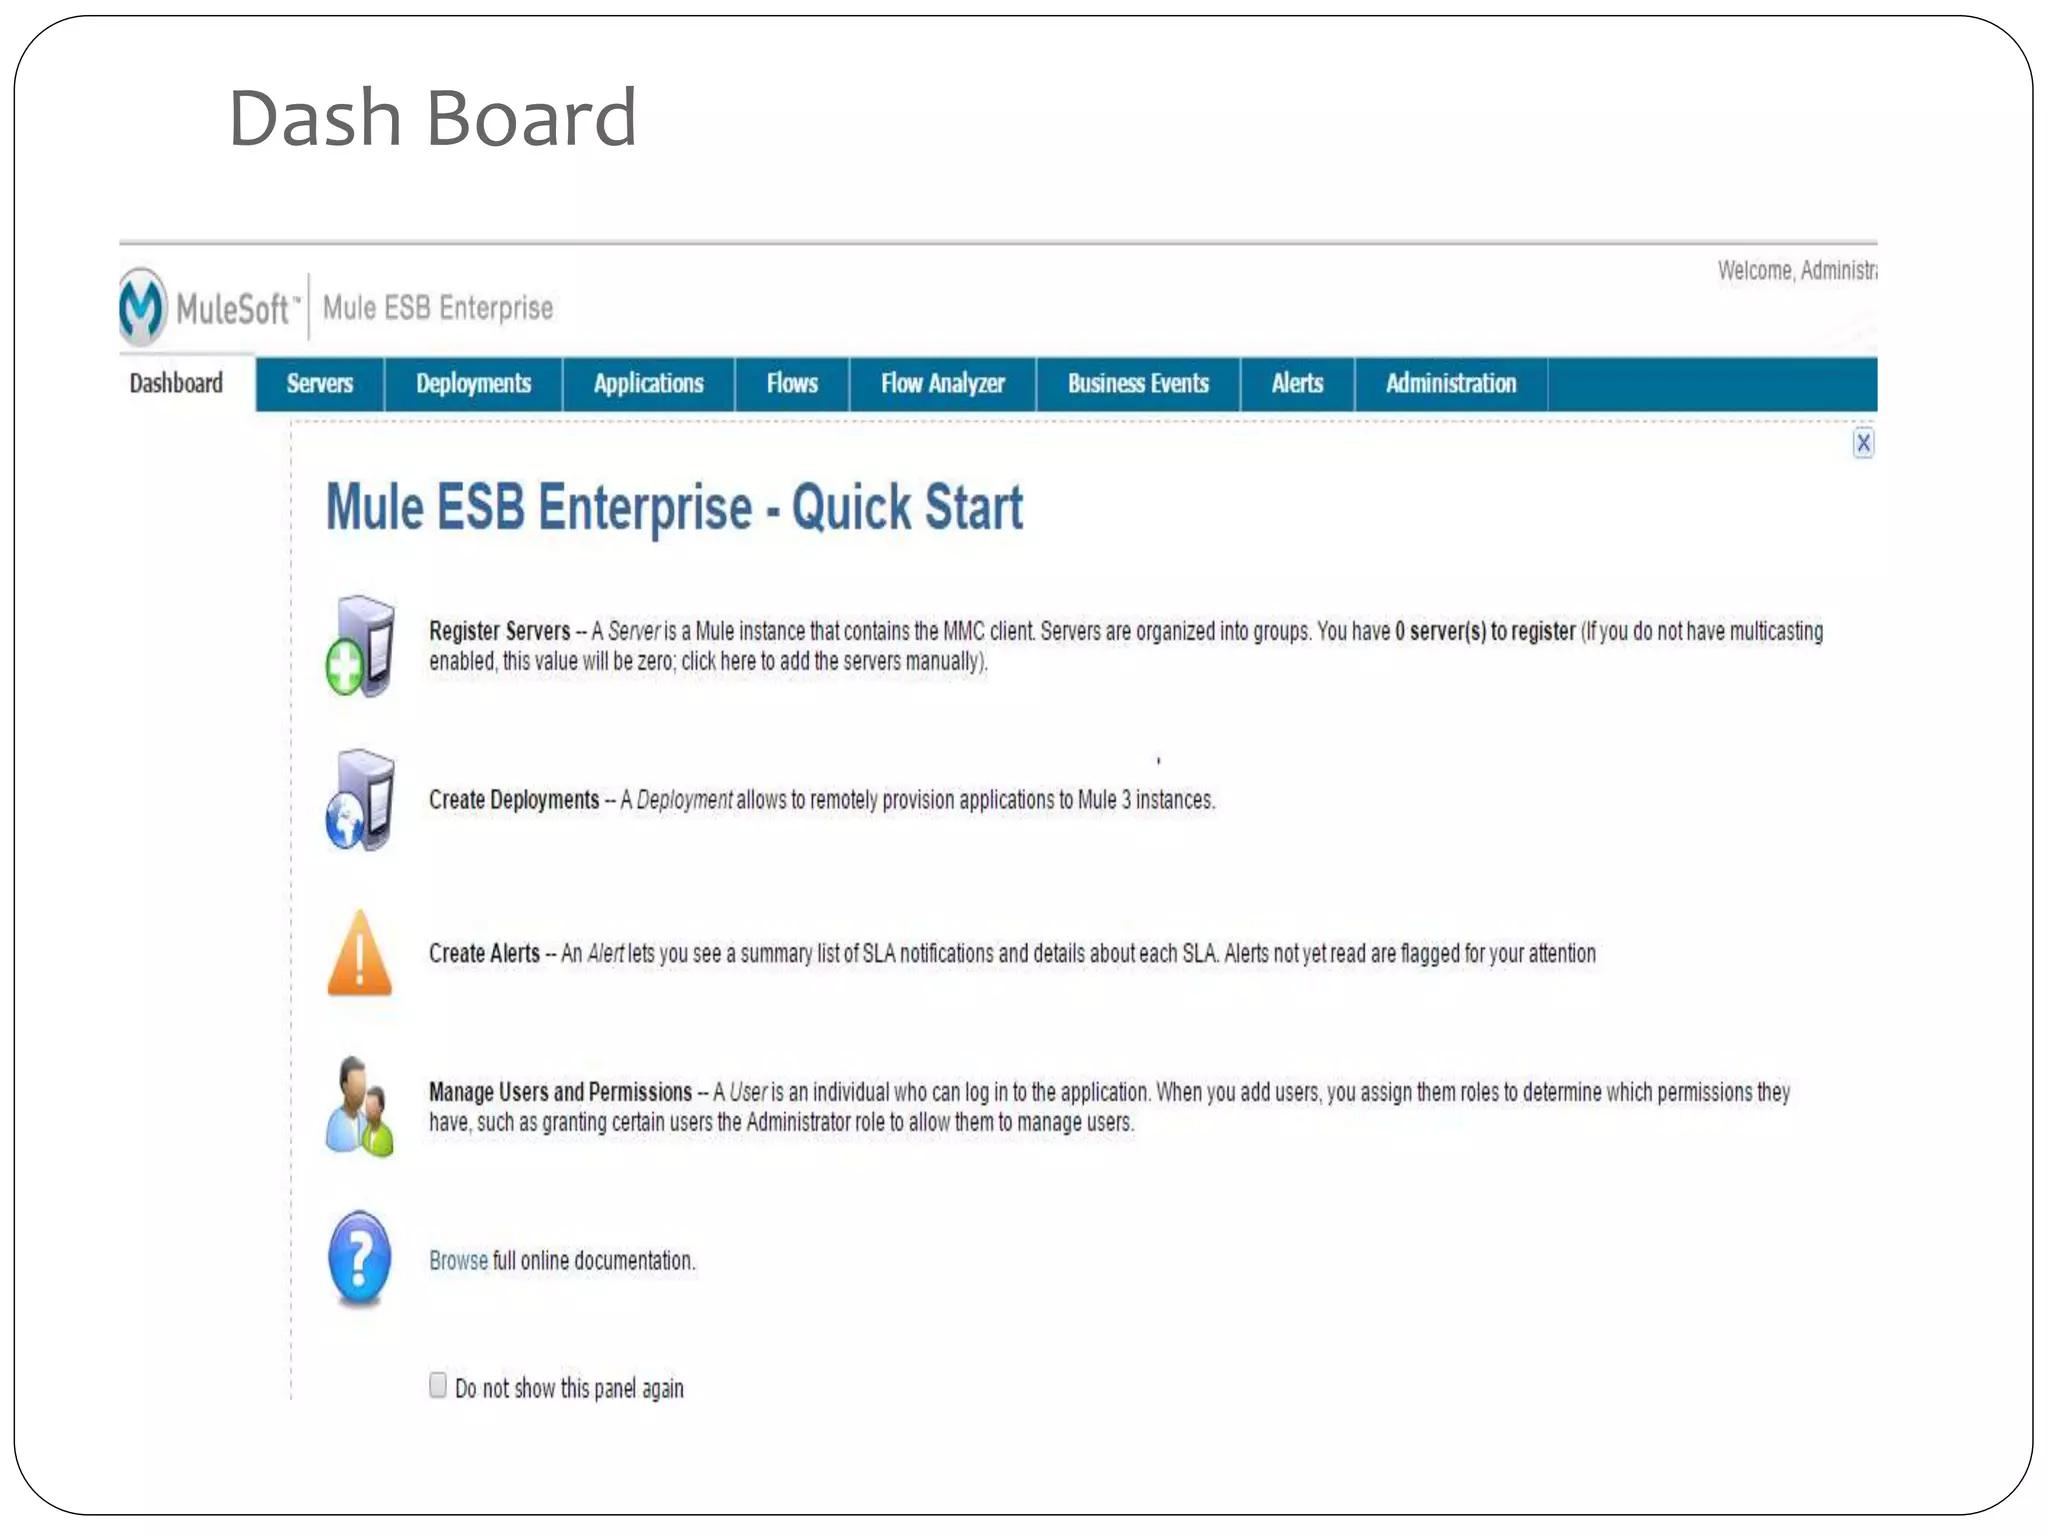
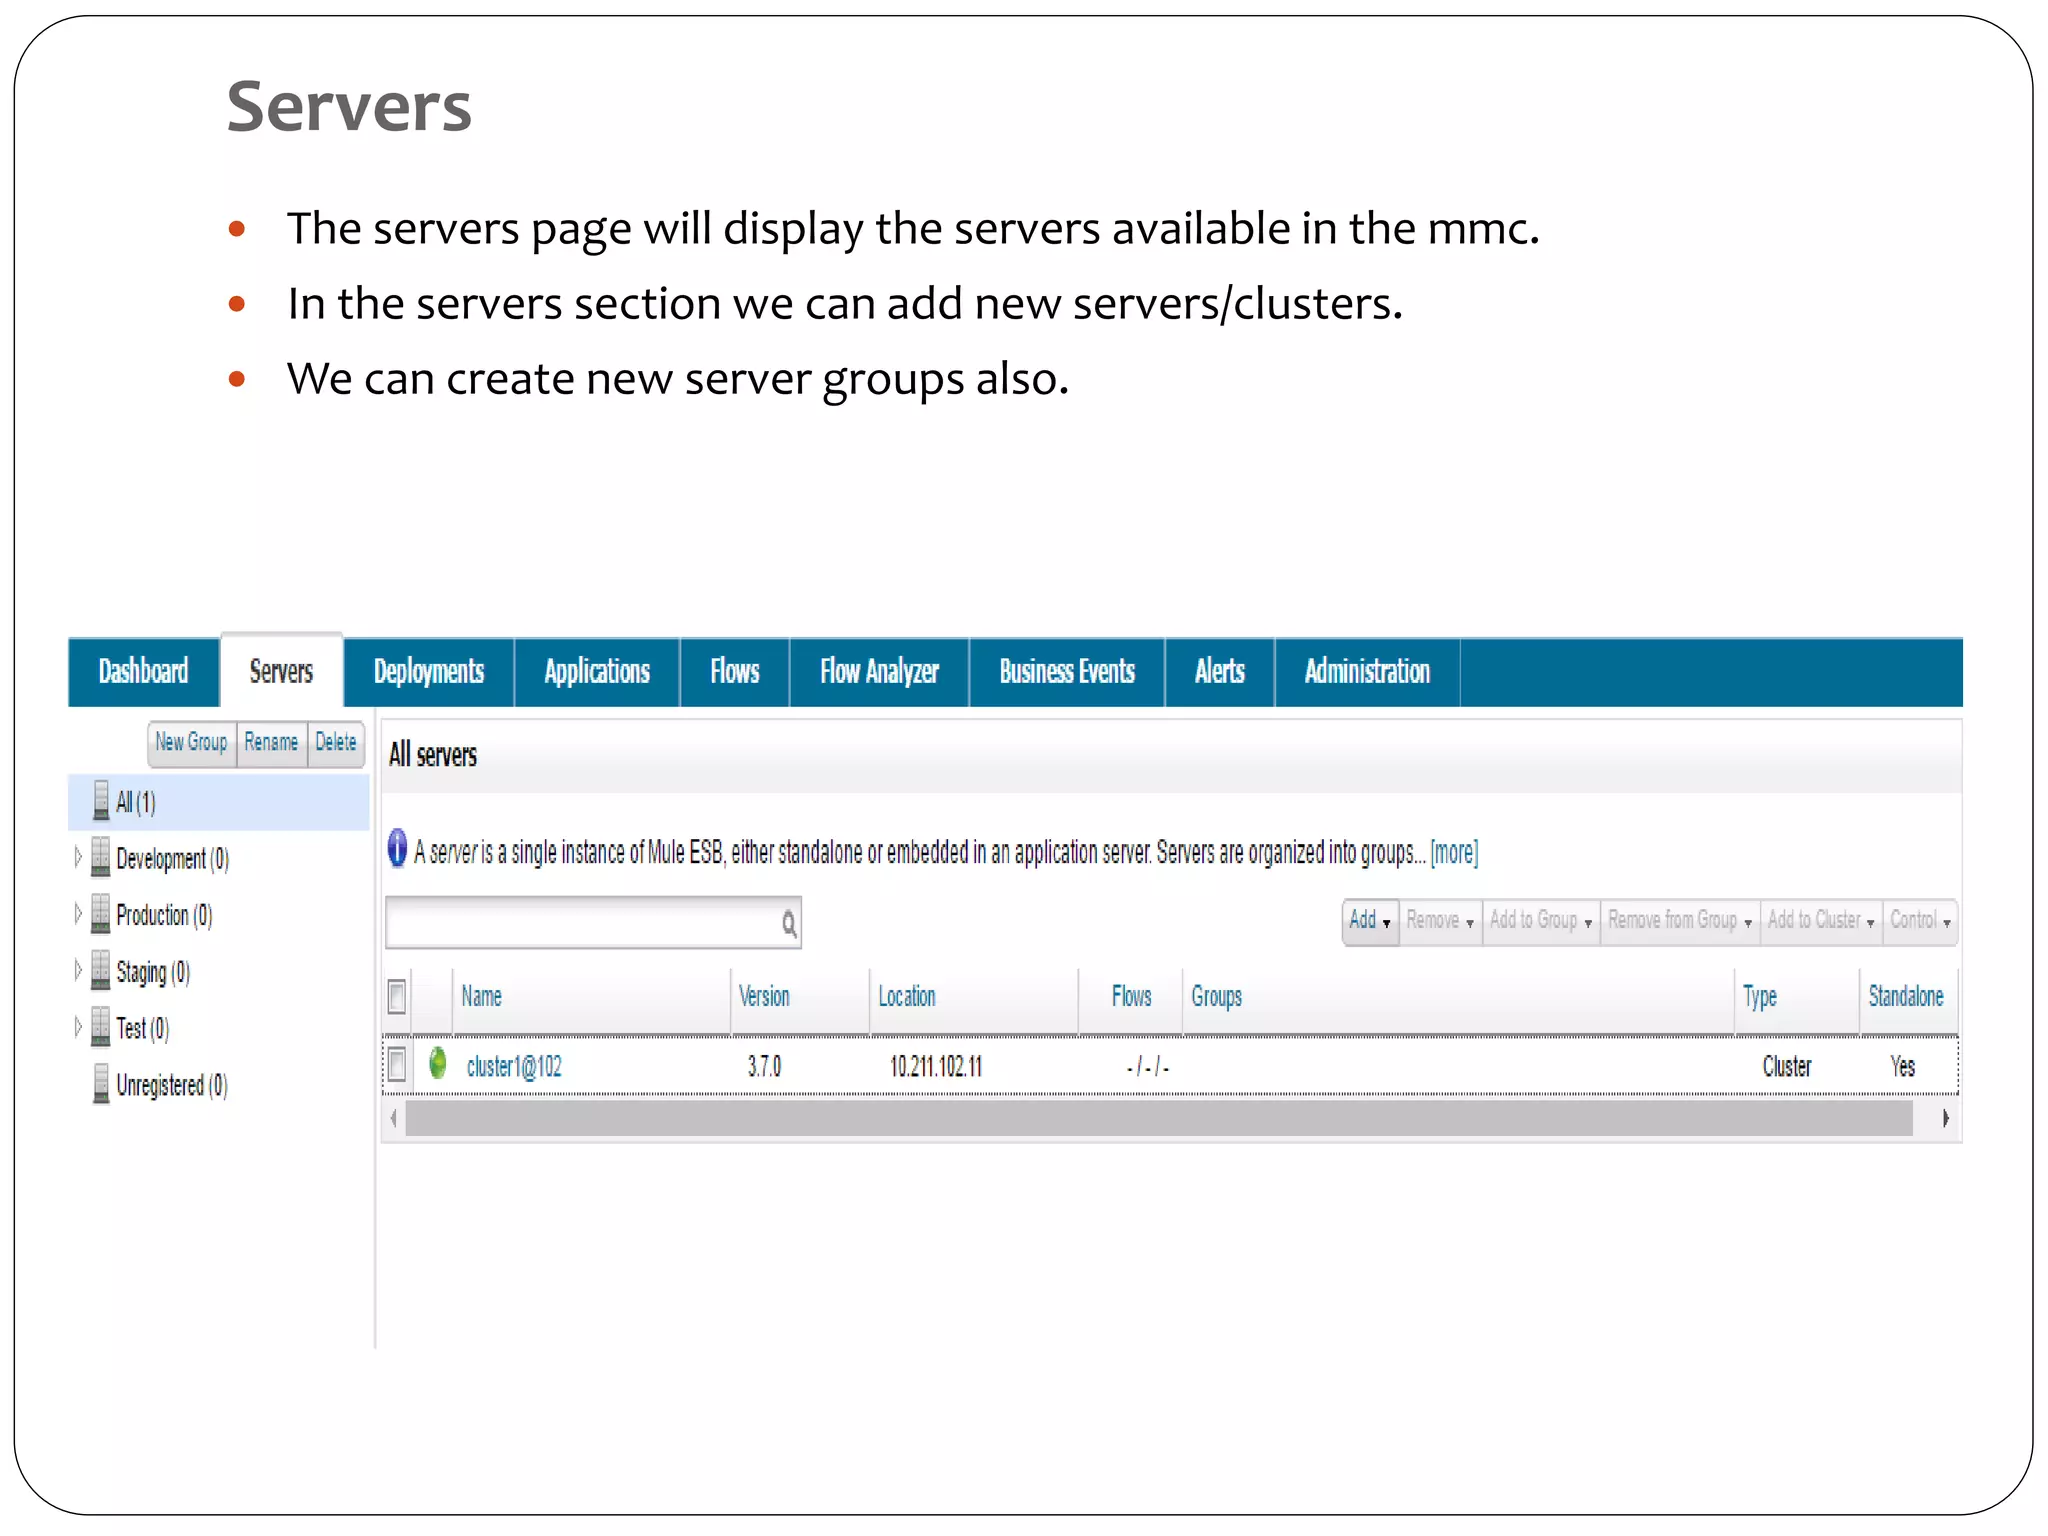
Vaddanam Venkata Srinivasa Rao
Mule Management Console
Agenda
Home page
 Login to the Mule MMC console by providing the username and the password
(admin, admin)
Dash Board
Servers
 The servers page will display the servers available in the mmc.
 In the servers section we can add new servers/clusters.
 We can create new server groups also.
Servers info cont ….
 Click on the server available in the servers to get the information about the
servers.
 In the application tab we will be getting the information about the applications that
were deployed.
 Alerts tab will be showing the alerts that were triggered on the server.
 Memory tab will display the memory utilization levels of the server.
 Threads tab will be displaying the threads available in the system and it’s state.
 Files tab will be giving information about the files available in the server.
 Apps folder will having the files of the applications that were deployed.
 Bin folder will be having all the binary files in the server.
 Log folder will be having information about the logs that were formed when an application is developed or
deployed.
 Plugins folder will be having the plugins deployed on the server.
Deployments
 Deployments tab will be having the information about the deployments that
were done on the mmc.
 We can add new deployments in this tab by using New option present in this
page.
 We can un-deploy a deployment that is currently active.
 We can deploy new applications from repository or from a location
Flow Analyzer
 In flow analyzer tab we can analyze the flow that
we need to trace.
 We need to select the time we need to analyze
the application .
 We need to select the server in which we need to
do the flow analysis.
 We need to select the application we need to
analyze and then select the option “start” and this
will start the flow analysis.
Business Events
 We use business events tab to retrieve information, such as processing time
and errors, for business transactions and events on your Mule servers.
 From the MMC, click the Business Events tab and the screen above will appear.
You can select a variable to search by clicking the drop-down box:
Alerts Tab
 Use the Alerts tab to view and manage alerts or SLAs.
 The View Raised Alerts pane shows the following information about each
alert:
 Severity of the alert. The severity of an alert is set when the alert is created,
and can be one of the following: Fatal, Critical, Major, Minor, Information.
 Server (or server group) on which the alert occurred
 Name of the alert, per the alert definition
 Description, per the alert definition.
 Date, which is a time stamp indicating the date and time the alert was
raised
Administration Tab
 The Administration tab lets you manage users and user groups, as well as set up
and schedule utility scripts.
Thank You

Mule management console

  • 1.
    Vaddanam Venkata SrinivasaRao Mule Management Console
  • 2.
  • 3.
    Home page  Loginto the Mule MMC console by providing the username and the password (admin, admin)
  • 4.
  • 5.
    Servers  The serverspage will display the servers available in the mmc.  In the servers section we can add new servers/clusters.  We can create new server groups also.
  • 6.
    Servers info cont….  Click on the server available in the servers to get the information about the servers.  In the application tab we will be getting the information about the applications that were deployed.  Alerts tab will be showing the alerts that were triggered on the server.  Memory tab will display the memory utilization levels of the server.  Threads tab will be displaying the threads available in the system and it’s state.  Files tab will be giving information about the files available in the server.  Apps folder will having the files of the applications that were deployed.  Bin folder will be having all the binary files in the server.  Log folder will be having information about the logs that were formed when an application is developed or deployed.  Plugins folder will be having the plugins deployed on the server.
  • 7.
    Deployments  Deployments tabwill be having the information about the deployments that were done on the mmc.  We can add new deployments in this tab by using New option present in this page.  We can un-deploy a deployment that is currently active.  We can deploy new applications from repository or from a location
  • 8.
    Flow Analyzer  Inflow analyzer tab we can analyze the flow that we need to trace.  We need to select the time we need to analyze the application .  We need to select the server in which we need to do the flow analysis.  We need to select the application we need to analyze and then select the option “start” and this will start the flow analysis.
  • 9.
    Business Events  Weuse business events tab to retrieve information, such as processing time and errors, for business transactions and events on your Mule servers.  From the MMC, click the Business Events tab and the screen above will appear. You can select a variable to search by clicking the drop-down box:
  • 10.
    Alerts Tab  Usethe Alerts tab to view and manage alerts or SLAs.  The View Raised Alerts pane shows the following information about each alert:  Severity of the alert. The severity of an alert is set when the alert is created, and can be one of the following: Fatal, Critical, Major, Minor, Information.  Server (or server group) on which the alert occurred  Name of the alert, per the alert definition  Description, per the alert definition.  Date, which is a time stamp indicating the date and time the alert was raised
  • 11.
    Administration Tab  TheAdministration tab lets you manage users and user groups, as well as set up and schedule utility scripts.
  • 12.