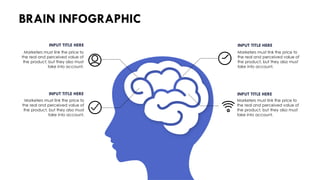
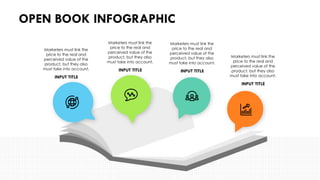
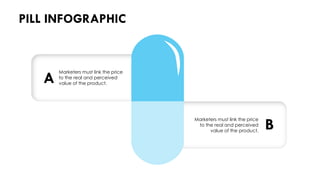
Motivation refers to the internal or external factors that drive and energize individuals to take action, set goals, and persist in achieving them. It plays a crucial role in personal and professional growth, productivity, and overall well-being. Here are some key aspects of motivation:
Intrinsic and Extrinsic Motivation: Motivation can be categorized into two types: intrinsic and extrinsic. Intrinsic motivation comes from within and is driven by personal satisfaction, enjoyment, or a sense of fulfillment. Extrinsic motivation, on the other hand, comes from external rewards or incentives such as recognition, money, or praise.
Needs and Goals: Motivation often arises from needs and goals. Maslow's Hierarchy of Needs suggests that individuals are motivated by a progression of needs, starting from basic physiological needs (e.g., food, shelter) to higher-level needs such as belongingness, self-esteem, and self-actualization. Setting clear and meaningful goals that align with these needs can provide direction and drive motivation.
Self-Determination Theory: Self-Determination Theory proposes that intrinsic motivation is fostered by three psychological needs: autonomy, competence, and relatedness. Autonomy refers to the need for control and choice in one's actions, competence is the need to feel capable and effective, and relatedness is the need for social connections and belongingness.
Goal Setting: Setting specific, challenging, and achievable goals is a powerful motivator. Goals provide a clear target, create a sense of purpose, and help individuals track their progress. Implementing strategies like SMART (Specific, Measurable, Achievable, Relevant, Time-bound) goals can enhance motivation and increase the likelihood of success.
Positive Reinforcement: Positive reinforcement involves providing rewards, recognition, or praise for desired behaviors or achievements. It can enhance motivation by reinforcing positive actions and outcomes, making individuals more likely to continue those behaviors.
Growth Mindset: Adopting a growth mindset, as proposed by psychologist Carol Dweck, can enhance motivation. A growth mindset is the belief that abilities and intelligence can be developed through effort, learning, and perseverance. It encourages embracing challenges, seeing failures as learning opportunities, and persisting in the face of setbacks.
Self-Efficacy: Self-efficacy refers to an individual's belief in their ability to succeed in specific tasks or situations. When individuals have a high level of self-efficacy, they are more motivated to take on challenges, exert effort, and persevere, leading to increased performance and achievement.
Environment and Support: The environment and social support play a significant role in motivation. Creating a supportive and positive environment, fostering collaboration and teamwork, providing feedback and constructive criticism, and offering resources and opportunities for growth can enhance motivation and en
Certainly! Here's an overview of the pros and cons of using infographics:
Pros of Infographics:
Visual Appeal: Infographics are visually engaging and can quickly grab the attention of viewers. They use colors, icons, illustrations, and typography to present information in an aesthetically pleasing manner.
Simplifies Complex Information: Infographics are effective at simplifying complex data or concepts. They can condense large amounts of information into easily understandable and digestible visuals, making it easier for viewers to grasp the main points.
Enhances Retention and Comprehension: Visual elements in infographics help enhance information retention and comprehension. By combining text with visuals, infographics engage both the visual and verbal parts of the brain, making it easier for viewers to remember and understand the content.
Increases Information Sharing: Infographics are highly shareable on social media platforms, blogs, websites, and presentations. Their visual appeal makes them more likely to be shared, increasing the reach and visibility of the information or message being conveyed.
Grabs Attention in a Time-Efficient Manner: In today's fast-paced world, infographics can quickly convey key information within seconds or a few glances. They are ideal for capturing the attention of busy viewers who may be scanning through content.
Cons of Infographics:
Simplification Can Lead to Oversimplification: While infographics excel at simplifying complex information, there is a risk of oversimplification. Important nuances and details may be left out in favor of brevity, potentially leading to a loss of accuracy or depth.
Design Challenges: Creating visually appealing and effective infographics requires design skills or access to design tools. Without the necessary design expertise, infographics may not be as impactful or well-executed.
Limited Amount of Information: Due to their visual nature, infographics have limited space to convey information. They are best suited for presenting high-level or summary data, rather than detailed or comprehensive information.
Dependency on Visual Appeal: Infographics heavily rely on visual elements to communicate information. If the visuals are not well-designed or fail to engage viewers, the effectiveness of the infographic may be diminished.
Potential Misinterpretation: Misinterpretation can occur if the information presented in the infographic is not clear, accurate, or properly labeled. Viewers may draw incorrect conclusions or misunderstand the data if it is not presented with clarity and accuracy.
Power point presentation sample to easily use and manage and prepare the the business plan including strength, weak, threat and opportunity analysis. it helps in pitching to the Client
Recognize and Understand the Market-MODULE 3.pptxAbegaelUrdaneta3
As an entrepreneur, present the best feature of your product or service that
is different from other competitors. Identifying the unique selling proposition
requires marketing research that you will learn from the other modules. In
promoting your products or services, make sure that it is very specific and put
details that emphasize the differentiator against the competitors. Keep it short and
simple and think of a tagline that is easy to remember. Right now, the proposed
unique selling proposition is: “Charing sari-sari store, open 24/7”
Readers get confused between value proposition and unique selling
proposition. The two propositions are used to differentiate the products from
competitors. For example, Jollibee is known to have a Filipino taste burger. This
brand has a unique selling point because of its tagline “Langhap Sarap”
Unique Selling Proposition and Value Proposition are two of the most
famous tools used to explain why prospect customers buy each product and
service. Base on each definition, we learn that USP and VP are frameworks of
each business industry. The two propositions are valuable for the entrepreneurs.
Make sure that you're focusing on a solution that is a need, and make sure that
you are targeting a customer segment that's large enough and cares enough about
your solution so that you can build a viable business. We'll talk more about
determining the size of your target market in our next lesson.
I gave a new talk on the Digital Marketing stage at Dublin Web Summit this week. It was called Enabling and Celebrating The Doers.
It was only a 15 minute slot, but the theme was to take a quick peak at the developer community; its size, make up, and what it produces. Then dip into the playbook of some of the companies doing a good job of engaging with it. Finally wrapping up with some ideas on how to celebrate the individuals that create awesome things with your tools.
Hope you enjoy it, let me know what you think, and thanks for all the kind comments received on Twitter afterwards.
I create beautiful powerpoint presentations for business. I can also create a presentation on any thematic really fast and qualitative.
https://www.fiverr.com/unqstyle?up_rollout=true
Lessons in Appstore Optimization from the Amazon AppstoreDevGAMM Conference
Mike Hines, Developer Evangelist, Amazon
Over half of your downloads will come from organic sources, so make sure your listing pages on the appstores are working for you. Amazon will share data on the kinds of improvements you could get and show you actual examples. In addition, Mike Hines will share data from his game when he followed the advice.When this presentation is over, you will know how to build a professional product listing page.
Macroeconomics- Movie Location
This will be used as part of your Personal Professional Portfolio once graded.
Objective:
Prepare a presentation or a paper using research, basic comparative analysis, data organization and application of economic information. You will make an informed assessment of an economic climate outside of the United States to accomplish an entertainment industry objective.
Unit 8 - Information and Communication Technology (Paper I).pdfThiyagu K
This slides describes the basic concepts of ICT, basics of Email, Emerging Technology and Digital Initiatives in Education. This presentations aligns with the UGC Paper I syllabus.
A Strategic Approach: GenAI in EducationPeter Windle
Artificial Intelligence (AI) technologies such as Generative AI, Image Generators and Large Language Models have had a dramatic impact on teaching, learning and assessment over the past 18 months. The most immediate threat AI posed was to Academic Integrity with Higher Education Institutes (HEIs) focusing their efforts on combating the use of GenAI in assessment. Guidelines were developed for staff and students, policies put in place too. Innovative educators have forged paths in the use of Generative AI for teaching, learning and assessments leading to pockets of transformation springing up across HEIs, often with little or no top-down guidance, support or direction.
This Gasta posits a strategic approach to integrating AI into HEIs to prepare staff, students and the curriculum for an evolving world and workplace. We will highlight the advantages of working with these technologies beyond the realm of teaching, learning and assessment by considering prompt engineering skills, industry impact, curriculum changes, and the need for staff upskilling. In contrast, not engaging strategically with Generative AI poses risks, including falling behind peers, missed opportunities and failing to ensure our graduates remain employable. The rapid evolution of AI technologies necessitates a proactive and strategic approach if we are to remain relevant.
Embracing GenAI - A Strategic ImperativePeter Windle
Artificial Intelligence (AI) technologies such as Generative AI, Image Generators and Large Language Models have had a dramatic impact on teaching, learning and assessment over the past 18 months. The most immediate threat AI posed was to Academic Integrity with Higher Education Institutes (HEIs) focusing their efforts on combating the use of GenAI in assessment. Guidelines were developed for staff and students, policies put in place too. Innovative educators have forged paths in the use of Generative AI for teaching, learning and assessments leading to pockets of transformation springing up across HEIs, often with little or no top-down guidance, support or direction.
This Gasta posits a strategic approach to integrating AI into HEIs to prepare staff, students and the curriculum for an evolving world and workplace. We will highlight the advantages of working with these technologies beyond the realm of teaching, learning and assessment by considering prompt engineering skills, industry impact, curriculum changes, and the need for staff upskilling. In contrast, not engaging strategically with Generative AI poses risks, including falling behind peers, missed opportunities and failing to ensure our graduates remain employable. The rapid evolution of AI technologies necessitates a proactive and strategic approach if we are to remain relevant.
How to Make a Field invisible in Odoo 17Celine George
It is possible to hide or invisible some fields in odoo. Commonly using “invisible” attribute in the field definition to invisible the fields. This slide will show how to make a field invisible in odoo 17.
Introduction to AI for Nonprofits with Tapp NetworkTechSoup
Dive into the world of AI! Experts Jon Hill and Tareq Monaur will guide you through AI's role in enhancing nonprofit websites and basic marketing strategies, making it easy to understand and apply.
Welcome to TechSoup New Member Orientation and Q&A (May 2024).pdfTechSoup
In this webinar you will learn how your organization can access TechSoup's wide variety of product discount and donation programs. From hardware to software, we'll give you a tour of the tools available to help your nonprofit with productivity, collaboration, financial management, donor tracking, security, and more.
Operation “Blue Star” is the only event in the history of Independent India where the state went into war with its own people. Even after about 40 years it is not clear if it was culmination of states anger over people of the region, a political game of power or start of dictatorial chapter in the democratic setup.
The people of Punjab felt alienated from main stream due to denial of their just demands during a long democratic struggle since independence. As it happen all over the word, it led to militant struggle with great loss of lives of military, police and civilian personnel. Killing of Indira Gandhi and massacre of innocent Sikhs in Delhi and other India cities was also associated with this movement.
Acetabularia Information For Class 9 .docxvaibhavrinwa19
Acetabularia acetabulum is a single-celled green alga that in its vegetative state is morphologically differentiated into a basal rhizoid and an axially elongated stalk, which bears whorls of branching hairs. The single diploid nucleus resides in the rhizoid.
1. How to Use Simple Slides
Watch this before starting
https://youtu.be/vDwxqWFH_BI
2. Want More Slides?
Your Special Offer
What You Get:
• 10,000+ Slides & Infographics
• 3000+ Icons
• Easy to Edit
• 100% Money Back Guarantee
• Fully Customizable
• Premium Package Includes:
• Monthly Slide Updates
• Expert PowerPoint Course ($200
Value)
Plus, Save 15% For Trying our
Sample!
Use Code “SAMPLE15”
CLICK HERE TO SAVE
3. LIGHT BULB
INPUT
TITLE HERE
Marketers must link the price to the real
and perceived value of the product, but
they also must take into account.
Marketers must link the price to the real
and perceived value of the product, but
they also must take into account.
Marketers must link the price to the real
and perceived value of the product, but
they also must take into account.
Marketers must link the price to the real
and perceived value of the product, but
they also must take into account.
Marketers must link the price to the real
and perceived value of the product, but
they also must take into account.
Marketers must link the price to the real
and perceived value of the product, but
they also must take into account.
Marketers must link the price
4. Lorem ipsum dolor sit amet, consectetuer
adipiscing elit, sed diam nonummy nibh euismod
tincidunt ut laoreet dolore magna aliquam erat
volutpat. Ut wisi enim ad minim veniam, quis nostrud
exerci tation ullamcorper suscipit lobortis nisl ut aliquip
ex ea commodo consequat. Duis autem vel eum iriure
dolor in hendrerit in vulputate velit esse molestie consequat,
vel illum dolore eu feugiat nulla facilisis at vero eros et
accumsan et iusto odio dignissim qui blandit praesent
luptatum zzril delenit augue duis dolore te feugait nulla faci.
INPUT
TITLE HERE
Marketers must link the price to the real
and perceived value of the product.Yo
Marketers must link the price to the real
and perceived value of the product.
Marketers must link the price to the real
and perceived value of the product.
Marketers must link the price to the real
and perceived value of the product.
PENCIL INFOGRAPHIC
5. TITLE HERE TITLE HERE TITLE HERE TITLE HERE
Marketers must link the price to
the real and perceived value of
the product, but they also must
take into account.
Marketers must link the price to
the real and perceived value of
the product, but they also must
take into account.
Marketers must link the price to
the real and perceived value of
the product, but they also must
take into account.
Marketers must link the price to
the real and perceived value of
the product, but they also must
take into account.
40%
15%
40%
10%
BOOKS & STATISTICS
6. Marketers must link the price
to the real and perceived
value of the product.
INPUT TITLE HERE
Marketers must link the price
to the real and perceived
value of the product.
INPUT TITLE HERE
Marketers must link the price
to the real and perceived
value of the product.
INPUT TITLE HERE
Marketers must link the price
to the real and perceived
value of the product.
INPUT TITLE HERE
A
B
C
D
STACKED BOOK INFOGRAPHIC
7. Marketers must link the
price to the real and
perceived value of the
product, but they also must
take into account.
Marketers must link the
price to the real and
perceived value of the
product, but they also must
take into account.
Marketers must link the
price to the real and
perceived value of the
product, but they also must
take into account.
Marketers must link the
price to the real and
perceived value of the
product, but they also must
take into account.
INPUT
TITLE HERE
INPUT
TITLE HERE
INPUT
TITLE HERE
INPUT
TITLE HERE
01
02
03
04
APPLE INFOGRAPHIC
8. TITLE HERE
Marketers must link the
price to the real and
perceived value of the
product, but they also
must take into account.
TITLE HERE
Marketers must link the
price to the real and
perceived value of the
product, but they also
must take into account.
TITLE HERE
Marketers must link the
price to the real and
perceived value of the
product, but they also
must take into account.
TITLE HERE
Marketers must link the
price to the real and
perceived value of the
product, but they also
must take into account.
LIGHTBULBS INFOGRAPHIC
9. 01
02
03 INPUT
TITLE HERE
INPUT
TITLE HERE
INPUT
TITLE HERE
Marketers must link the
price to the real and
perceived value of the
product, but they also
must take into account.
Marketers must link the
price to the real and
perceived value of the
product, but they also
must take into account.
Marketers must link the
price to the real and
perceived value of the
product, but they also
must take into account.
FILES
INFOGRAPHICS
Lorem ipsum dolor sit amet, consectetuer
adipiscing elit, sed diam nonummy nibh euismod
tincidunt ut laoreet dolore magna aliquam erat
volutpat. Ut wisi enim ad minim veniam, quis
nostrud exerci tation ullamcorper suscipit lobortis
nisl ut aliquip ex ea commodo consequat. Duis
autem vel eum iriure dolor in hendrerit in vulputate
velit esse molestie consequat, vel illum dolore eu
feugiat nulla facilisis at vero eros et accumsan et
iusto odio dignissim qui blandit praesent luptatum
zzril delenit augue duis dolore te feugait nulla faci.
10. Marketers must link the price to
the real and perceived value of
the product, but they also must
take into account.
Marketers must link the price to
the real and perceived value of
the product, but they also must
take into account.
Marketers must link the price to
the real and perceived value of
the product, but they also must
take into account.
Marketers must link the price to
the real and perceived value of
the product, but they also must
take into account.
INPUT TITLE HERE
INPUT TITLE HERE
INPUT TITLE HERE
INPUT TITLE HERE
BRAIN INFOGRAPHIC
11. Marketers must link the price to the real and perceived
value of the product, but they also must take into account.
INPUT TITLE HERE
Marketers must link the price to the real and perceived
value of the product, but they also must take into account.
INPUT TITLE HERE
Marketers must link the price to the real and perceived
value of the product, but they also must take into account.
INPUT TITLE HERE
Marketers must link the price to the real and perceived
value of the product, but they also must take into account.
INPUT TITLE HERE
Marketers must link the price to the real and perceived
value of the product, but they also must take into account.
INPUT TITLE HERE
A
B
C
D
E
BRAIN INFOGRAPHIC
12. Marketers must link the price
to the real and perceived
value of the product, but they
also must take into account.
INPUT TITLE HERE
Marketers must link the price
to the real and perceived
value of the product, but they
also must take into account.
INPUT TITLE HERE
Marketers must link the price
to the real and perceived
value of the product, but they
also must take into account.
INPUT TITLE HERE
INPUT TITLE HERE
Marketers must link the price
to the real and perceived
value of the product, but they
also must take into account.
INPUT TITLE HERE
Marketers must link the price
to the real and perceived
value of the product, but they
also must take into account.
INPUT TITLE HERE
Marketers must link the price
to the real and perceived
value of the product, but they
also must take into account.
EDUCATION PROCESS INFOGRAPHIC
13. TIME
INFOGRAPHICS A
B
C
D
Marketers must link the price to the real
and perceived value of the product,
but they also must take into account.
INPUT TITLE HERE
A
Marketers must link the price to the real
and perceived value of the product,
but they also must take into account.
INPUT TITLE HERE
B
Marketers must link the price to the real
and perceived value of the product,
but they also must take into account.
INPUT TITLE HERE
C
Marketers must link the price to the real
and perceived value of the product,
but they also must take into account.
INPUT TITLE HERE
D
14. MEASUREMENT
INFOGRAPHICS
Marketers must link the price to the real
and perceived value of the product,
but they also must take into account.
INPUT TITLE HERE
A
Marketers must link the price to the real
and perceived value of the product,
but they also must take into account.
INPUT TITLE HERE
B
Marketers must link the price to the real
and perceived value of the product,
but they also must take into account.
INPUT TITLE HERE
C
Marketers must link the
price to the real and
perceived value of the
product, but they also
must take into account.
A
Marketers must
link the price to the real
and perceived value of
the product, but they also
must take into account.
B
Marketers must link
the price to the real
and perceived value
of the product, but
they also must take
into account.
C
15. Lorem ipsum dolor sit amet, consectetuer
adipiscing elit, sed diam nonummy nibh euismod
tincidunt ut laoreet dolore magna aliquam erat
volutpat. Ut wisi enim ad minim veniam, quis
nostrud exerci tation ullamcorper suscipit lobortis
nisl ut aliquip ex ea commodo consequat. Duis
autem vel eum iriure dolor in hendrerit in vulputate
velit esse molestie consequat, vel illum dolore eu
feugiat nulla facilisis at vero eros et accumsan et
iusto odio dignissim qui blandit praesent luptatum
zzril delenit augue duis dolore te feugait nulla faci.
INPUT TITLE HERE
Marketers must link the price to the real
and perceived value of the product, but
they also must take into account.
01
Marketers must link the price to the real
and perceived value of the product, but
they also must take into account.
02
Marketers must link the price to the real
and perceived value of the product, but
they also must take into account.
03
Marketers must link the price to the real
and perceived value of the product, but
they also must take into account.
04
PENCIL PROCESS INFOGRAPHIC
16. Marketers must link the
price to the real and
perceived value of the
product, but they also
must take into account.
INPUT TITLE
Marketers must link the
price to the real and
perceived value of the
product, but they also
must take into account.
INPUT TITLE
Marketers must link the
price to the real and
perceived value of the
product, but they also
must take into account.
INPUT TITLE
Marketers must link the
price to the real and
perceived value of the
product, but they also
must take into account.
INPUT TITLE
OPEN BOOK INFOGRAPHIC
17. INPUT TITLE/ EDUCATIONAL QUOTE HERE
Marketers must link the price to the real and perceived
value of the product, but they also must take into account.
INPUT TITLE HERE
Marketers must link the price to the real and perceived
value of the product, but they also must take into account.
INPUT TITLE HERE
Marketers must link the price to the real and perceived
value of the product, but they also must take into account.
INPUT TITLE HERE
A
B
C
LIGHTBULB ICON INFOGRAPHIC
18. PUZZLE
INFOGRAPHICS
Lorem ipsum dolor sit amet,
consectetuer adipiscing elit, sed diam
nonummy nibh euismod tincidunt ut
laoreet dolore magna aliquam erat
volutpat. Ut wisi enim ad minim veniam,
quis nostrud exerci tation ullamcorper
suscipit lobortis nisl ut aliquip ex ea
commodo consequat. Duis autem vel
eum iriure dolor in hendrerit in vulputate
velit esse molestie consequat.
Marketers must link the
price to the real and
perceived value of the
product, but they also
must take into account.
STEP 01
Marketers must link the
price to the real and
perceived value of the
product, but they also
must take into account.
STEP 02
Marketers must link the
price to the real and
perceived value of the
product, but they also
must take into account.
STEP 03
Marketers must link the
price to the real and
perceived value of the
product, but they also
must take into account.
STEP 04
19. Marketers must link
the price to the real.
INPUT TITLE
Marketers must link
the price to the real.
INPUT TITLE
Marketers must link
the price to the real.
INPUT TITLE
Lorem ipsum dolor sit amet, consectetuer
adipiscing elit, sed diam nonummy nibh euismod
tincidunt ut laoreet dolore magna aliquam erat
volutpat. Ut wisi enim ad minim veniam, quis
nostrud exerci tation ullamcorper suscipit lobortis
nisl ut aliquip ex ea commodo consequat. Duis
autem vel eum iriure dolor in hendrerit in vulputate
velit esse molestie consequat, vel illum dolore eu
feugiat nulla facilisis at vero eros et accumsan et
iusto odio dignissim qui blandit praesent luptatum
zzril delenit augue duis dolore te feugait nulla faci.
INPUT TITLE HERE
A
B
C
LETTER INFOGRAPHIC
20. Marketers must link the
price to the real and
perceived value of the
product, but they also must
take into account.
INPUT TITLE HERE
Marketers must link the
price to the real and
perceived value of the
product, but they also must
take into account.
INPUT TITLE HERE
Marketers must link the
price to the real and
perceived value of the
product, but they also must
take into account.
INPUT TITLE HERE
A
B
C
HIGHLIGHTER INFOGRAPHIC
21. ROCKET
INFOGRAPHIC
Lorem ipsum dolor sit amet,
consectetuer adipiscing elit, sed diam
nonummy nibh euismod tincidunt ut
laoreet dolore magna aliquam erat
volutpat. Ut wisi enim ad minim veniam,
quis nostrud exerci tation ullamcorper
suscipit lobortis nisl ut aliquip ex ea
commodo consequat. Duis autem vel
eum iriure dolor in hendrerit in vulputate
velit esse molestie consequat.
Refers to a good or
service being offered
Refers to a good or
service being offered
Refers to a good or
service being offered
Refers to a good or
service being offered
22. Refers to a good
or service being
offered
Refers to a good
or service being
offered
Refers to a good
or service being
offered
Refers to a good
or service being
offered
01
02
03
04
STARTUP INFOGRAPHIC
23. 01
02
03
04
Marketers must link the price to
the real and perceived value of
the product, but they also must
take into account.
Marketers must link the price to
the real and perceived value of
the product, but they also must
take into account.
Marketers must link the price to
the real and perceived value of
the product, but they also must
take into account.
Marketers must link the price to
the real and perceived value of
the product, but they also must
take into account.
BUSINESS INFOGRAPHIC
24. STARTUP PROCESS
INFOGRAPHIC
01
02
03
04
Marketers must link the price to
the real and perceived value of
the product, but they also must
take into account.
Marketers must link the price to
the real and perceived value of
the product, but they also must
take into account.
Marketers must link the price to
the real and perceived value of
the product, but they also must
take into account.
Marketers must link the price to
the real and perceived value of
the product, but they also must
take into account.
26. 01 02 03 04 05 06
TITLE HERE TITLE HERE TITLE HERE TITLE HERE TITLE HERE TITLE HERE
Marketers must
link the price to
the real and
perceived value
of the product.
Marketers must
link the price to
the real and
perceived value
of the product.
Marketers must
link the price to
the real and
perceived value
of the product.
Marketers must
link the price to
the real and
perceived value
of the product.
Marketers must
link the price to
the real and
perceived value
of the product.
Marketers must
link the price to
the real and
perceived value
of the product.
LAUNCH PLAN INFOGRAPHIC
27. Marketers must link the price to
the real and perceived value of
the product, but they also must
take into account.
INPUT TITLE HERE
Marketers must link the price to
the real and perceived value of
the product, but they also must
take into account.
INPUT TITLE HERE
Marketers must link the price to
the real and perceived value of
the product, but they also must
take into account.
INPUT TITLE HERE
Marketers must link the price to
the real and perceived value of
the product, but they also must
take into account.
INPUT TITLE HERE
TARGET INFOGRAPHIC
28. Marketers must
link the price to
the real and
perceived value
of the product.
Marketers must
link the price to
the real and
perceived value
of the product.
Marketers must
link the price to
the real and
perceived value
of the product.
Marketers must
link the price to
the real and
perceived value
of the product.
INPUT TITLE/ GLOBAL
QUOTE HERE
GLOBAL INFOGRAPHIC
29. INPUT TITLE/
GLOBAL QUOTE
HERE
GLOBAL
INFOGRAPHICS
Lorem ipsum dolor sit amet,
consectetuer adipiscing elit, sed diam
nonummy nibh euismod tincidunt ut
laoreet dolore magna aliquam erat
volutpat. Ut wisi enim ad minim veniam,
quis nostrud exerci tation ullamcorper
suscipit lobortis nisl ut aliquip ex ea
commodo consequat. Duis autem vel
eum iriure dolor in hendrerit in vulputate
velit esse molestie consequat.
Marketers must
link the price to
the real and
perceived value
of the product.
STEP 01
Marketers must
link the price to
the real and
perceived value
of the product.
STEP 02
Marketers must
link the price to
the real and
perceived value
of the product.
STEP 03
Marketers must
link the price to
the real and
perceived value
of the product.
STEP 04
30. Marketers must link the price
to the real and perceived
value of the product.
STEP 01
Marketers must link the price
to the real and perceived
value of the product.
STEP 02
Marketers must link the price
to the real and perceived
value of the product.
STEP 03 Marketers must link the price
to the real and perceived
value of the product.
STEP 04
ROADMAP INFOGRAPHIC
31. Marketers must link
the price to the real
and perceived value
of the product.
STEP 01
Marketers must link
the price to the real
and perceived value
of the product.
STEP 03
Marketers must link
the price to the real
and perceived value
of the product.
STEP 05
Marketers must link
the price to the real
and perceived value
of the product.
STEP 02
Marketers must link
the price to the real
and perceived value
of the product.
STEP 04
ROADMAP INFOGRAPHIC
32. 01
02
03
Marketers must link
the price to the real
and perceived value
of the product.
TITLE
Marketers must link
the price to the real
and perceived value
of the product.
TITLE
Marketers must link
the price to the real
and perceived value
of the product.
TITLE
CARS INFOGRAPHIC
33. 01
02
03
04
05
06
07
Marketers
must link
the price to
the real
and
perceived
value of the
product.
Marketers
must link
the price to
the real
and
perceived
value of the
product.
Marketers
must link
the price to
the real
and
perceived
value of the
product.
Marketers
must link
the price to
the real
and
perceived
value of the
product.
Marketers
must link
the price to
the real
and
perceived
value of the
product.
Marketers
must link
the price to
the real
and
perceived
value of the
product.
Marketers
must link
the price to
the real
and
perceived
value of the
product.
ROADMAP INFOGRAPHIC
34. Marketers must link
the price to the real
and perceived value
of the product.
TITLE
Marketers must link
the price to the real
and perceived value
of the product.
TITLE
Marketers must link
the price to the real
and perceived value
of the product.
TITLE
Marketers must link
the price to the real
and perceived value
of the product.
TITLE
STEPS INFOGRAPHIC
35. January
Placeholder. Insert
your own text here.
March
Placeholder. Insert
your own text here.
May
Placeholder. Insert
your own text here.
July
Placeholder. Insert
your own text here.
September
Placeholder. Insert
your own text here.
November
Placeholder. Insert
your own text here.
February
Placeholder. Insert
your own text here.
April
Placeholder. Insert
your own text here.
June
Placeholder. Insert
your own text here.
August
Placeholder. Insert
your own text here.
October
Placeholder. Insert
your own text here.
December
Placeholder. Insert
your own text here.
Jan Feb Mar Apr May Jun Jul Aug Sep Oct Nov Dec
MONTHLY GANTT CHART
36. Year/month Year/month Year/month Year/month Year/month Year/month Year/month
Year/month Year/month
Marketers must link
the price to the real
and perceived value
of the product.
TITLE
Marketers must link
the price to the real
and perceived value
of the product.
TITLE
Marketers must link
the price to the real
and perceived value
of the product.
TITLE
Marketers must link
the price to the real
and perceived value
of the product.
TITLE
Marketers must link
the price to the real
and perceived value
of the product.
TITLE
YEARLY GANTT CHART
37. 01 02 03 04 05 06 07
20
14
23
05
12
18
24
Marketers must link the price
to the real and perceived
value of the product.
TITLE
Marketers must link the price
to the real and perceived
value of the product.
TITLE
Marketers must link the price
to the real and perceived
value of the product.
TITLE
Marketers must link the price
to the real and perceived
value of the product.
TITLE
Marketers must link the price
to the real and perceived
value of the product.
TITLE
Marketers must link the price
to the real and perceived
value of the product.
TITLE
Marketers must link the price
to the real and perceived
value of the product.
TITLE
DAILY GANTT CHART
38. S M T W T F S S M T W T F S S M T W T F S S M T W T F S S M T
1 2 3 4 5 6 7 8 9 10 11 12 13 14 15 16 17 18 19 20 21 22 23 24 25 26 27 28 29 30 31
Heading
This is placeholder
text. All phrases can
be replaced with
your own text.
Heading
This is placeholder
text. All phrases can
be replaced with
your own text.
Heading
This is placeholder
text. All phrases can
be replaced with
your own text.
Heading
This is placeholder
text. All phrases can
be replaced with
your own text.
January
DAILY GANTT CHART
39. Heading
This is placeholder
text. All phrases can
be replaced with
your own text.
Heading
This is placeholder
text. All phrases can
be replaced with
your own text.
Heading
This is placeholder
text. All phrases can
be replaced with
your own text.
Heading
This is placeholder
text. All phrases can
be replaced with
your own text.
2020
Aug Sep Oct Nov Dec Jan Feb Mar Apr May Jun Jul
QUARTERLY GANTT CHART
40. FY Q1 FY Q2 FY Q3 FY Q4 FY Q1
Month Month Month Month Month Month Month Month Month Month Month Month Month Month Month
Content
Content
Content
Content
Content
Content
Content
Content
Content Content Content Content
Enter text here if needed
TABLE GANTT CHART
41. Phase
This is placeholder text.
All phrases can be replaced
with your own text.
Start
This is placeholder text.
All phrases can be replaced
with your own text.
Finish
This is placeholder text.
All phrases can be replaced
with your own text.
Placeholder Placeholder Placeholder Placeholder
RUNNING GANTT CHART
42. Apr 2020 May 2020 Jun 2020 Jul 2020 Aug 2020 Sep 2020
Mar 2020
Marketers must link
the price to the real
and perceived value
of the product.
STEP 01
Marketers must link
the price to the real
and perceived value
of the product.
STEP 03
Marketers must link
the price to the real
and perceived value
of the product.
STEP 05
Marketers must link
the price to the real
and perceived value
of the product.
STEP 07
Marketers must link
the price to the real
and perceived value
of the product.
STEP 02
Marketers must link
the price to the real
and perceived value
of the product.
STEP 04
Marketers must link
the price to the real
and perceived value
of the product.
STEP 06
SIMPLE TIMELINE INFOGRAPHIC
43. MEDICAL
INFOGRAPHIC
Lorem ipsum dolor sit amet,
consectetuer adipiscing elit, sed diam
nonummy nibh euismod tincidunt ut
laoreet dolore magna aliquam erat
volutpat. Ut wisi enim ad minim veniam,
quis nostrud exerci tation ullamcorper
suscipit lobortis nisl ut aliquip ex ea
commodo consequat. Duis autem vel
eum iriure dolor in hendrerit in vulputate
velit esse molestie consequat.
Marketers must link
the price to the real
and perceived value
of the product.
TITLE
Marketers must link
the price to the real
and perceived value
of the product.
TITLE
Marketers must link
the price to the real
and perceived value
of the product.
TITLE
Marketers must link
the price to the real
and perceived value
of the product.
TITLE
44. Marketers must link the price
to the real and perceived
value of the product.
Marketers must link the price
to the real and perceived
value of the product.
A
B
PILL INFOGRAPHIC
45. HEART
INFOGRAPHICS
Marketers must link the price
to the real and perceived
value of the product.
STEP 05
Marketers must link the price
to the real and perceived
value of the product.
STEP 01
Marketers must link
the price to the real
and perceived value
of the product.
STEP 02
Marketers must link
the price to the real
and perceived value
of the product.
STEP 03
Marketers must link the price
to the real and perceived
value of the product.
STEP 04
46. DNA
INFOGRAPHICS
Lorem ipsum dolor sit amet,
consectetuer adipiscing elit, sed diam
nonummy nibh euismod tincidunt ut
laoreet dolore magna aliquam erat
volutpat. Ut wisi enim ad minim veniam,
quis nostrud exerci tation ullamcorper
suscipit lobortis nisl ut aliquip ex ea
commodo consequat. Duis autem vel
eum iriure dolor in hendrerit in vulputate
velit esse molestie consequat.
Marketers must
link the price to
the real and
perceived value
of the product.
Marketers must
link the price to
the real and
perceived value
of the product.
47. Marketers must link the price to the real
and perceived value of the product, but
they also must take into account.
01
Marketers must link the price to the real
and perceived value of the product, but
they also must take into account.
02
Marketers must link the price to the real
and perceived value of the product, but
they also must take into account.
03
Marketers must link the price to the real
and perceived value of the product, but
they also must take into account.
04
EXPERIMENT INFOGRAPHIC
48. PILL
INFOGRAPHIC
A
B
C
Marketers must link the price to the real
and perceived value of the product,
but they also must take into account.
INPUT TITLE HERE
A
Marketers must link the price to the real
and perceived value of the product,
but they also must take into account.
INPUT TITLE HERE
B
Marketers must link the price to the real
and perceived value of the product,
but they also must take into account.
INPUT TITLE HERE
C
49. Marketers must link the price to the real and perceived
value of the product, but they also must take into account.
E
Marketers must link the price to the real and perceived
value of the product, but they also must take into account.
INPUT TITLE HERE
Marketers must link the price to the real and perceived
value of the product, but they also must take into account.
INPUT TITLE HERE
Marketers must link the price to the real and perceived
value of the product, but they also must take into account.
INPUT TITLE HERE
Marketers must link the price to the real and perceived
value of the product, but they also must take into account.
INPUT TITLE HERE
INPUT TITLE HERE
A
B
C
D
HUMAN INFOGRAPHIC
50. Marketers must link the price to the real
and perceived value of the product,
but they also must take into account.
INPUT TITLE HERE
A
Marketers must link the price to the real
and perceived value of the product,
but they also must take into account.
INPUT TITLE HERE
B
Marketers must link the price to the real
and perceived value of the product,
but they also must take into account.
INPUT TITLE HERE
C
Marketers must link the price to the real
and perceived value of the product,
but they also must take into account.
INPUT TITLE HERE
D
50%
75%
60%
80%
TEST TUBE INFOGRAPHIC