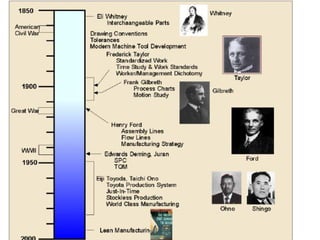
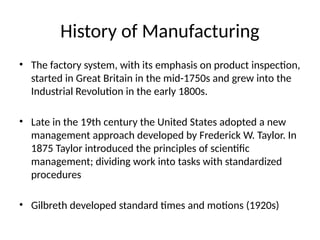
History of Manufacturing
•The factory system, with its emphasis on product inspection,
started in Great Britain in the mid-1750s and grew into the
Industrial Revolution in the early 1800s.
• Late in the 19th century the United States adopted a new
management approach developed by Frederick W. Taylor. In
1875 Taylor introduced the principles of scientific
management; dividing work into tasks with standardized
procedures
• Gilbreth developed standard times and motions (1920s)
5.
History of Manufacturing
•Walter Shewhart, a statistician for Bell Laboratories, in1924 began to
focus on controlling processes, making quality relevant not only for
the finished product but for the processes that created it. Shewhart’s
concepts are referred to as statistical quality control (SQC).
• Dodge and Romig (1928), Bell Labs, develop acceptance sampling as
an alternate to 100% inspection.
• W Edwards Deming, a statistician with the U.S. Department of
Agriculture and Census Bureau, became a proponent of Shewhart’s
SQC methods and later became a leader of the quality movement in
both Japan and the United States
6.
History of Manufacturing
•United States entered World War II and quality became a
critical component of the war effort; bullets quality is one
example.
• After WWII, the Japanese welcomed the input of
Americans Joseph Juran and Edwards Deming and rather
than concentrating on inspection, focused on improving all
organizational processes through the people who used
them.
• The birth of total quality in the United States was in direct
response to a quality revolution in Japan following World
War II
7.
History of Manufacturing
•The U.S. response, emphasizing not only statistics
but approaches that embraced the entire
organization, became known as total quality
management (TQM)
• The ISO 9000 series of quality-management
standards were published in 1987.
• Six Sigma, a methodology developed by Motorola to
improve its business processes by minimizing
defects, evolved into an organizational approach that
achieved breakthroughs
8.
Evolution of QualityControl
• Phase 1: Operator Quality Control Period (up
to 1900)
– Work done by one person or a small group
– Limited production volume
• Worker felt a sense of accomplishment
• Quality of the product was controlled by one
person; the operator
9.
Evolution of QualityControl
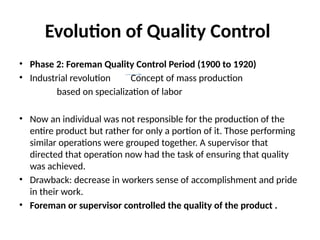
• Phase 2: Foreman Quality Control Period (1900 to 1920)
• Industrial revolution Concept of mass production
based on specialization of labor
• Now an individual was not responsible for the production of the
entire product but rather for only a portion of it. Those performing
similar operations were grouped together. A supervisor that
directed that operation now had the task of ensuring that quality
was achieved.
• Drawback: decrease in workers sense of accomplishment and pride
in their work.
• Foreman or supervisor controlled the quality of the product .
10.
Evolution of QualityControl
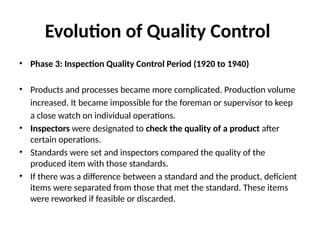
• Phase 3: Inspection Quality Control Period (1920 to 1940)
• Products and processes became more complicated. Production volume
increased. It became impossible for the foreman or supervisor to keep
a close watch on individual operations.
• Inspectors were designated to check the quality of a product after
certain operations.
• Standards were set and inspectors compared the quality of the
produced item with those standards.
• If there was a difference between a standard and the product, deficient
items were separated from those that met the standard. These items
were reworked if feasible or discarded.
11.
Evolution of QualityControl
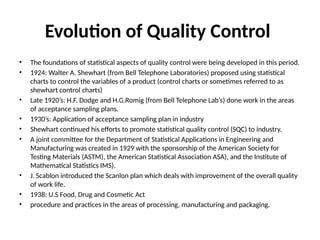
• The foundations of statistical aspects of quality control were being developed in this period.
• 1924: Walter A. Shewhart (from Bell Telephone Laboratories) proposed using statistical
charts to control the variables of a product (control charts or sometimes referred to as
shewhart control charts)
• Late 1920’s: H.F. Dodge and H.G.Romig (from Bell Telephone Lab’s) done work in the areas
of acceptance sampling plans.
• 1930’s: Application of acceptance sampling plan in industry
• Shewhart continued his efforts to promote statistical quality control (SQC) to industry.
• A joint committee for the Department of Statistical Applications in Engineering and
Manufacturing was created in 1929 with the sponsorship of the American Society for
Testing Materials (ASTM), the American Statistical Association ASA), and the Institute of
Mathematical Statistics IMS).
• J. Scablon introduced the Scanlon plan which deals with improvement of the overall quality
of work life.
• 1938: U.S Food, Drug and Cosmetic Act
• procedure and practices in the areas of processing, manufacturing and packaging.
12.
Evolution of QualityControl
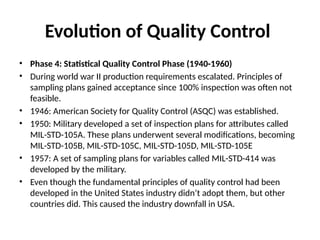
• Phase 4: Statistical Quality Control Phase (1940-1960)
• During world war II production requirements escalated. Principles of
sampling plans gained acceptance since 100% inspection was often not
feasible.
• 1946: American Society for Quality Control (ASQC) was established.
• 1950: Military developed a set of inspection plans for attributes called
MIL-STD-105A. These plans underwent several modifications, becoming
MIL-STD-105B, MIL-STD-105C, MIL-STD-105D, MIL-STD-105E
• 1957: A set of sampling plans for variables called MIL-STD-414 was
developed by the military.
• Even though the fundamental principles of quality control had been
developed in the United States industry didn’t adopt them, but other
countries did. This caused the industry downfall in USA.
13.
Evolution of QualityControl
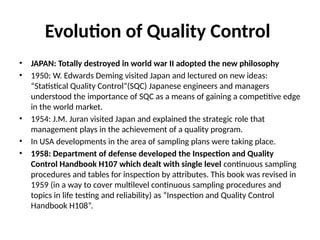
• JAPAN: Totally destroyed in world war II adopted the new philosophy
• 1950: W. Edwards Deming visited Japan and lectured on new ideas:
“Statistical Quality Control”(SQC) Japanese engineers and managers
understood the importance of SQC as a means of gaining a competitive edge
in the world market.
• 1954: J.M. Juran visited Japan and explained the strategic role that
management plays in the achievement of a quality program.
• In USA developments in the area of sampling plans were taking place.
• 1958: Department of defense developed the Inspection and Quality
Control Handbook H107 which dealt with single level continuous sampling
procedures and tables for inspection by attributes. This book was revised in
1959 (in a way to cover multilevel continuous sampling procedures and
topics in life testing and reliability) as “Inspection and Quality Control
Handbook H108”.
14.
Evolution of QualityControl
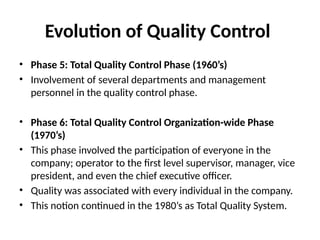
• Phase 5: Total Quality Control Phase (1960’s)
• Involvement of several departments and management
personnel in the quality control phase.
• Phase 6: Total Quality Control Organization-wide Phase
(1970’s)
• This phase involved the participation of everyone in the
company; operator to the first level supervisor, manager, vice
president, and even the chief executive officer.
• Quality was associated with every individual in the company.
• This notion continued in the 1980’s as Total Quality System.
15.
Evolution of QualityControl
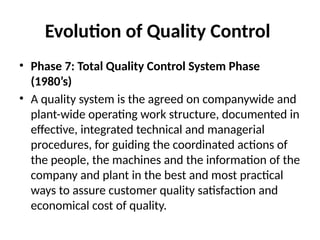
• Phase 7: Total Quality Control System Phase
(1980’s)
• A quality system is the agreed on companywide and
plant-wide operating work structure, documented in
effective, integrated technical and managerial
procedures, for guiding the coordinated actions of
the people, the machines and the information of the
company and plant in the best and most practical
ways to assure customer quality satisfaction and
economical cost of quality.
16.
Evolution of QualityControl
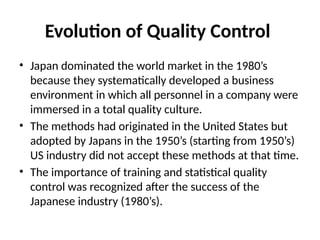
• Japan dominated the world market in the 1980’s
because they systematically developed a business
environment in which all personnel in a company were
immersed in a total quality culture.
• The methods had originated in the United States but
adopted by Japans in the 1950’s (starting from 1950’s)
US industry did not accept these methods at that time.
• The importance of training and statistical quality
control was recognized after the success of the
Japanese industry (1980’s).
17.
Classification
• Quality Control--Useof techniques to achieve
and sustain the quality.
• Quality Improvement--Use of tools and
techniques to continually improve the product,
service, or process.
• Statistical Quality Control—Use of statistics to
control the quality.
18.
Classification
• Quality Assurance--Plannedor systematic
actions necessary to provide adequate
confidence that the product or service will
satisfy given requirements.
• Process--Set of interrelated activities that uses
specific inputs to produce specific outputs.
Includes both internal and external customers
and suppliers.
19.
Defining quality
• Qualityis a subjective term for which each
person has his or her own definition”
• What’s your definition?
20.
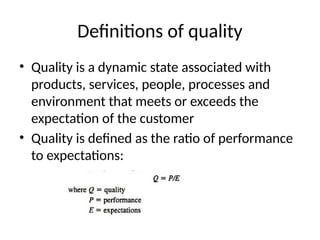
Definitions of quality
•Quality is a dynamic state associated with
products, services, people, processes and
environment that meets or exceeds the
expectation of the customer
• Quality is defined as the ratio of performance
to expectations:
21.
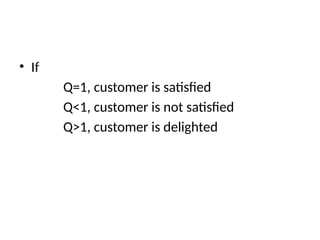
• If
Q=1, customeris satisfied
Q<1, customer is not satisfied
Q>1, customer is delighted
22.
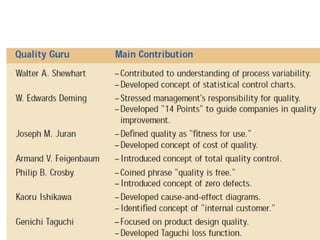
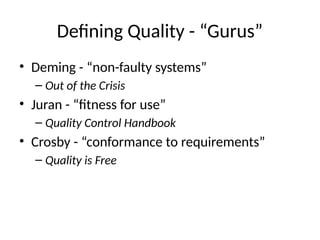
Defining Quality -“Gurus”
• Deming - “non-faulty systems”
– Out of the Crisis
• Juran - “fitness for use”
– Quality Control Handbook
• Crosby - “conformance to requirements”
– Quality is Free
23.
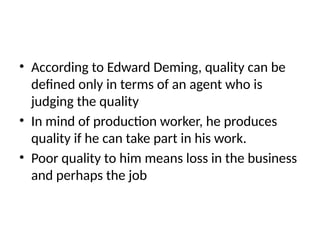
• According toEdward Deming, quality can be
defined only in terms of an agent who is
judging the quality
• In mind of production worker, he produces
quality if he can take part in his work.
• Poor quality to him means loss in the business
and perhaps the job
24.
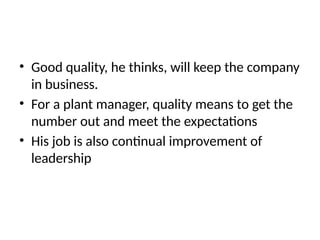
• Good quality,he thinks, will keep the company
in business.
• For a plant manager, quality means to get the
number out and meet the expectations
• His job is also continual improvement of
leadership
25.
• According toJoseph Juran, quality means those
products that meet customer needs and provide
customer satisfaction
• Quality is oriented towards income
• Purpose of high quality is to provide greater
customer satisfaction and a hope to increase income
• However, providing more and better quality features
requires an investment, hence, quality involves an
increase in costs
26.
• Quality meansfreedom from deficiencies,
freedom from errors that avoids doing work
over and over again (rework)
• According to American society of quality
control (ASQC) standard A3-1987, quality is a
totality of features and characteristics of a
product or service that bear on its ability to
satisfy implied or stated needs
27.
• European organizationof quality control
defines quality as a degree to which it meets
requirement of customer
28.
Quality characteristics
• Qualitycharacteristics may be one or more elements
that define the intended quality level of product or
service
• Characteristics can be formed in following categories
– Structural characteristics
– Sensory characteristics
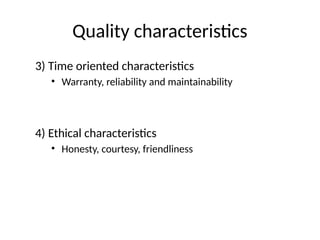
– Time oriented characteristics
– Ethical characteristics
– Functional characteristics
– Non-functional characteristics
29.
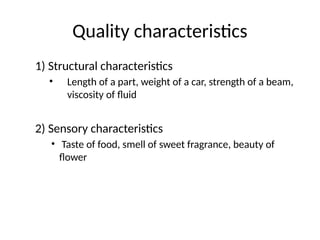
Quality characteristics
1) Structuralcharacteristics
• Length of a part, weight of a car, strength of a beam,
viscosity of fluid
2) Sensory characteristics
• Taste of food, smell of sweet fragrance, beauty of
flower
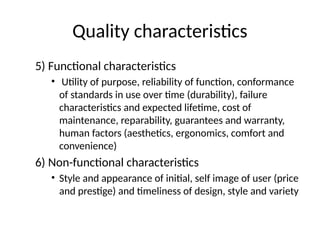
Quality characteristics
5) Functionalcharacteristics
• Utility of purpose, reliability of function, conformance
of standards in use over time (durability), failure
characteristics and expected lifetime, cost of
maintenance, reparability, guarantees and warranty,
human factors (aesthetics, ergonomics, comfort and
convenience)
6) Non-functional characteristics
• Style and appearance of initial, self image of user (price
and prestige) and timeliness of design, style and variety
32.
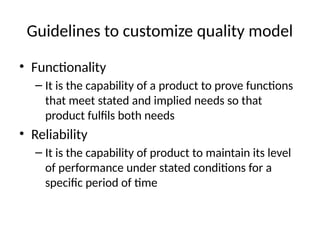
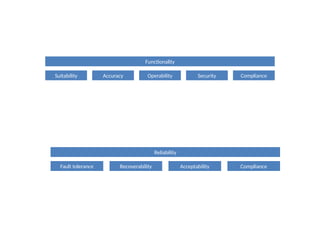
Guidelines to customizequality model
• Functionality
– It is the capability of a product to prove functions
that meet stated and implied needs so that
product fulfils both needs
• Reliability
– It is the capability of product to maintain its level
of performance under stated conditions for a
specific period of time
33.
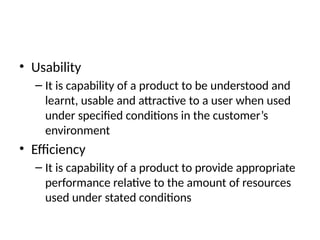
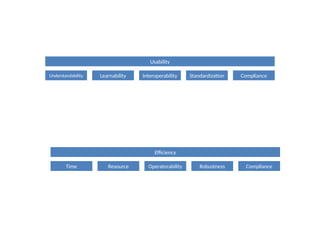
• Usability
– Itis capability of a product to be understood and
learnt, usable and attractive to a user when used
under specified conditions in the customer’s
environment
• Efficiency
– It is capability of a product to provide appropriate
performance relative to the amount of resources
used under stated conditions
34.
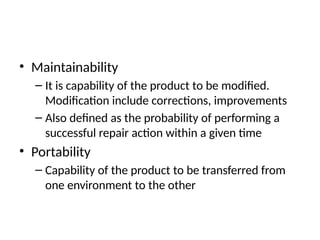
• Maintainability
– Itis capability of the product to be modified.
Modification include corrections, improvements
– Also defined as the probability of performing a
successful repair action within a given time
• Portability
– Capability of the product to be transferred from
one environment to the other
Quality measures
• Qualitymeasures are different in different
areas of society.
• How do you measure quality of car you want
to buy?
39.
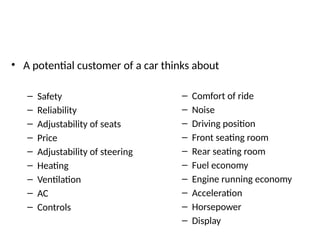
• A potentialcustomer of a car thinks about
– Safety
– Reliability
– Adjustability of seats
– Price
– Adjustability of steering
– Heating
– Ventilation
– AC
– Controls
– Comfort of ride
– Noise
– Driving position
– Front seating room
– Rear seating room
– Fuel economy
– Engine running economy
– Acceleration
– Horsepower
– Display
40.
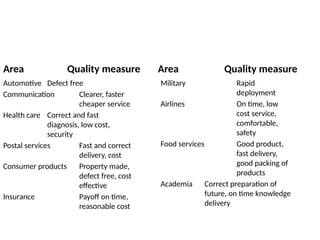
Area Quality measure
AutomotiveDefect free
Communication Clearer, faster
cheaper service
Health care Correct and fast
diagnosis, low cost,
security
Postal services Fast and correct
delivery, cost
Consumer products Property made,
defect free, cost
effective
Insurance Payoff on time,
reasonable cost
Area Quality measure
Military Rapid
deployment
Airlines On time, low
cost service,
comfortable,
safety
Food services Good product,
fast delivery,
good packing of
products
Academia Correct preparation of
future, on time knowledge
delivery
41.
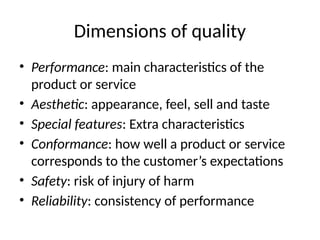
Dimensions of quality
•Performance: main characteristics of the
product or service
• Aesthetic: appearance, feel, sell and taste
• Special features: Extra characteristics
• Conformance: how well a product or service
corresponds to the customer’s expectations
• Safety: risk of injury of harm
• Reliability: consistency of performance
42.
Dimensions of quality
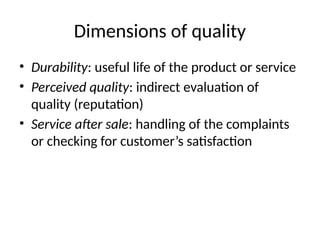
•Durability: useful life of the product or service
• Perceived quality: indirect evaluation of
quality (reputation)
• Service after sale: handling of the complaints
or checking for customer’s satisfaction
43.
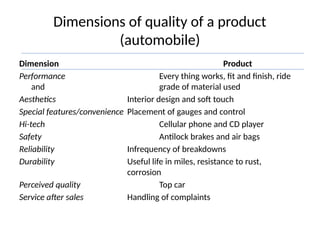
Dimensions of qualityof a product
(automobile)
Dimension Product
Performance Every thing works, fit and finish, ride
and grade of material used
Aesthetics Interior design and soft touch
Special features/convenience Placement of gauges and control
Hi-tech Cellular phone and CD player
Safety Antilock brakes and air bags
Reliability Infrequency of breakdowns
Durability Useful life in miles, resistance to rust,
corrosion
Perceived quality Top car
Service after sales Handling of complaints
44.
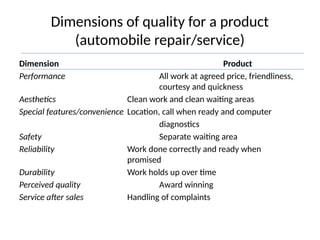
Dimensions of qualityfor a product
(automobile repair/service)
Dimension Product
Performance All work at agreed price, friendliness,
courtesy and quickness
Aesthetics Clean work and clean waiting areas
Special features/convenience Location, call when ready and computer
diagnostics
Safety Separate waiting area
Reliability Work done correctly and ready when
promised
Durability Work holds up over time
Perceived quality Award winning
Service after sales Handling of complaints
45.
Customer and quality
•Most important asset of any organization is its
customers
• Organization’s success depends upon how many
customers it has, how much they buy, and how often
they buy
• Satisfied customers increase in numbers, buy more
and buy more frequently
• Satisfied customers also pay their bills promptly,
which greatly improves cash flow - life blood of an
organization
46.
Customer and quality
•Manufacturing and service organizations are
using customer satisfaction as the measure of
quality
• Important for national as well as international
competition
47.
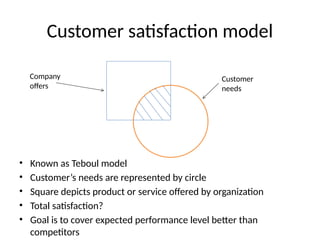
Customer satisfaction model
•Known as Teboul model
• Customer’s needs are represented by circle
• Square depicts product or service offered by organization
• Total satisfaction?
• Goal is to cover expected performance level better than
competitors
Company
offers
Customer
needs
48.
Types of Customers
•External - outside the organization (people
who pay the bills or purchase the products.)
• End-user customers
• One who influences sale of the product or
service
• E.g. McDonald’s Happy meal customer
• Not easy to determine
49.
• Internal -people within your organization who
receive your work
• Each person in process is considered a
customer of preceding operation
50.
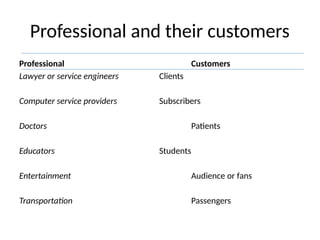
Professional and theircustomers
Professional Customers
Lawyer or service engineers Clients
Computer service providers Subscribers
Doctors Patients
Educators Students
Entertainment Audience or fans
Transportation Passengers
51.
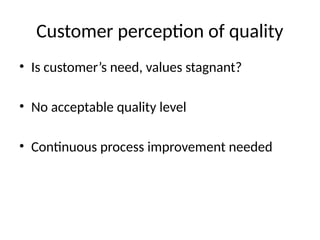
Customer perception ofquality
• Is customer’s need, values stagnant?
• No acceptable quality level
• Continuous process improvement needed
52.
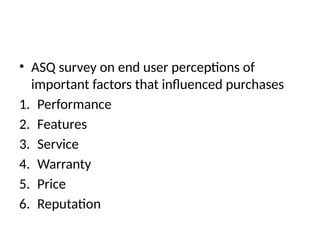
• ASQ surveyon end user perceptions of
important factors that influenced purchases
1. Performance
2. Features
3. Service
4. Warranty
5. Price
6. Reputation
53.
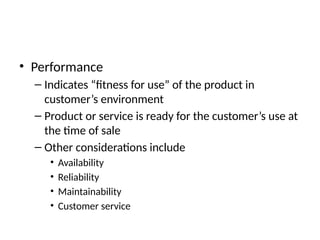
• Performance
– Indicates“fitness for use” of the product in
customer’s environment
– Product or service is ready for the customer’s use at
the time of sale
– Other considerations include
• Availability
• Reliability
• Maintainability
• Customer service
54.
• Performance dependsupon
– Availability: a probability that a product will
operate when needed
– Reliability: freedom from failure over time
– Maintainability: the ease with which the product
can be kept operable
– Customer service: the action or the extent to
which the customer can get assistance from the
manufacturer to keep the product in use
55.
• Features:
– Anyproduct or service involves features or attributes
such as psychological, time oriented, contractual,
ethical and technological
– For example, the primary function of the television is to
view the image, whereas inbuilt video games are a
feature
56.
• Warranty
– Warrantyis an organization’s public profile of a
quality product backed up by guarantee of the
customer satisfaction.
– It forces the organization to focus on the
customer’s perception of quality
57.
– An organizationhas to identify the characteristics
of a product or service quality and importance
that the customer attaches to each of them
– The warranty encourages the customer to buy the
service by reducing the risk of purchase decision,
and it generates more sales by enhancing the
loyalty of the product towards customers
58.
• Reputation
– Whena customer is emotionally attached with a
product or service and wants to see that his
money is spent in the right direction, it makes the
reputation of the product
– Due to this the customer wants to see that his
money is spent in the right direction, he rates the
organizations by overall experience with them
– Good experiences always retain the customer
59.
– Customer iswilling to pay a premium for a known
or trusted brand name
– It costs more to win a new customer than to keep
an existing one
– Customer retention is an important strategy for an
organization
– One of the effective ways of customer retention is
to call the feedback form from the customer and
take action on it for customer’s delight
60.
• Price
– Today’scustomer is willing to spend higher price
for higher values
– Value is the ratio of product’s function to total cost
of the product
– This ratio must be higher even if total cost of the
product increases slightly
61.
Expectations of customers
•On-schedule delivery of the product in an
undamaged condition
• Instructions on the setup or techniques supplied for a
complicated product
• Clearly written training manuals or instructions
provided on proper use, preferably by graphic display
– Refrigerator should be kept in the vertical position and
not horizontal
– Graphical display includes a box tick marked in the vertical
position and cross marked in horizontal position
62.
Expectations of customers
•Well trained technicians to make the quality
repairs
• Friendly service representatives to answer any
question of the customer
• Clearly stated warranty conditions with
prompt service on the claims
63.
Elements of quality
•Quality must be built in the stage of
manufacturing a product rather than
investigating after the product is ready
• Inspection is not an improving quality tool but
a measure of it
• Quality is developed with elements
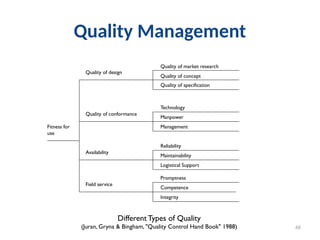
Quality of Design
Thistakes place before production of the product or service. It is
usually determined by the market place.
Quality of Conformance
This is producing to the specification
Availability
This has a time dimension
Field Service
This is an intangible and is the provision of "after sales service"
66.
Quality Management
66
Fitness for
use
Qualityof design
Quality of conformance
Availability
Field service
Quality of market research
Quality of concept
Quality of specification
Technology
Manpower
Management
Reliability
Maintainability
Logistical Support
Promptness
Competence
Integrity
Different Types of Quality
(Juran, Gryna & Bingham, "Quality Control Hand Book" 1988)
67.
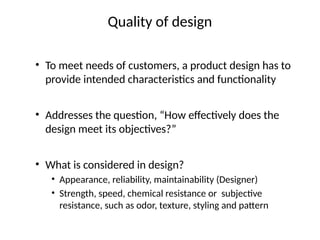
Quality of design
•To meet needs of customers, a product design has to
provide intended characteristics and functionality
• Addresses the question, “How effectively does the
design meet its objectives?”
• What is considered in design?
• Appearance, reliability, maintainability (Designer)
• Strength, speed, chemical resistance or subjective
resistance, such as odor, texture, styling and pattern
68.
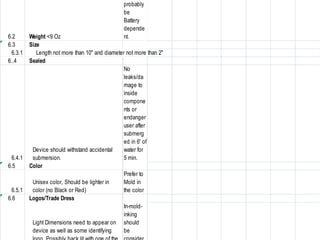
6.2 Weight <9Oz
probably
be
Battery
depende
nt.
6.3 Size
6.3.1 Length not more than 10" and diameter not more than 2"
6..4 Sealed
6.4.1
Device should withstand accidental
submersion.
No
leaks/da
mage to
inside
compone
nts or
endanger
user after
submerg
ed in 6' of
water for
5 min.
6.5 Color
6.5.1
Unisex color, Should be lighter in
color (no Black or Red)
Prefer to
Mold in
the color
6.6 Logos/Trade Dress
Light Dimensions need to appear on
device as well as some identifying
In-mold-
inking
should
be
69.
• Designer mustaim to make a product that would remain
competitive in coming years of product introduction in the
market
• Factor controlling the quality of design
– Types of customer in market: habits, prices, choices and
complaints of existing products
– Production or service capabilities
– Life required
– Safety, reliability and environmental conditions
– Profit and other technical considerations
– Special requirements of a product
– Good after sales service
– Type of packaging and installation required (customer’s assembly
in toys, stationery and so on)
70.
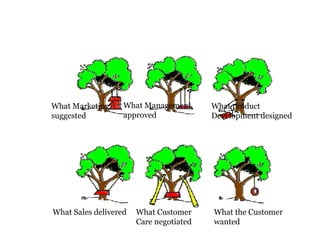
What the Customer
wanted
WhatMarketing
suggested
What Management
approved
What product
Development designed
What Sales delivered What Customer
Care negotiated
71.
Quality of conformance
•Degree to which product actually confirms in
quality with specifications or drawings is known
as quality of conformance
• Also a measure of truthfulness with which a
product conforms to the design and
specifications
• Also refers to the uniformity of characteristics
and consistency of functionality of all the
products units produced every day
72.
• It considersbasic manufacturing process and availability of adequate and skilled man
power capable of producing the product or service
• Factors affecting quality of conformance
– Standard quality of design and selection of process
– Design of production process
– Performance of machinery or materials
– Skill and efficiency of operators
– Proper motivation methods of employees
– Training of operators
– High level of maintenance of measuring instruments
– Feedback from customers regarding the performance of a product or service
– Standard inspection procedures
– Correct transportation of product to the installation phases
– Degree of tolerance
– Capability of equipments used
– The extent to which design lends itself to production
– Monitoring process to assess conformance
– Taking corrective action when necessary
– Ease of use: user instructions are important
73.
• Availability
– Itis total time for which the product is available to
deliver its intended function during its total span
of life cycle
– It is calculated as ratio of operating time to the
operating time plus downtime
Availability = Operating time/(Operating time + downtime)
74.
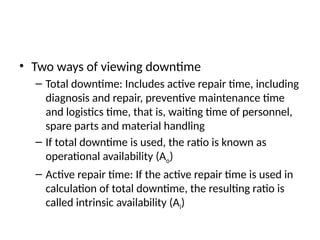
• Two waysof viewing downtime
– Total downtime: Includes active repair time, including
diagnosis and repair, preventive maintenance time
and logistics time, that is, waiting time of personnel,
spare parts and material handling
– If total downtime is used, the ratio is known as
operational availability (Ao)
– Active repair time: If the active repair time is used in
calculation of total downtime, the resulting ratio is
called intrinsic availability (Ai)
75.
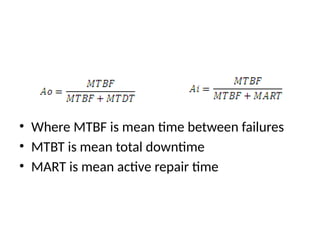
• Where MTBFis mean time between failures
• MTBT is mean total downtime
• MART is mean active repair time
76.
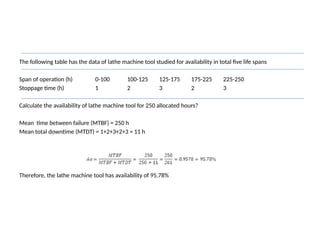
The following tablehas the data of lathe machine tool studied for availability in total five life spans
Span of operation (h) 0-100 100-125 125-175 175-225 225-250
Stoppage time (h) 1 2 3 2 3
Calculate the availability of lathe machine tool for 250 allocated hours?
Mean time between failure (MTBF) = 250 h
Mean total downtime (MTDT) = 1+2+3+2+3 = 11 h
Therefore, the lathe machine tool has availability of 95.78%
77.
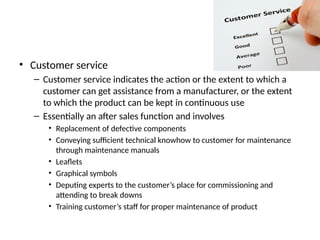
• Customer service
–Customer service indicates the action or the extent to which a
customer can get assistance from a manufacturer, or the extent
to which the product can be kept in continuous use
– Essentially an after sales function and involves
• Replacement of defective components
• Conveying sufficient technical knowhow to customer for maintenance
through maintenance manuals
• Leaflets
• Graphical symbols
• Deputing experts to the customer’s place for commissioning and
attending to break downs
• Training customer’s staff for proper maintenance of product
78.
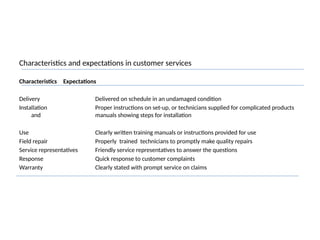
Characteristics and expectationsin customer services
Characteristics Expectations
Delivery Delivered on schedule in an undamaged condition
Installation Proper instructions on set-up, or technicians supplied for complicated products
and manuals showing steps for installation
Use Clearly written training manuals or instructions provided for use
Field repair Properly trained technicians to promptly make quality repairs
Service representatives Friendly service representatives to answer the questions
Response Quick response to customer complaints
Warranty Clearly stated with prompt service on claims
79.
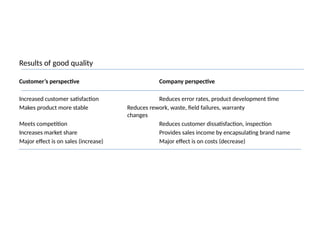
Results of goodquality
Customer’s perspective Company perspective
Increased customer satisfaction Reduces error rates, product development time
Makes product more stable Reduces rework, waste, field failures, warranty
changes
Meets competition Reduces customer dissatisfaction, inspection
Increases market share Provides sales income by encapsulating brand name
Major effect is on sales (increase) Major effect is on costs (decrease)
80.
Consequences of poordesign
• Loss of business
– Poor design or defective products result in loss of
business
– Toyota car
81.
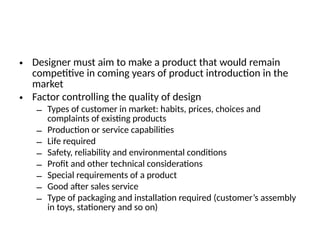
Recall timeline
• Sep26, 2007 – US: 55,000 Camry and ES 350 cars in "all-weather" floor mat recall.[31]
• Nov 02, 2009 – US: 3.8 million Toyota and Lexus vehicles again recalled due to floor mat problem, this time for all driver's side mats.[5]
• Nov 26, 2009 – US: floor mat recall amended to include brake override[4] and increased to 4.2 million vehicles.[citation needed]
• Jan 21, 2010 – US: 2.3 million Toyota vehicles recalled due to faulty accelerator pedals[6] (of those, 2.1 million already involved in floor mat
recall).[3]
• Jan 27, 2010 – US: 1.1 million Toyotas added to amended floor mat recall.[32]
• Jan 29, 2010 – Europe, China: 1.8 million Toyotas added to faulty accelerator pedal recall.[7]
• Feb 08, 2010 – Worldwide: 436,000 hybrid vehicles in brake recall following 200 reports of Prius brake glitches.[2]
• Feb 08, 2010 – US: 7,300 MY 2010 Camry vehicles recalled over potential brake tube problems.[33]
• Feb 12, 2010 – US: 8,000 MY 2010 4WD Tacoma pick-up trucks recalled over concerns about possible defective front drive shafts.[34]
• Apr 16, 2010 – US: 600,000 MY 1998–2010 Sienna minivans for possible corrosion of spare tire carrier cable.[35]
• Apr 19, 2010 – World: 21,000 MY 2010 Toyota Land Cruiser Prado and 13,000 Lexus GX 460 SUV's recalled to reprogram the stability
control system.[36][37]
• Apr 28, 2010 – US: 50,000 MY 2003 Toyota Sequoia recalled to reprogram the stability control system.[38]
• May 21, 2010 – Japan: 4,509, US: 7,000 MY 2010 LS for steering system software update[39]
• July 5, 2010 – World: 270,000 Crown and Lexus models for valve springs with potential production issue.[40]
• July 29, 2010 – US: 412,000 Avalons and LX 470s for replacement of steering column components.[41]
• August 28, 2010 – US & Canada: approximately 1.13 million Corolla and Corolla Matrix vehicles produced between 2005 and 2008 for
Engine Control Modules (ECM) that may have been improperly manufactured.[42]
• February 8, 2011 – US: NASA and NHTSA inquiry reveals that there were no electronic faults in Toyota cars that would have caused
acceleration issues. However, accelerator pedal entrapments remains a problem.[43]
• February 22, 2011 – US: Toyota recalls an additional 2.17 million vehicles for gas pedals that become trapped on floor hardware.[44]
http://en.wikipedia.org/wiki/2009%E2%80%932011_Toyota_vehicle_recalls
82.
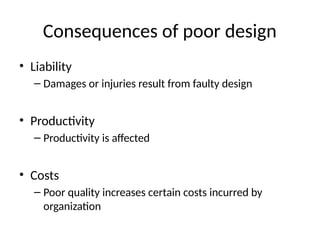
Consequences of poordesign
• Liability
– Damages or injuries result from faulty design
• Productivity
– Productivity is affected
• Costs
– Poor quality increases certain costs incurred by
organization
83.
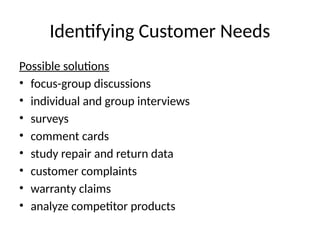
Identifying Customer Needs
Possiblesolutions
• focus-group discussions
• individual and group interviews
• surveys
• comment cards
• study repair and return data
• customer complaints
• warranty claims
• analyze competitor products

![Recall timeline
• Sep 26, 2007 – US: 55,000 Camry and ES 350 cars in "all-weather" floor mat recall.[31]
• Nov 02, 2009 – US: 3.8 million Toyota and Lexus vehicles again recalled due to floor mat problem, this time for all driver's side mats.[5]
• Nov 26, 2009 – US: floor mat recall amended to include brake override[4] and increased to 4.2 million vehicles.[citation needed]
• Jan 21, 2010 – US: 2.3 million Toyota vehicles recalled due to faulty accelerator pedals[6] (of those, 2.1 million already involved in floor mat
recall).[3]
• Jan 27, 2010 – US: 1.1 million Toyotas added to amended floor mat recall.[32]
• Jan 29, 2010 – Europe, China: 1.8 million Toyotas added to faulty accelerator pedal recall.[7]
• Feb 08, 2010 – Worldwide: 436,000 hybrid vehicles in brake recall following 200 reports of Prius brake glitches.[2]
• Feb 08, 2010 – US: 7,300 MY 2010 Camry vehicles recalled over potential brake tube problems.[33]
• Feb 12, 2010 – US: 8,000 MY 2010 4WD Tacoma pick-up trucks recalled over concerns about possible defective front drive shafts.[34]
• Apr 16, 2010 – US: 600,000 MY 1998–2010 Sienna minivans for possible corrosion of spare tire carrier cable.[35]
• Apr 19, 2010 – World: 21,000 MY 2010 Toyota Land Cruiser Prado and 13,000 Lexus GX 460 SUV's recalled to reprogram the stability
control system.[36][37]
• Apr 28, 2010 – US: 50,000 MY 2003 Toyota Sequoia recalled to reprogram the stability control system.[38]
• May 21, 2010 – Japan: 4,509, US: 7,000 MY 2010 LS for steering system software update[39]
• July 5, 2010 – World: 270,000 Crown and Lexus models for valve springs with potential production issue.[40]
• July 29, 2010 – US: 412,000 Avalons and LX 470s for replacement of steering column components.[41]
• August 28, 2010 – US & Canada: approximately 1.13 million Corolla and Corolla Matrix vehicles produced between 2005 and 2008 for
Engine Control Modules (ECM) that may have been improperly manufactured.[42]
• February 8, 2011 – US: NASA and NHTSA inquiry reveals that there were no electronic faults in Toyota cars that would have caused
acceleration issues. However, accelerator pedal entrapments remains a problem.[43]
• February 22, 2011 – US: Toyota recalls an additional 2.17 million vehicles for gas pedals that become trapped on floor hardware.[44]
http://en.wikipedia.org/wiki/2009%E2%80%932011_Toyota_vehicle_recalls](https://image.slidesharecdn.com/mukhtiyar-251214142740-9eaa5998/85/Much-needed-Quality-Control-Tools-in-digital-pptx-81-320.jpg)