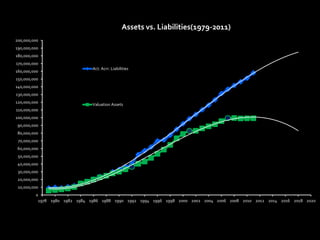
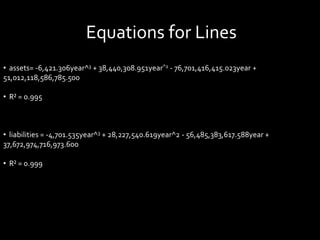
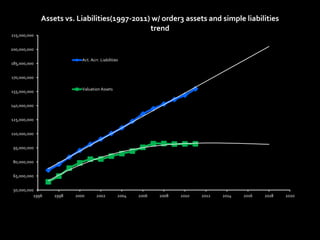
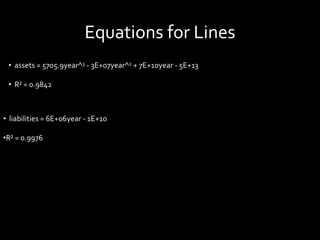
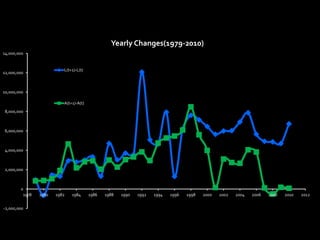
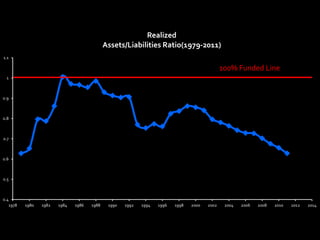
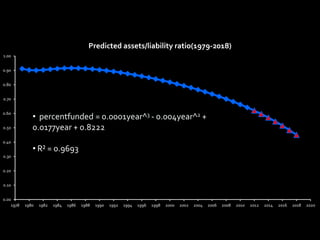
SlideShare a Scribd company logo
Asset/Liabilities
Analysis
By: James Regan, Kelsey Hopper, Nolan
Dowd, Brett Edelbeck, Patrick Brodesser
Advisors:Tom McCallum and Albert Cohen
Overview
 ChangesWe’ve Made
 MERS Overview
 Assets and Liabilities Predictions
 Future Groups
 Comments, Concerns, Questions
Changes We’ve made!
 Introduced more historical data into model
 Strengthens our analysis and shows us previously unseen
information
 New form of testing, using time series analysis
 Explored several more options and looked at
patterns/trends to help our predictions
MERS DATA
 Using the appendix(MERS) and pension data, we matched
most of the asset/liability values in the MERS Report. (See
Excel doc)
 To find amount of benefits paid out(payroll), used formula:
Benefit Multiplier x FAC xYears of Service +(80% max FAC)
 Difficulties matching valuation assets and payroll to MERS
report
Asset and Liabilities Predictions
 Predicted both assets and liabilities using a non-linear
regression model
 Gathered estimates from both models and took their
ratio(assets/liabilities) to obtain a predicted funded ratio
0
10,000,000
20,000,000
30,000,000
40,000,000
50,000,000
60,000,000
70,000,000
80,000,000
90,000,000
100,000,000
110,000,000
120,000,000
130,000,000
140,000,000
150,000,000
160,000,000
170,000,000
180,000,000
190,000,000
200,000,000
1978 1980 1982 1984 1986 1988 1990 1992 1994 1996 1998 2000 2002 2004 2006 2008 2010 2012 2014 2016 2018 2020
Assets vs. Liabilities(1979-2011)
Act. Acrr. Liabilities
Valuation Assets
Equations for Lines
• assets= -6,421.306year^3 + 38,440,308.951year^2 - 76,701,416,415.023year +
51,012,118,586,785.500
• R² = 0.995
• liabilities = -4,701.535year^3 + 28,227,540.619year^2 - 56,485,383,617.588year +
37,672,974,716,973.600
• R² = 0.999
50,000,000
65,000,000
80,000,000
95,000,000
110,000,000
125,000,000
140,000,000
155,000,000
170,000,000
185,000,000
200,000,000
215,000,000
1996 1998 2000 2002 2004 2006 2008 2010 2012 2014 2016 2018 2020
Assets vs. Liabilities(1997-2011) w/ order3 assets and simple liabilities
trend
Act. Acrr. Liabilities
Valuation Assets
Equations for Lines
• assets = 5705.9year^3 - 3E+07year^2 + 7E+10year - 5E+13
• R² = 0.9842
• liabilities = 6E+06year - 1E+10
•R² = 0.9976
-2,000,000
0
2,000,000
4,000,000
6,000,000
8,000,000
10,000,000
12,000,000
14,000,000
1978 1980 1982 1984 1986 1988 1990 1992 1994 1996 1998 2000 2002 2004 2006 2008 2010 2012
Yearly Changes(1979-2010)
L(t+1)-L(t)
A(t+1)-A(t)
0.4
0.5
0.6
0.7
0.8
0.9
1
1.1
1978 1980 1982 1984 1986 1988 1990 1992 1994 1996 1998 2000 2002 2004 2006 2008 2010 2012 2014
Realized
Assets/Liabilities Ratio(1979-2011)
100% Funded Line
0.00
0.10
0.20
0.30
0.40
0.50
0.60
0.70
0.80
0.90
1.00
1978 1980 1982 1984 1986 1988 1990 1992 1994 1996 1998 2000 2002 2004 2006 2008 2010 2012 2014 2016 2018 2020
Predicted assets/liability ratio(1979-2018)
y = 0.0001x3 - 0.004x2 + 0.0177x + 0.8222
R² = 0.9693
• percentfunded = 0.0001year^3 - 0.004year^2 +
0.0177year + 0.8222
• R² = 0.9693
Things Future Groups Could Do!
 “It’s the future, the possibilities are endless”
 Look at investment data from MERS to better predict an asset
return
 Monte Carlo simulation
 Read closer into inflection points to deduce causal effects
 Inflection point- where a graph switches from increasing to
decreasing
 Find a way to incorporate mortality tables
 Would need to be given more information on individual employees
per division
 Mortality tables would show when certain liabilities’ would be freed
up.
Comments/Concerns/Questions
????????????????????????????????????????????????????????
????????????????????????????????????????????????????????
????????????????????????????????????????????????????????
????????????????????????????????????????????????????????
????????????????????????????????????????????????????????
????????????????????????????????????????????????????????
????????????????????????????????????????????????????????
????????????????????????????????????????????????????????
????????????????????????????????????????????????????????
????????????????????????????????????????????????????????
????????????????????????????????????????????????????????

More Related Content

Similar to MTH 491B pp

Getting things right: optimal tax policy with labor market duality
Getting things right: optimal tax policy with labor market dualityGetting things right: optimal tax policy with labor market duality
Getting things right: optimal tax policy with labor market duality
Gilbert Mbara
 
Demand Forcasting
Demand ForcastingDemand Forcasting
Demand Forcasting
itsvineeth209
 
Forcast2
Forcast2Forcast2
Forcast2
martinizo
 
Business forecasting decomposition & exponential smoothing - bhawani nandan...
Business forecasting   decomposition & exponential smoothing - bhawani nandan...Business forecasting   decomposition & exponential smoothing - bhawani nandan...
Business forecasting decomposition & exponential smoothing - bhawani nandan...
Bhawani N Prasad
 
Budget AnalysisARAPAHOE COUNTY BUDGET PROJECTION 1ST WAY (Regressi.docx
Budget AnalysisARAPAHOE COUNTY BUDGET PROJECTION 1ST WAY (Regressi.docxBudget AnalysisARAPAHOE COUNTY BUDGET PROJECTION 1ST WAY (Regressi.docx
Budget AnalysisARAPAHOE COUNTY BUDGET PROJECTION 1ST WAY (Regressi.docx
richardnorman90310
 
Intro to econometrics
Intro to econometricsIntro to econometrics
Intro to econometrics
Gaetan Lion
 
OPM101Chapter.ppt
OPM101Chapter.pptOPM101Chapter.ppt
OPM101Chapter.ppt
VasudevPur
 
Two Means, Two Dependent Samples, Matched Pairs
Two Means, Two Dependent Samples, Matched PairsTwo Means, Two Dependent Samples, Matched Pairs
Two Means, Two Dependent Samples, Matched Pairs
Long Beach City College
 
Spedicato r ininsurance2015
Spedicato r ininsurance2015Spedicato r ininsurance2015
Spedicato r ininsurance2015
Giorgio Alfredo Spedicato
 
Forecasting Techniques
Forecasting TechniquesForecasting Techniques
Forecasting Techniques
Anand Subramaniam
 
Forecasting Techniques
Forecasting TechniquesForecasting Techniques
Forecasting Techniques
guest865c0e0c
 
Time series mnr
Time series mnrTime series mnr
Time series mnr
NH Rao
 
Steven Ramage: UK SDI: Lifecycle
Steven Ramage: UK SDI: LifecycleSteven Ramage: UK SDI: Lifecycle
Steven Ramage: UK SDI: Lifecycle
AGI Geocommunity
 
Environmental Performance and the Cost of Capital: Evidence from REIT Bonds ...
Environmental Performance and the Cost of Capital:  Evidence from REIT Bonds ...Environmental Performance and the Cost of Capital:  Evidence from REIT Bonds ...
Environmental Performance and the Cost of Capital: Evidence from REIT Bonds ...
nilskok
 
Exploring Support Vector Regression - Signals and Systems Project
Exploring Support Vector Regression - Signals and Systems ProjectExploring Support Vector Regression - Signals and Systems Project
Exploring Support Vector Regression - Signals and Systems Project
Surya Chandra
 
SupportVectorRegression
SupportVectorRegressionSupportVectorRegression
SupportVectorRegression
Daniel K
 
Melissa chanegriha
Melissa chanegrihaMelissa chanegriha
Melissa chanegriha
LondonMet PGR Students
 
Brierty limited
Brierty limitedBrierty limited
Brierty limited
Gagan Dharwal
 
Neural Network Model
Neural Network ModelNeural Network Model
Neural Network Model
Eric Esajian
 
Financial Frictions under Learning
Financial Frictions under LearningFinancial Frictions under Learning
Financial Frictions under Learning
GRAPE
 

Similar to MTH 491B pp (20)

Getting things right: optimal tax policy with labor market duality
Getting things right: optimal tax policy with labor market dualityGetting things right: optimal tax policy with labor market duality
Getting things right: optimal tax policy with labor market duality
 
Demand Forcasting
Demand ForcastingDemand Forcasting
Demand Forcasting
 
Forcast2
Forcast2Forcast2
Forcast2
 
Business forecasting decomposition & exponential smoothing - bhawani nandan...
Business forecasting   decomposition & exponential smoothing - bhawani nandan...Business forecasting   decomposition & exponential smoothing - bhawani nandan...
Business forecasting decomposition & exponential smoothing - bhawani nandan...
 
Budget AnalysisARAPAHOE COUNTY BUDGET PROJECTION 1ST WAY (Regressi.docx
Budget AnalysisARAPAHOE COUNTY BUDGET PROJECTION 1ST WAY (Regressi.docxBudget AnalysisARAPAHOE COUNTY BUDGET PROJECTION 1ST WAY (Regressi.docx
Budget AnalysisARAPAHOE COUNTY BUDGET PROJECTION 1ST WAY (Regressi.docx
 
Intro to econometrics
Intro to econometricsIntro to econometrics
Intro to econometrics
 
OPM101Chapter.ppt
OPM101Chapter.pptOPM101Chapter.ppt
OPM101Chapter.ppt
 
Two Means, Two Dependent Samples, Matched Pairs
Two Means, Two Dependent Samples, Matched PairsTwo Means, Two Dependent Samples, Matched Pairs
Two Means, Two Dependent Samples, Matched Pairs
 
Spedicato r ininsurance2015
Spedicato r ininsurance2015Spedicato r ininsurance2015
Spedicato r ininsurance2015
 
Forecasting Techniques
Forecasting TechniquesForecasting Techniques
Forecasting Techniques
 
Forecasting Techniques
Forecasting TechniquesForecasting Techniques
Forecasting Techniques
 
Time series mnr
Time series mnrTime series mnr
Time series mnr
 
Steven Ramage: UK SDI: Lifecycle
Steven Ramage: UK SDI: LifecycleSteven Ramage: UK SDI: Lifecycle
Steven Ramage: UK SDI: Lifecycle
 
Environmental Performance and the Cost of Capital: Evidence from REIT Bonds ...
Environmental Performance and the Cost of Capital:  Evidence from REIT Bonds ...Environmental Performance and the Cost of Capital:  Evidence from REIT Bonds ...
Environmental Performance and the Cost of Capital: Evidence from REIT Bonds ...
 
Exploring Support Vector Regression - Signals and Systems Project
Exploring Support Vector Regression - Signals and Systems ProjectExploring Support Vector Regression - Signals and Systems Project
Exploring Support Vector Regression - Signals and Systems Project
 
SupportVectorRegression
SupportVectorRegressionSupportVectorRegression
SupportVectorRegression
 
Melissa chanegriha
Melissa chanegrihaMelissa chanegriha
Melissa chanegriha
 
Brierty limited
Brierty limitedBrierty limited
Brierty limited
 
Neural Network Model
Neural Network ModelNeural Network Model
Neural Network Model
 
Financial Frictions under Learning
Financial Frictions under LearningFinancial Frictions under Learning
Financial Frictions under Learning
 

MTH 491B pp