Download as ODP, PPTX
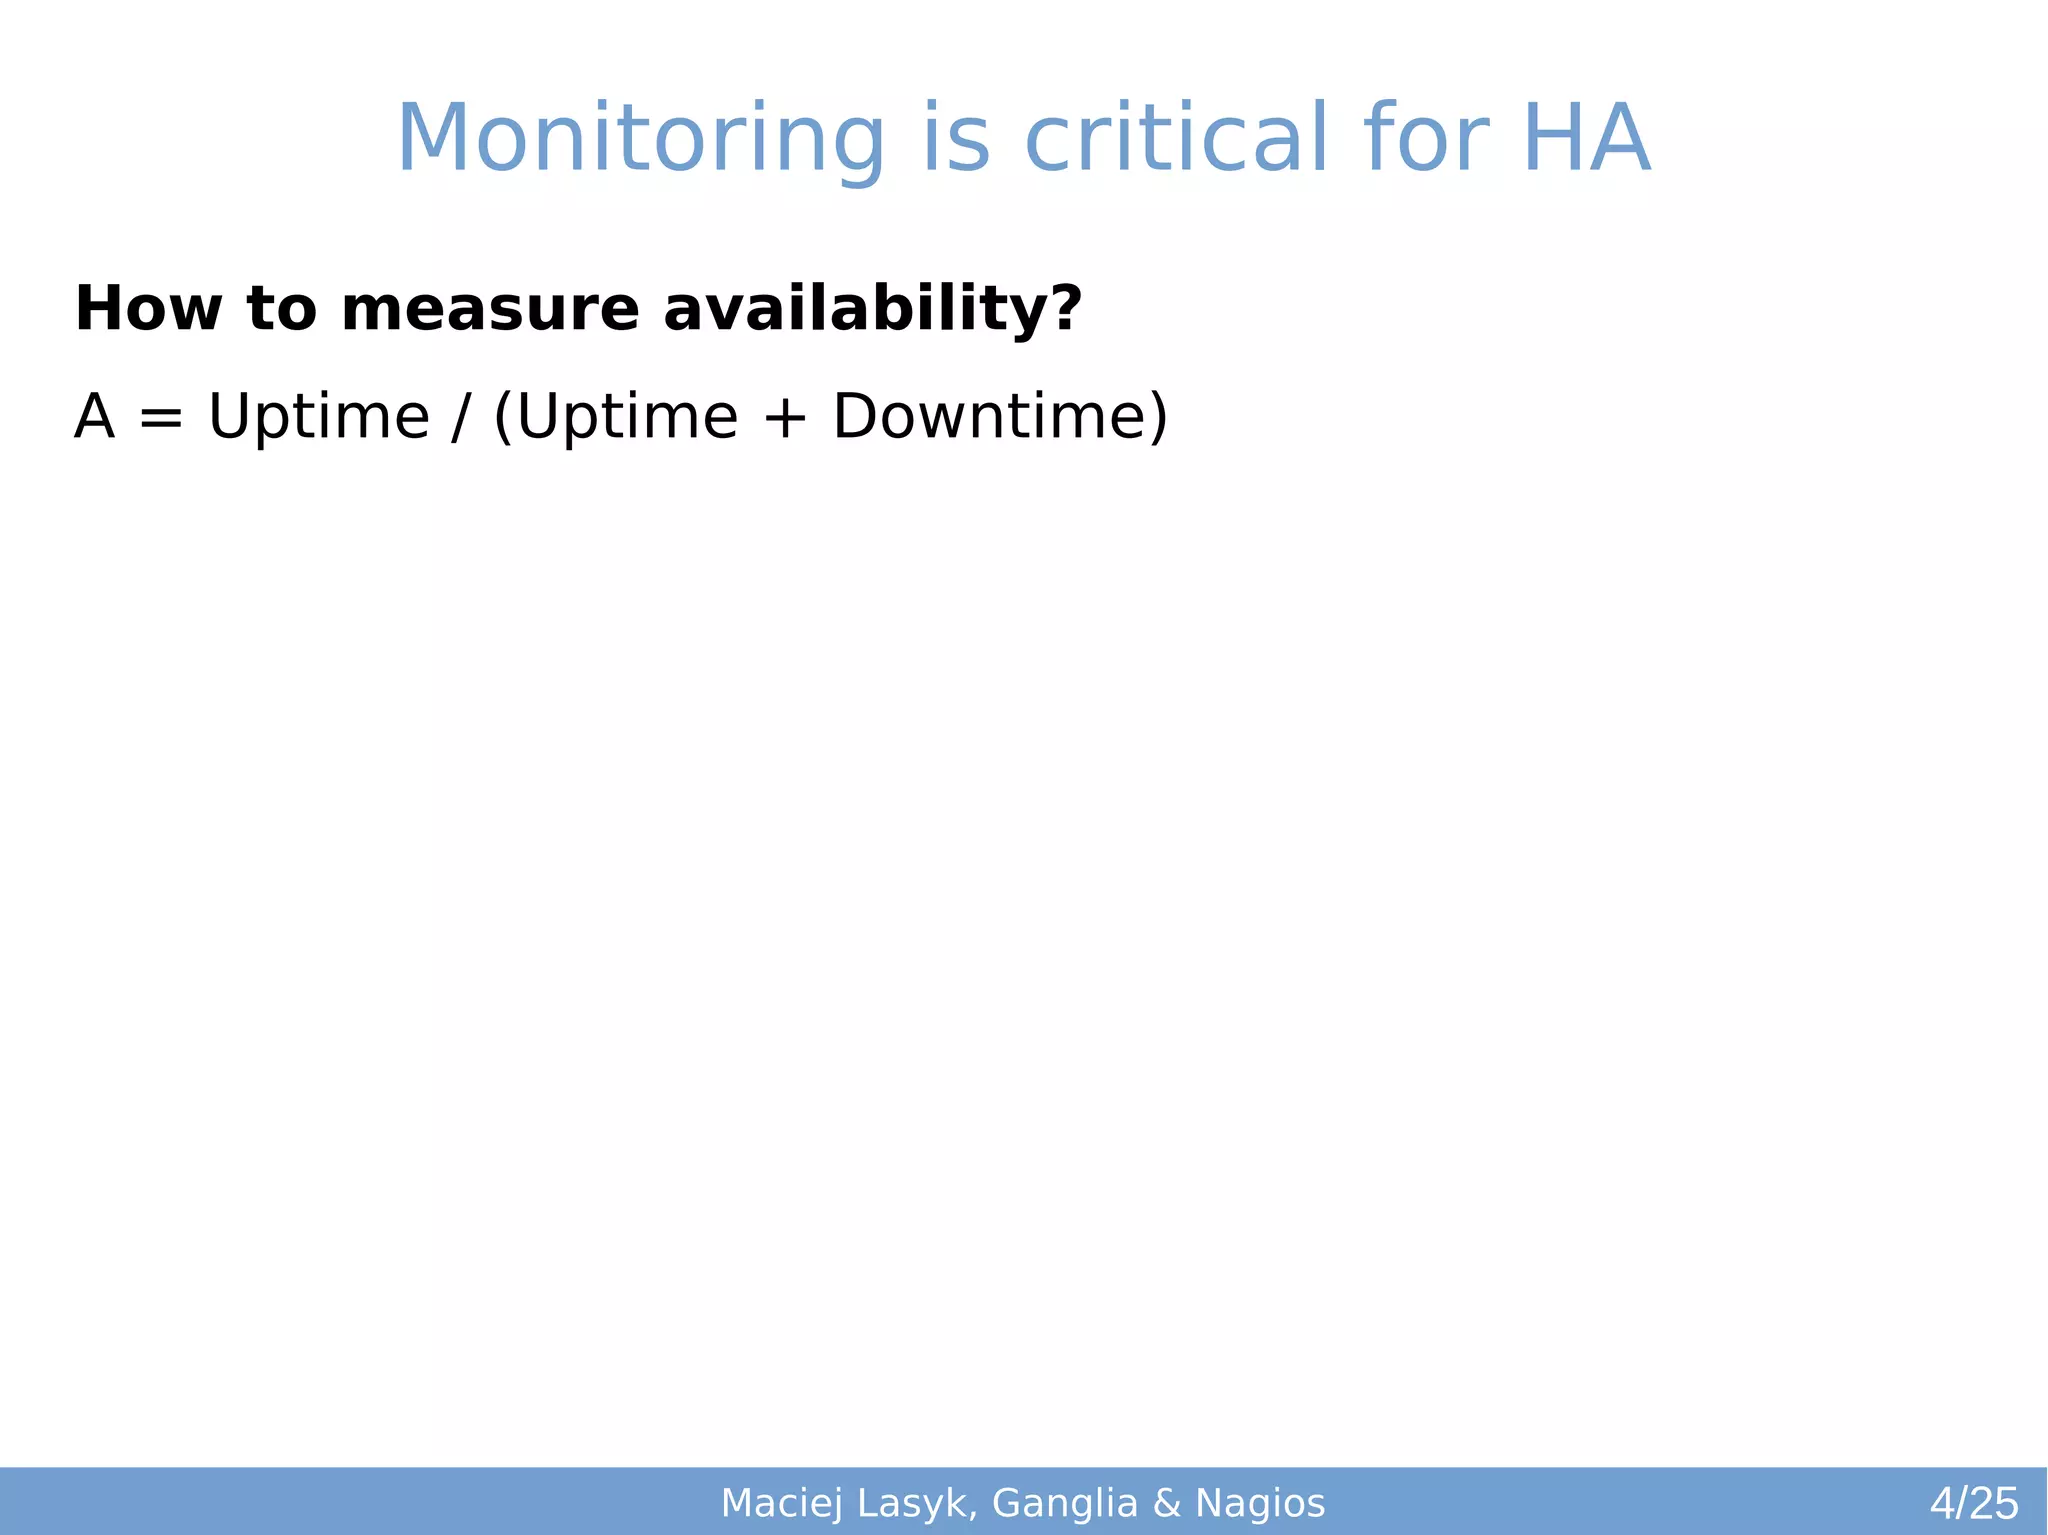
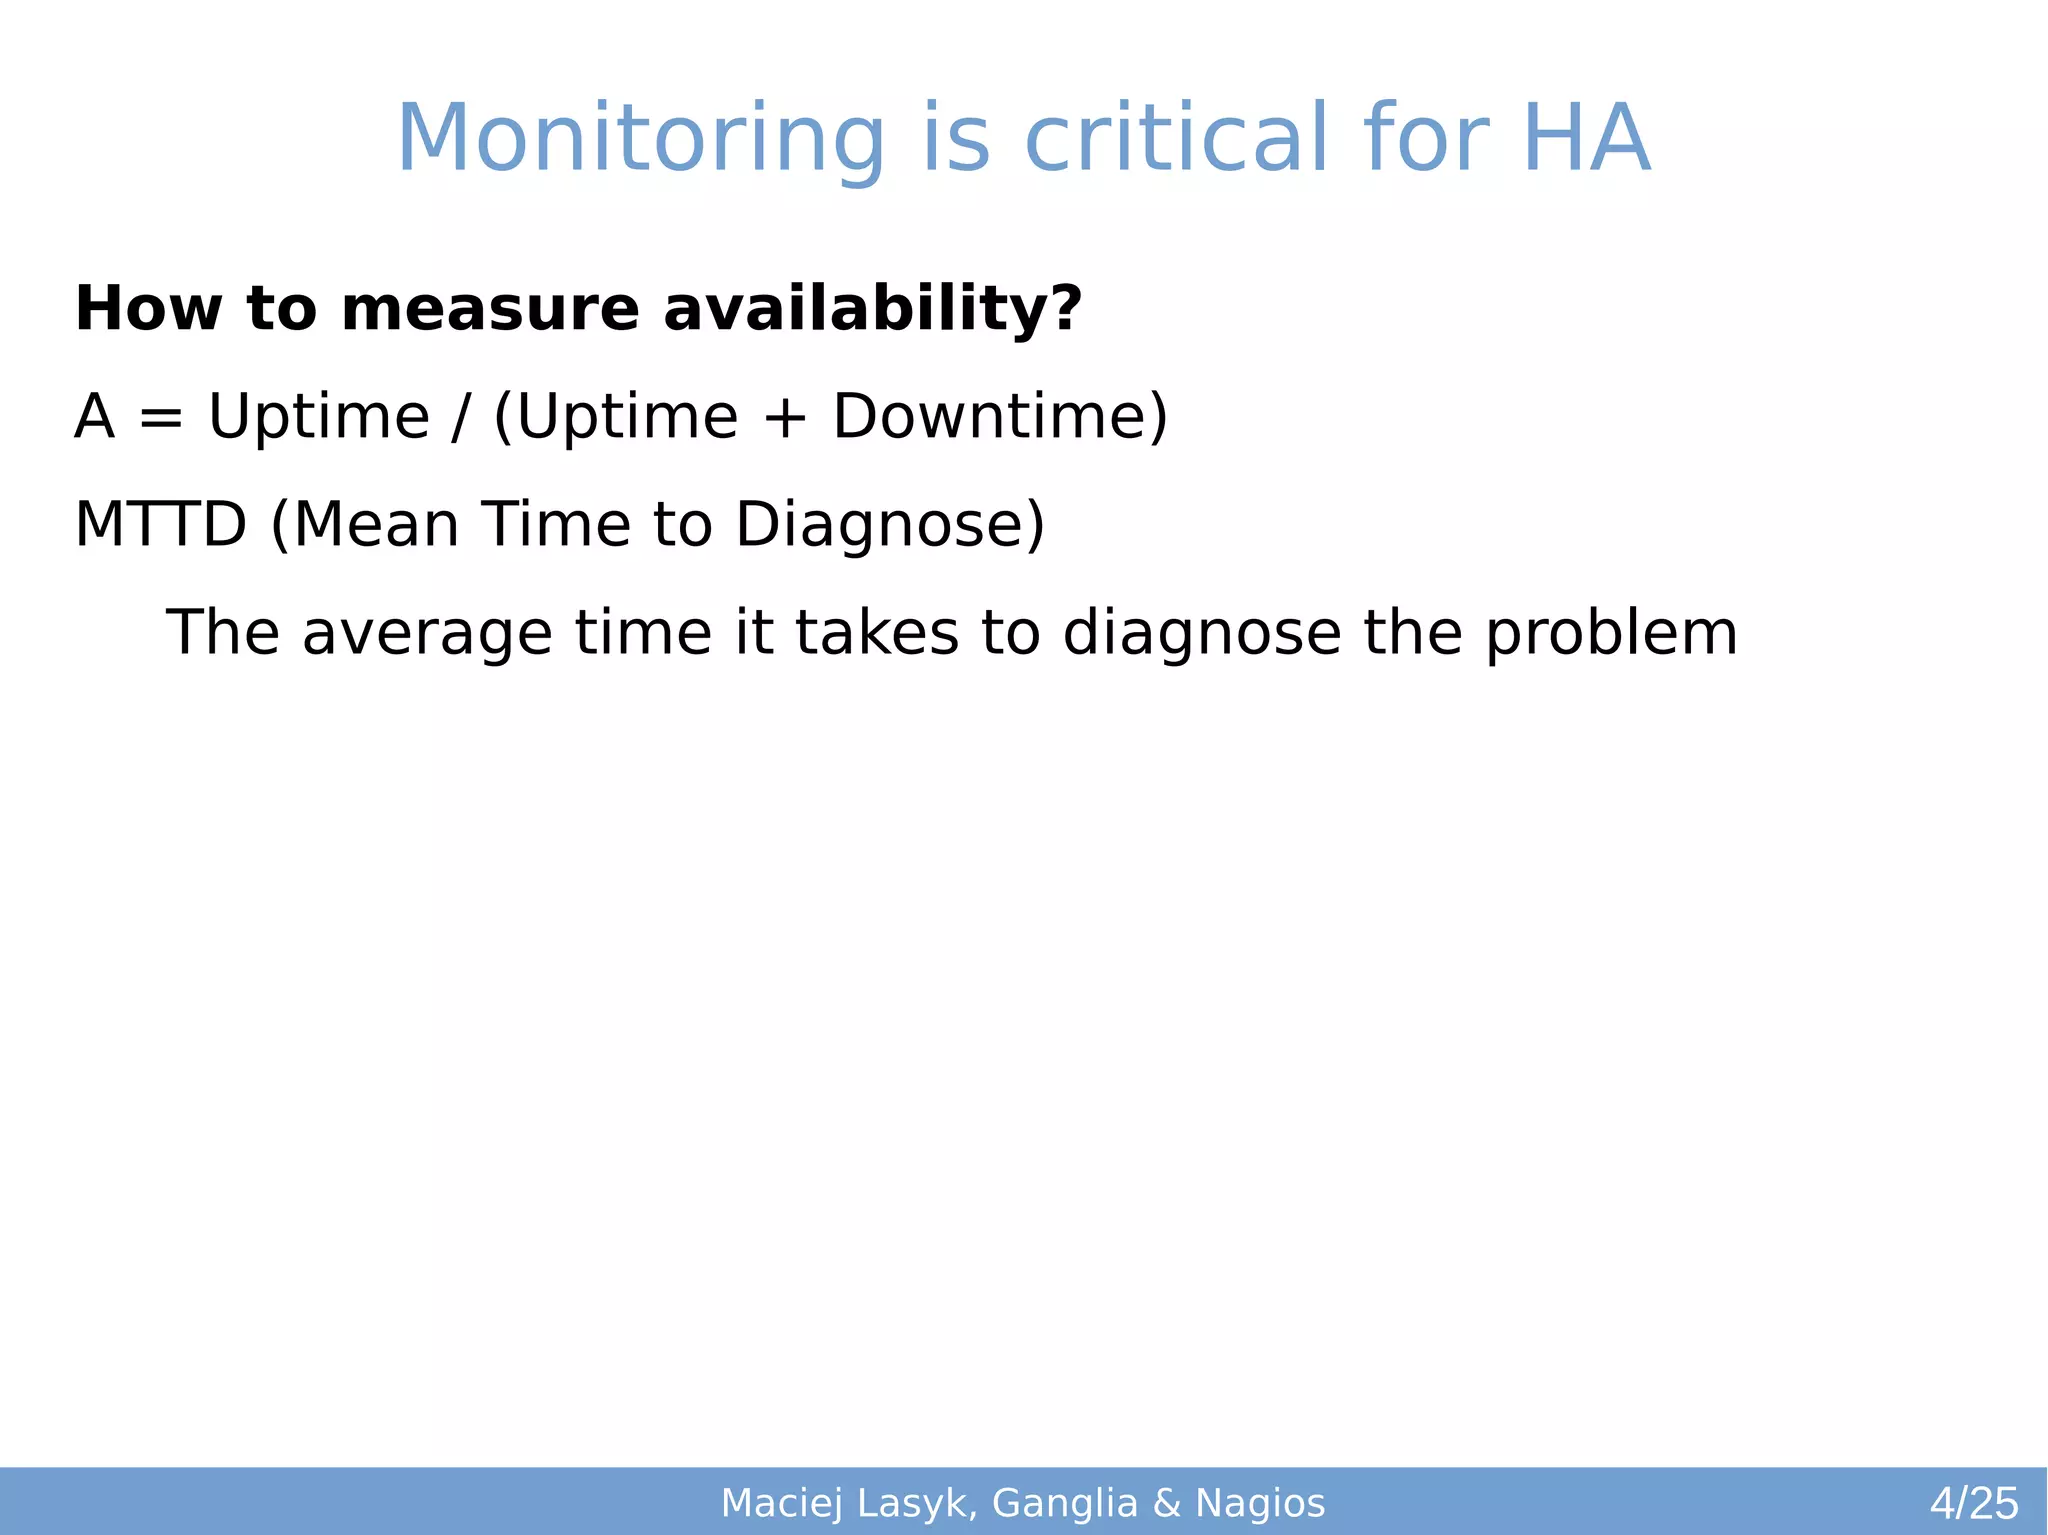
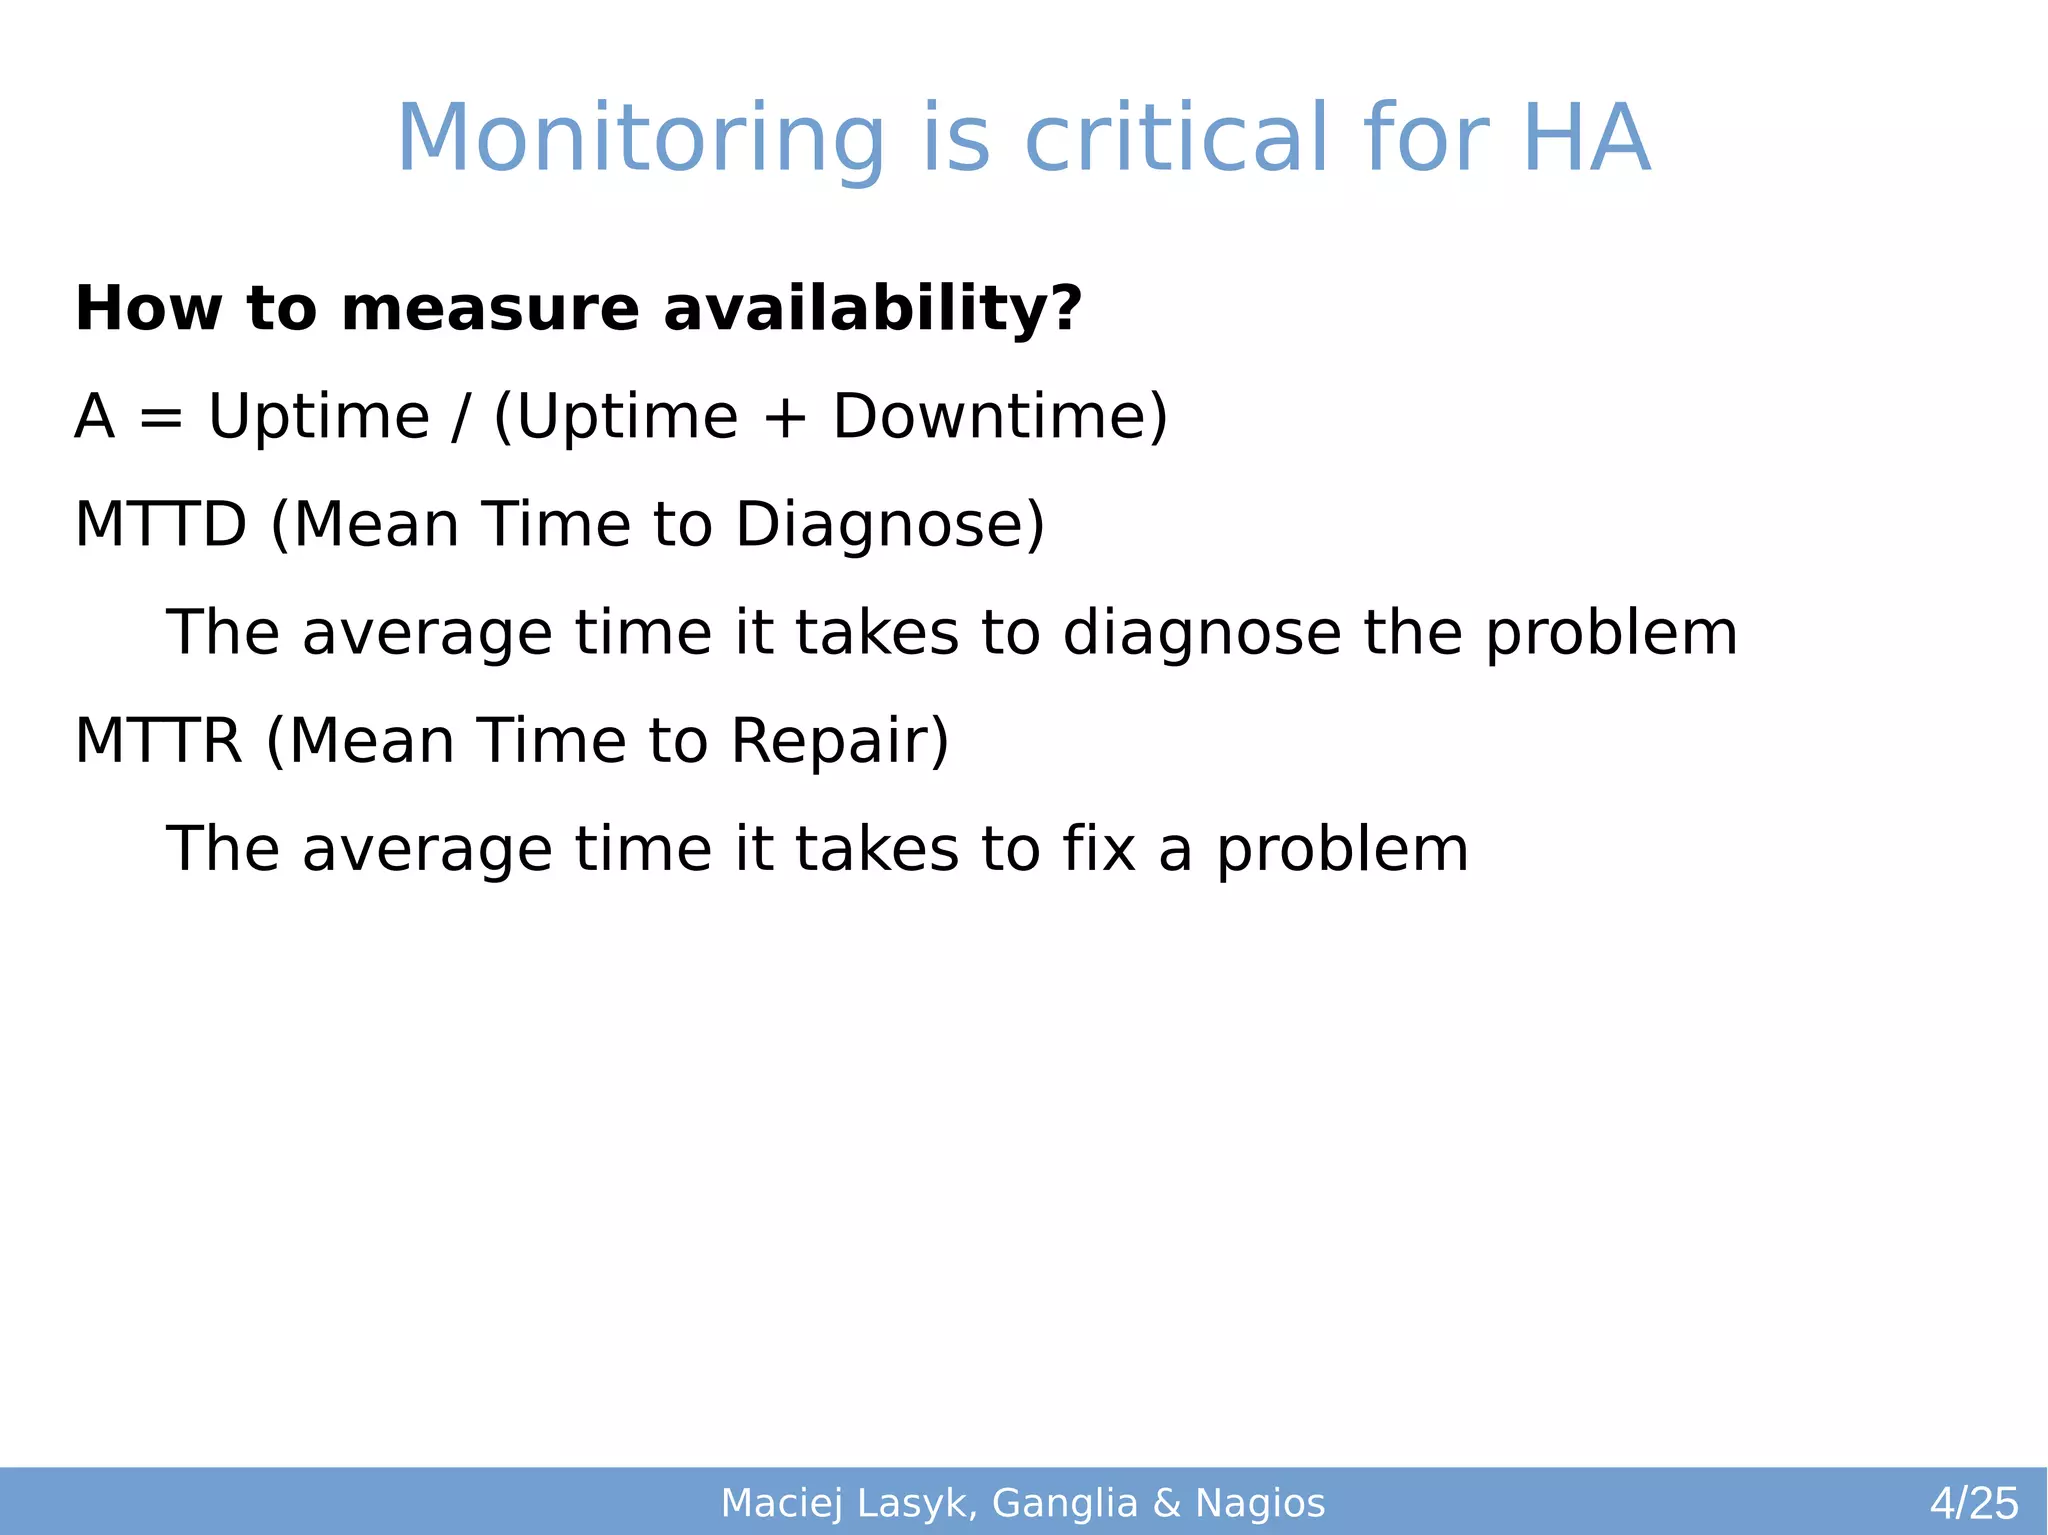
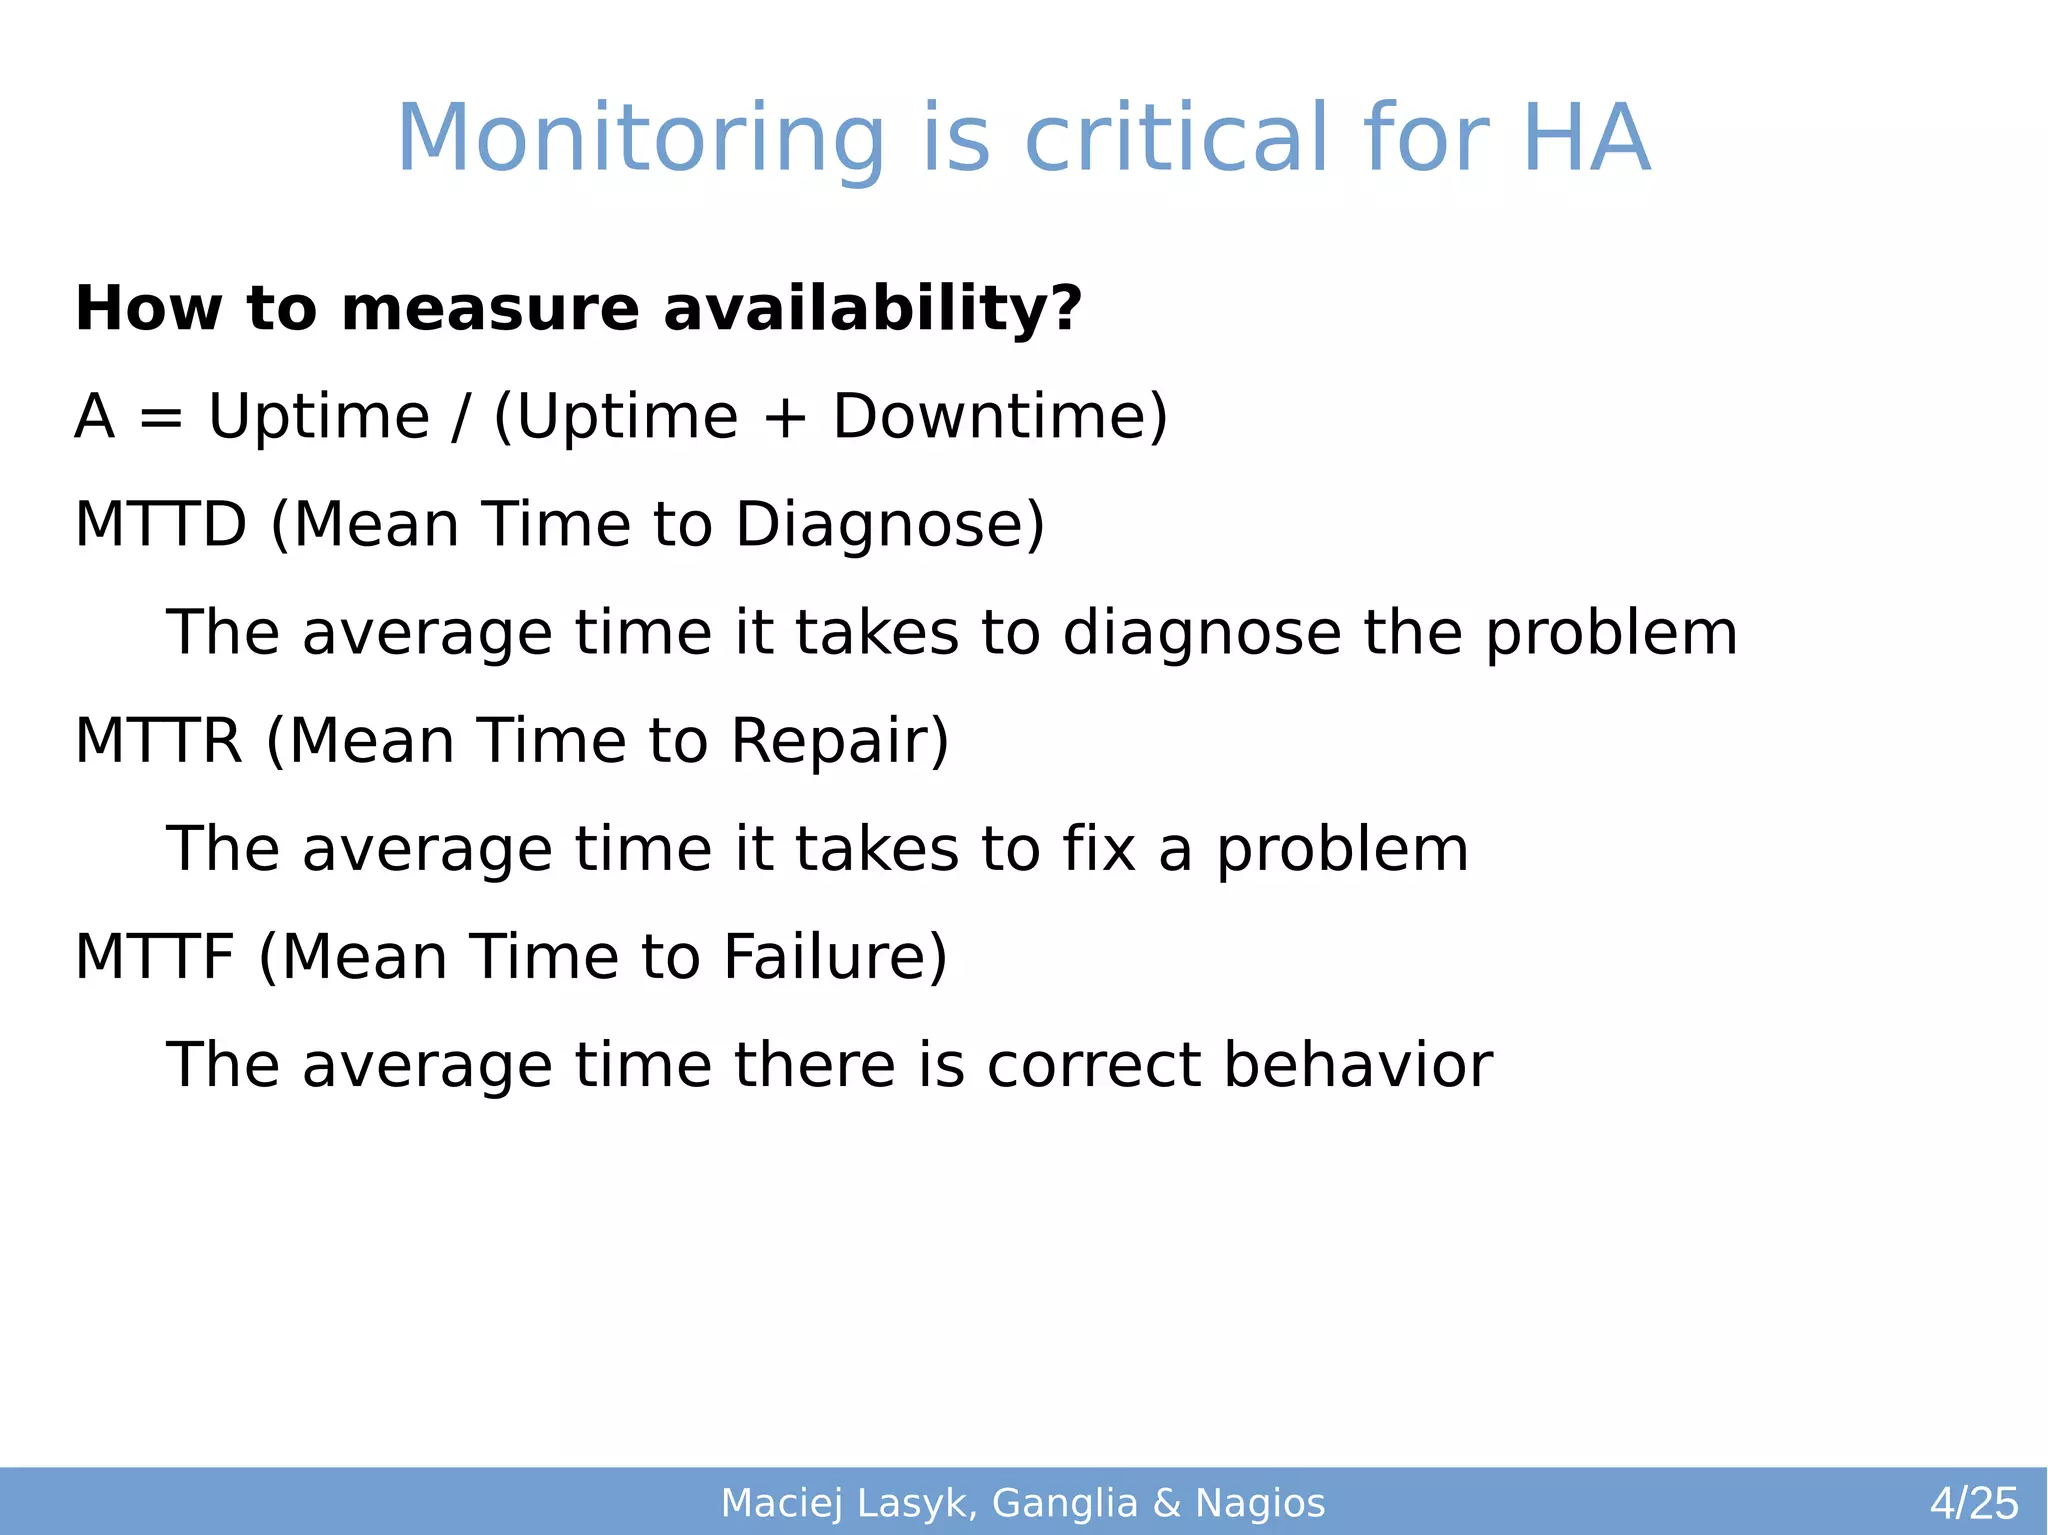
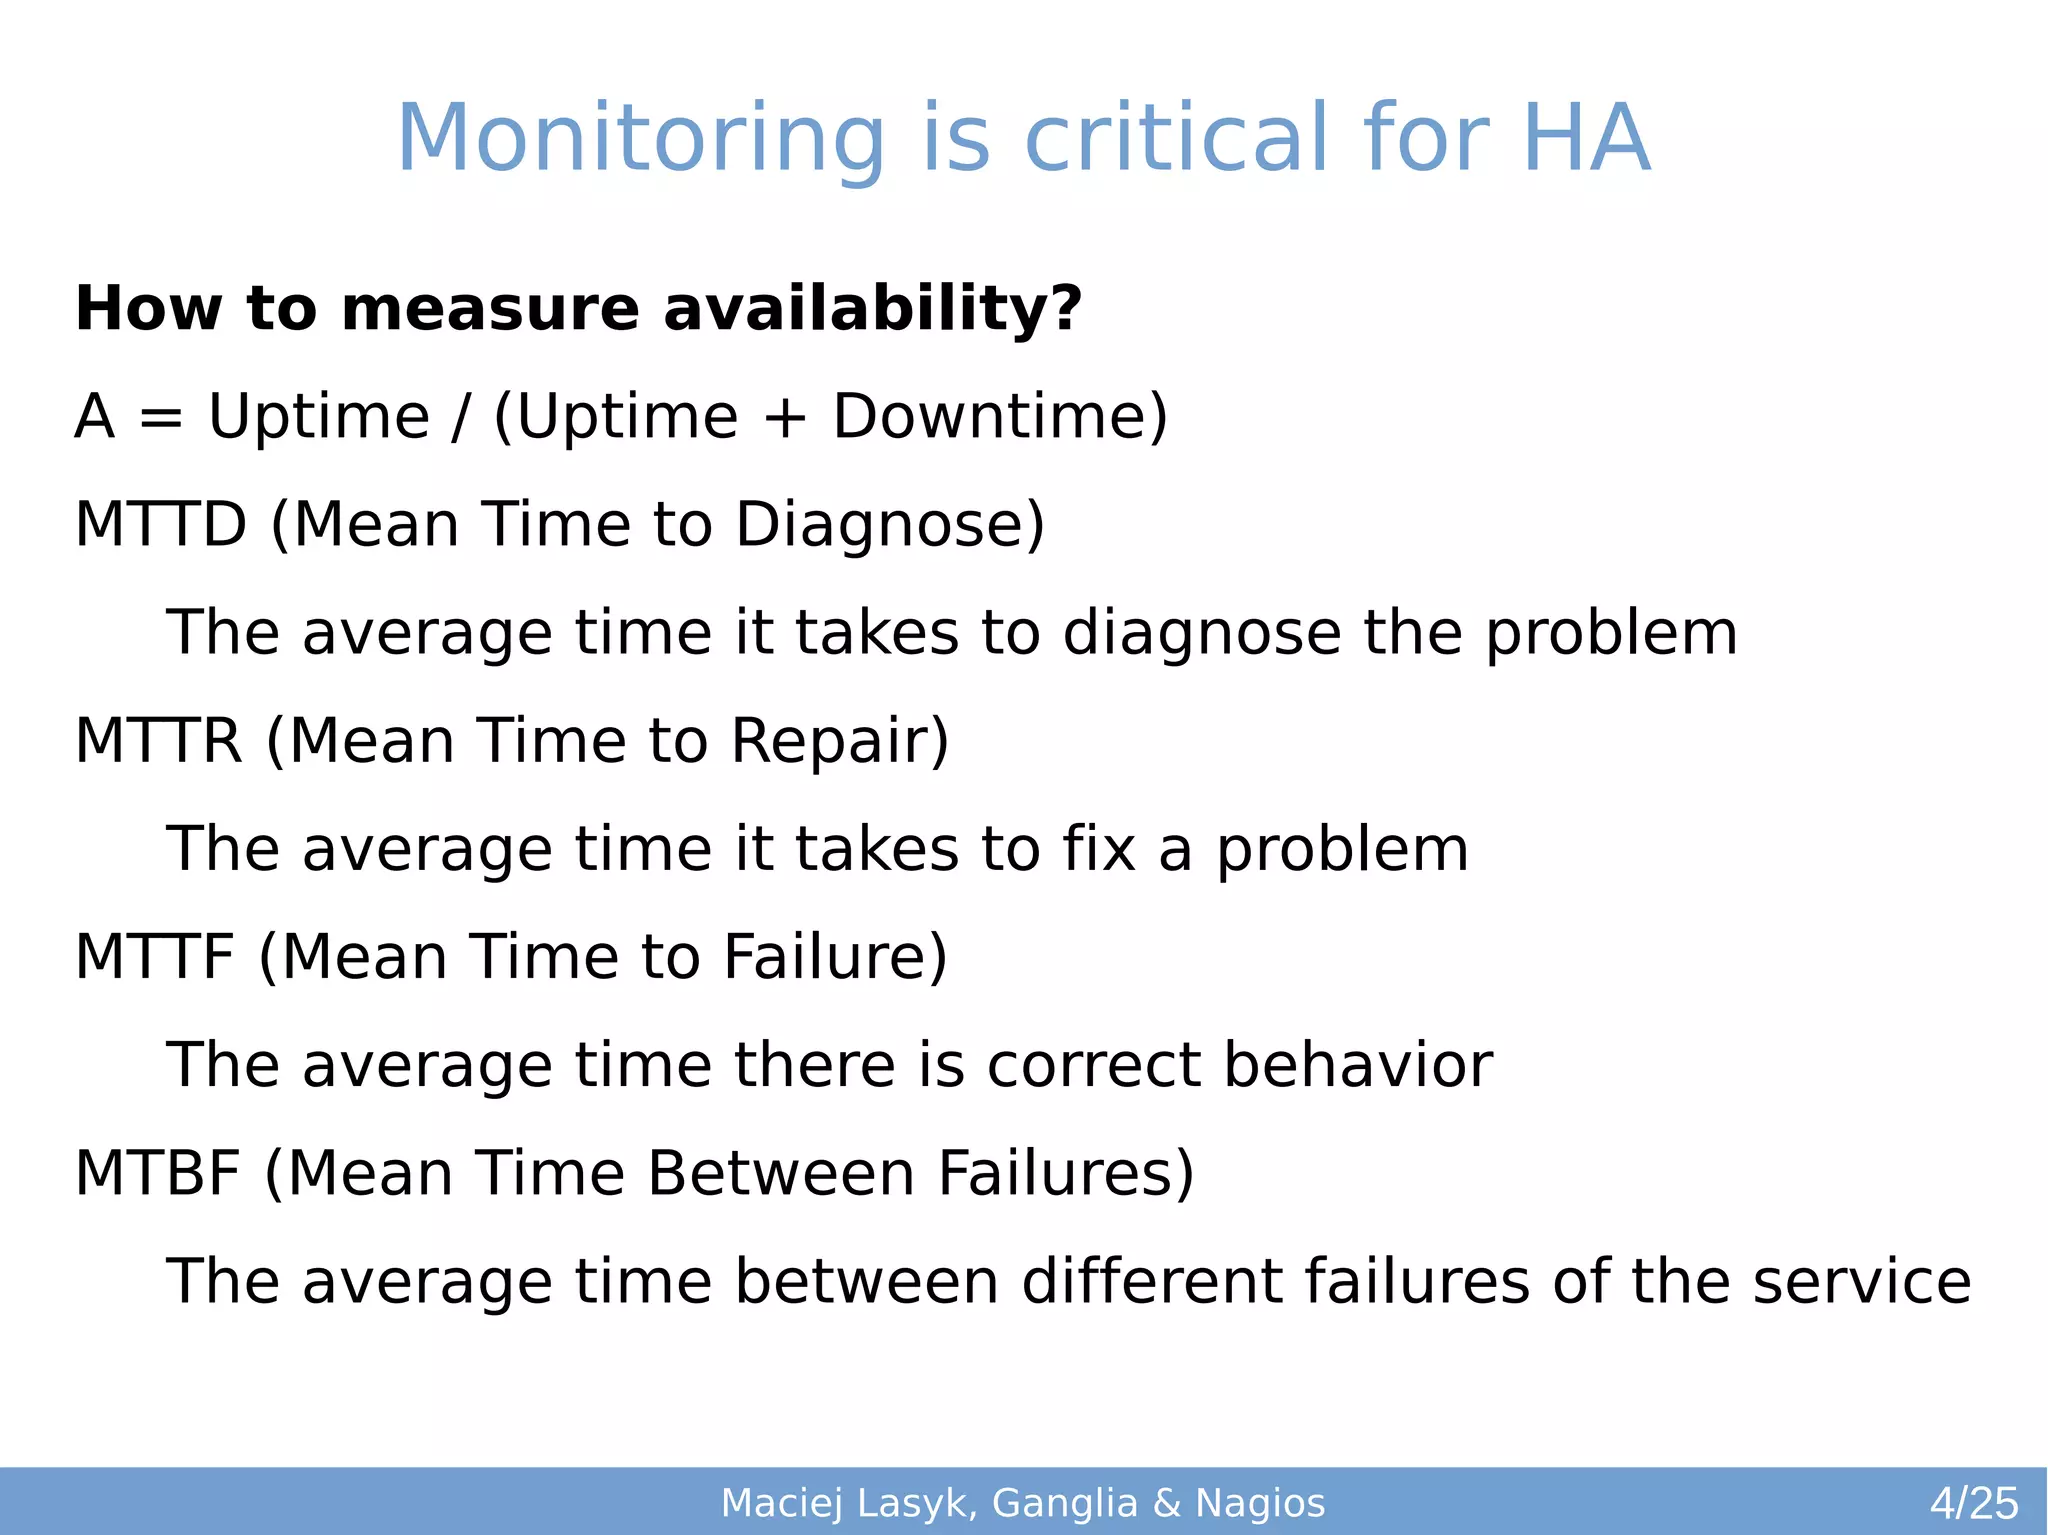
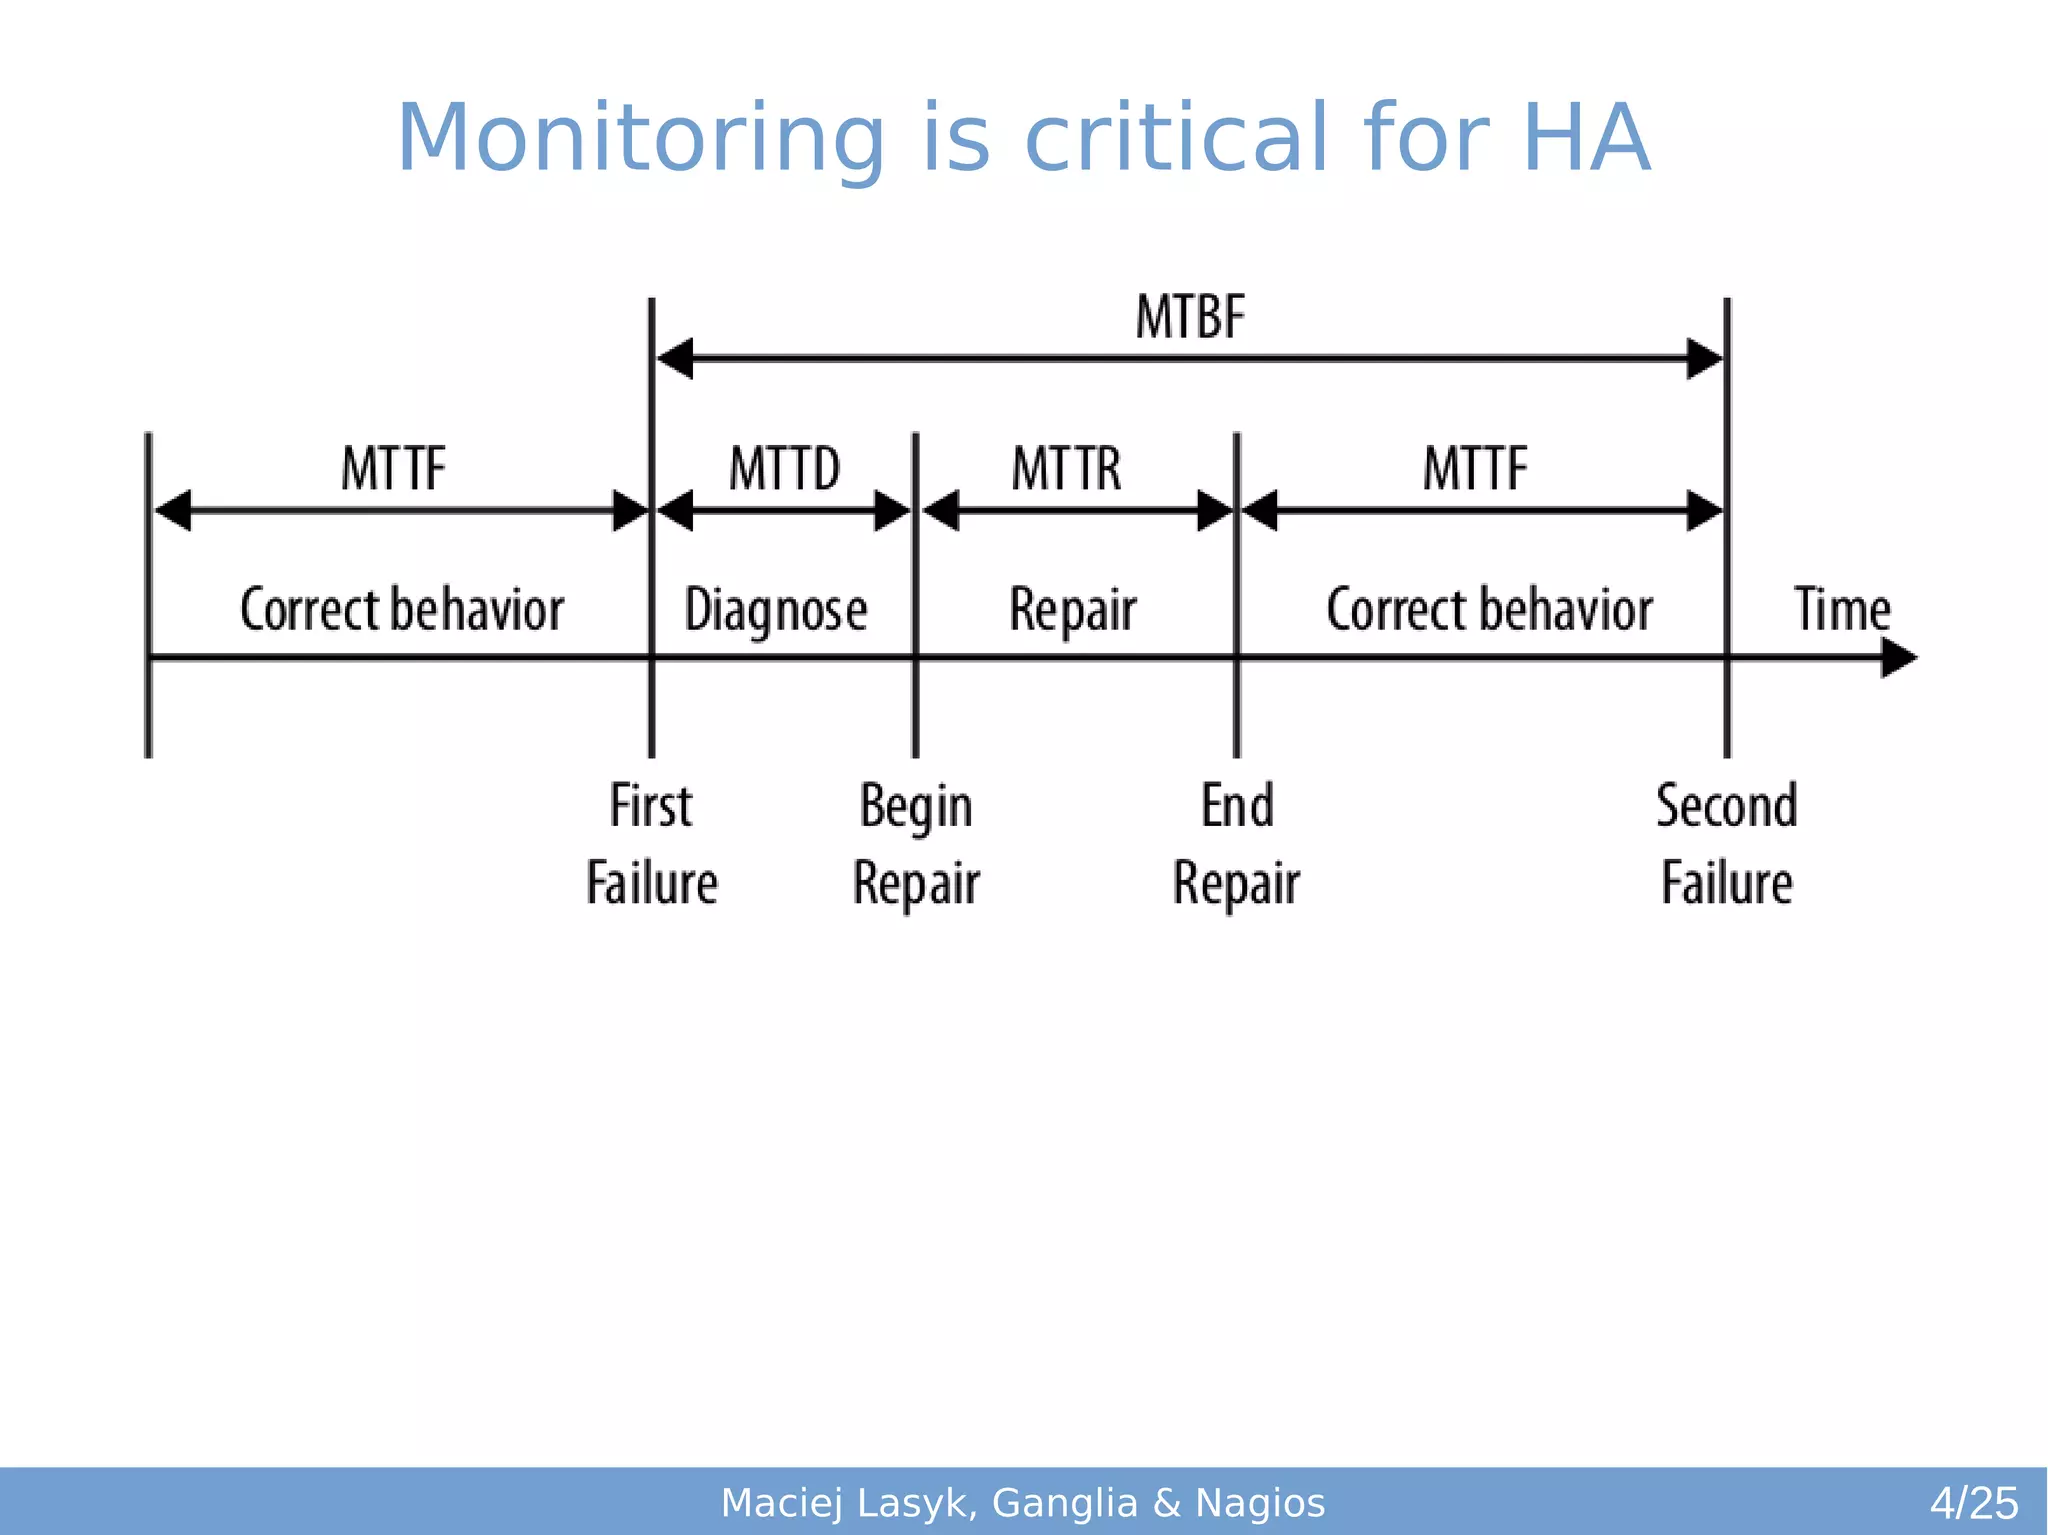
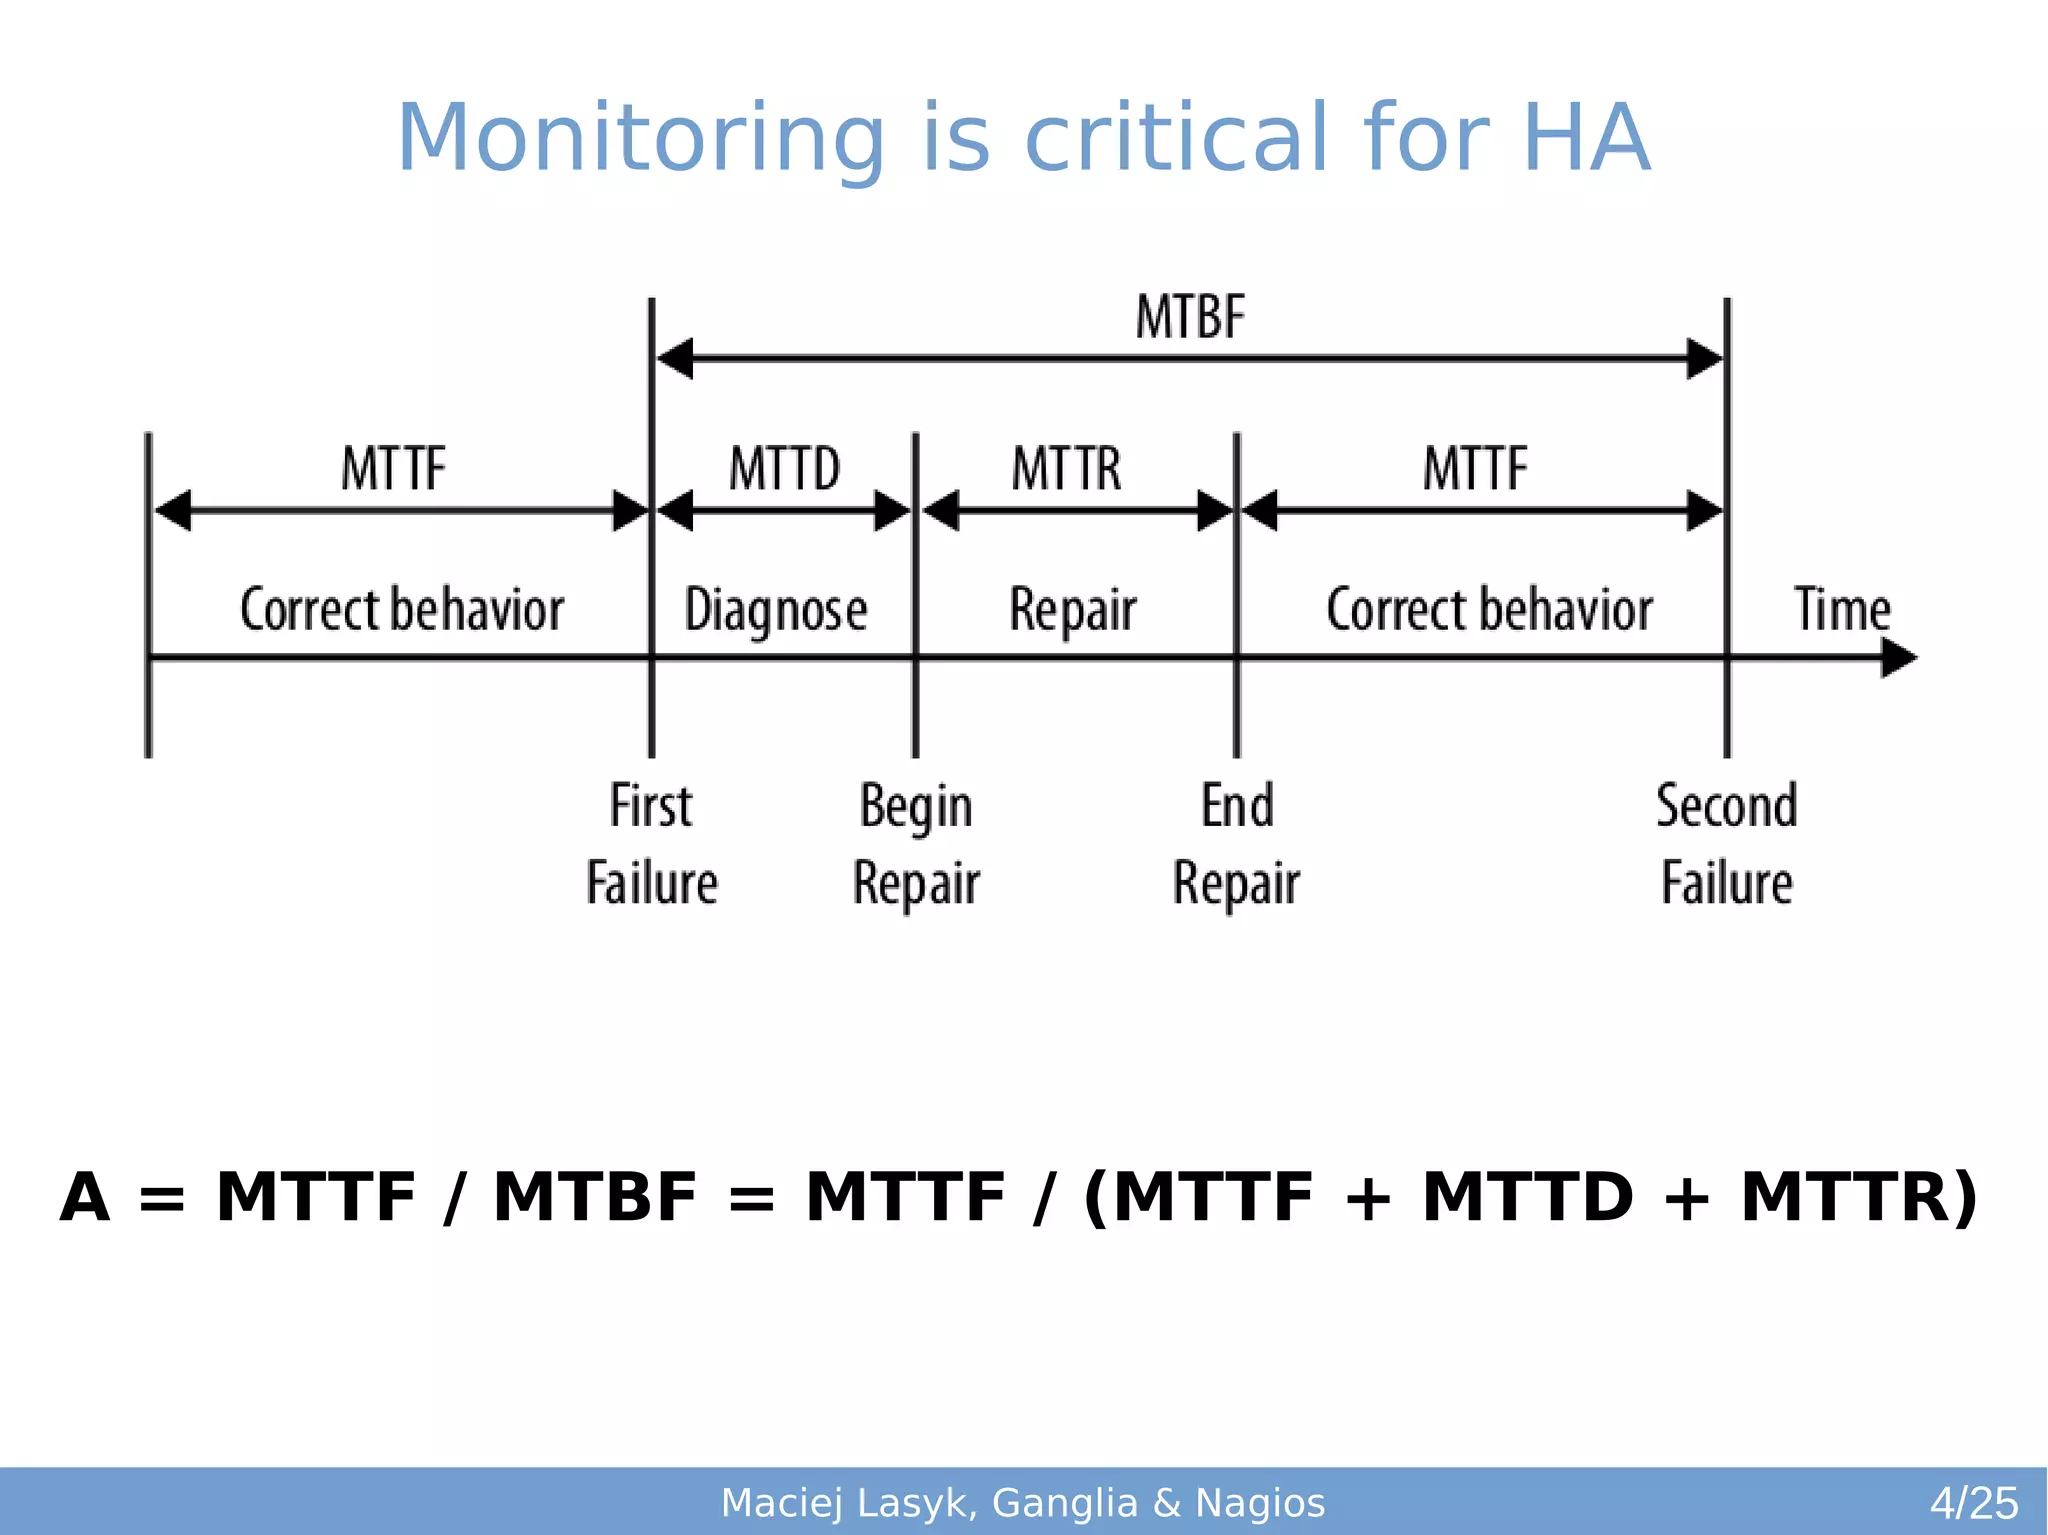
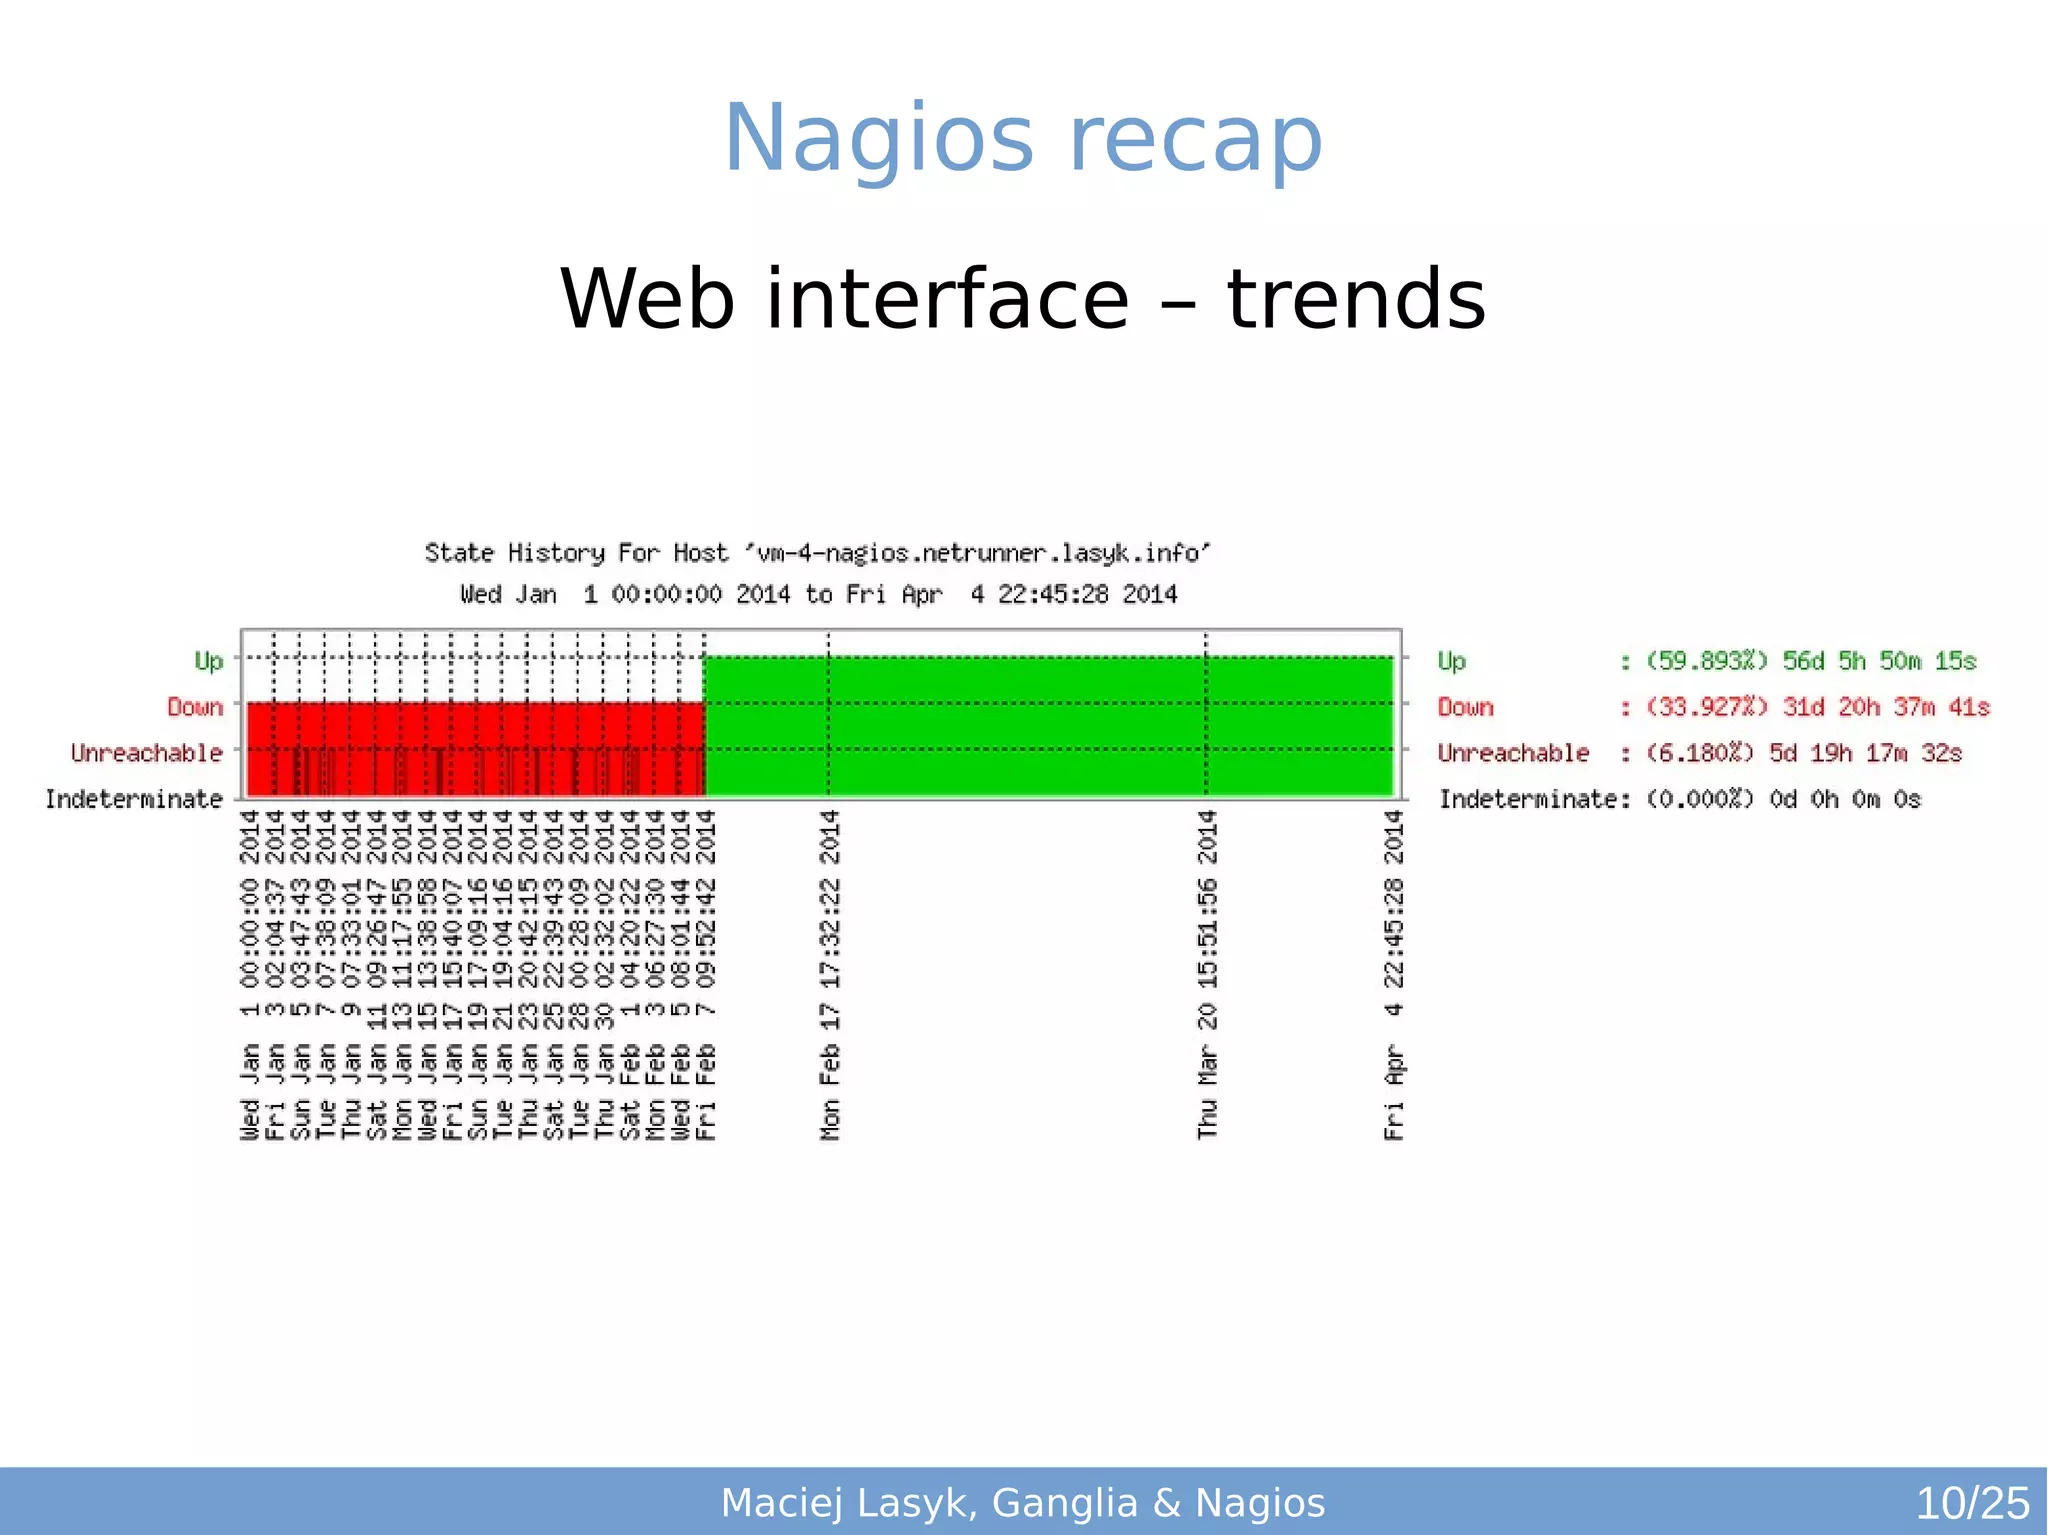
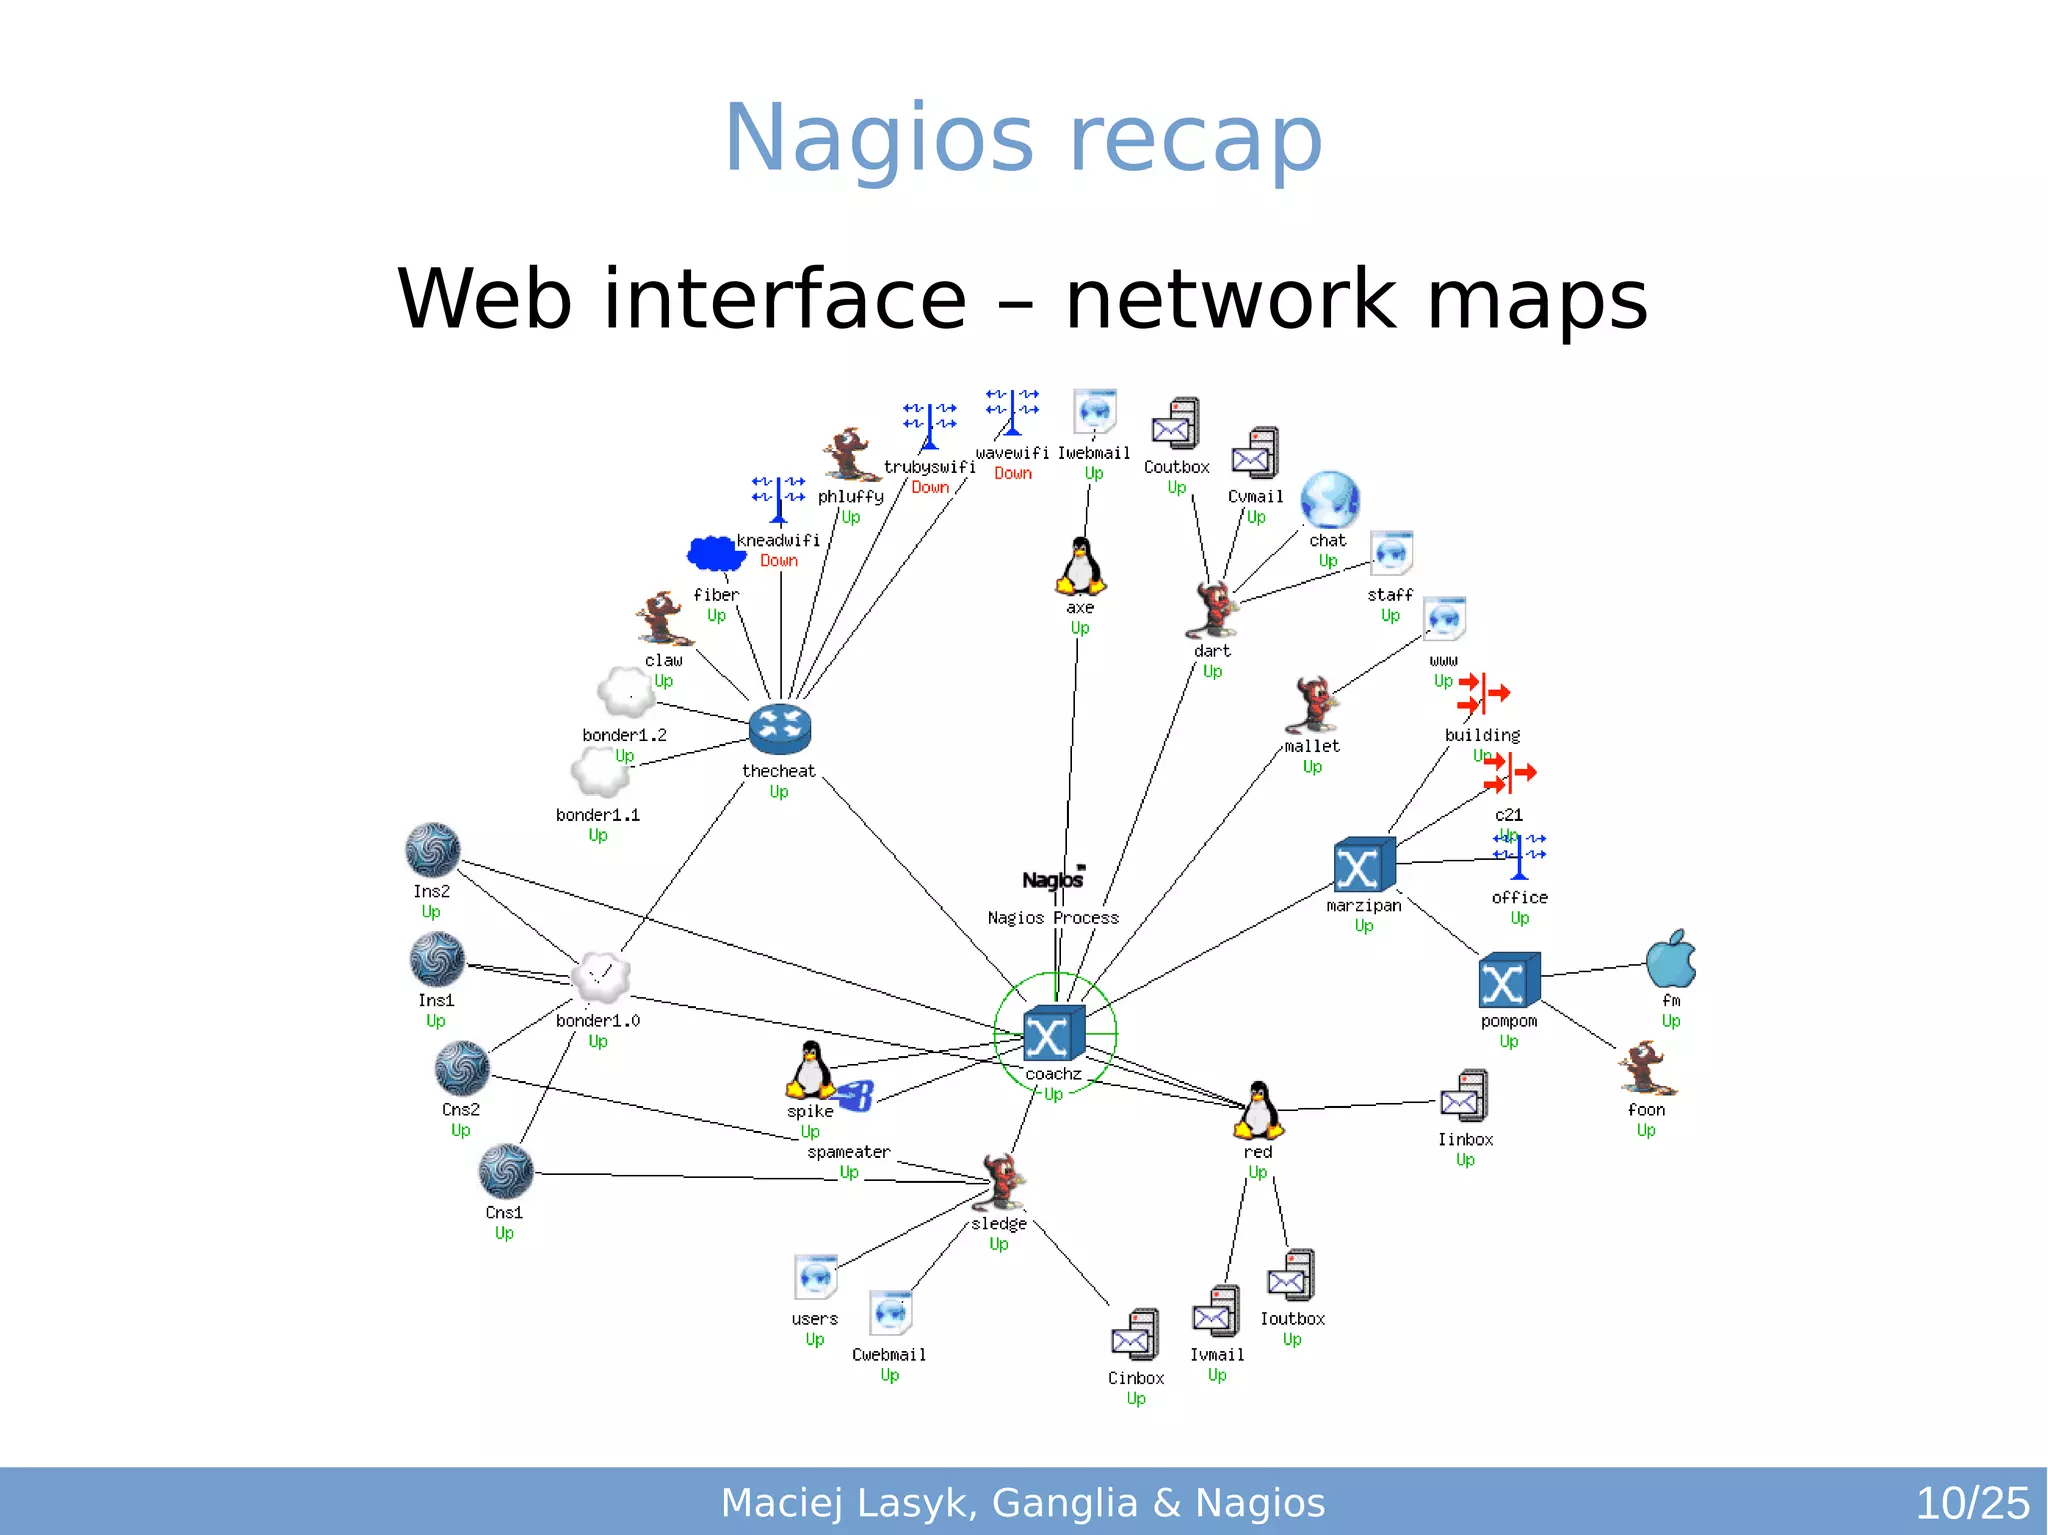
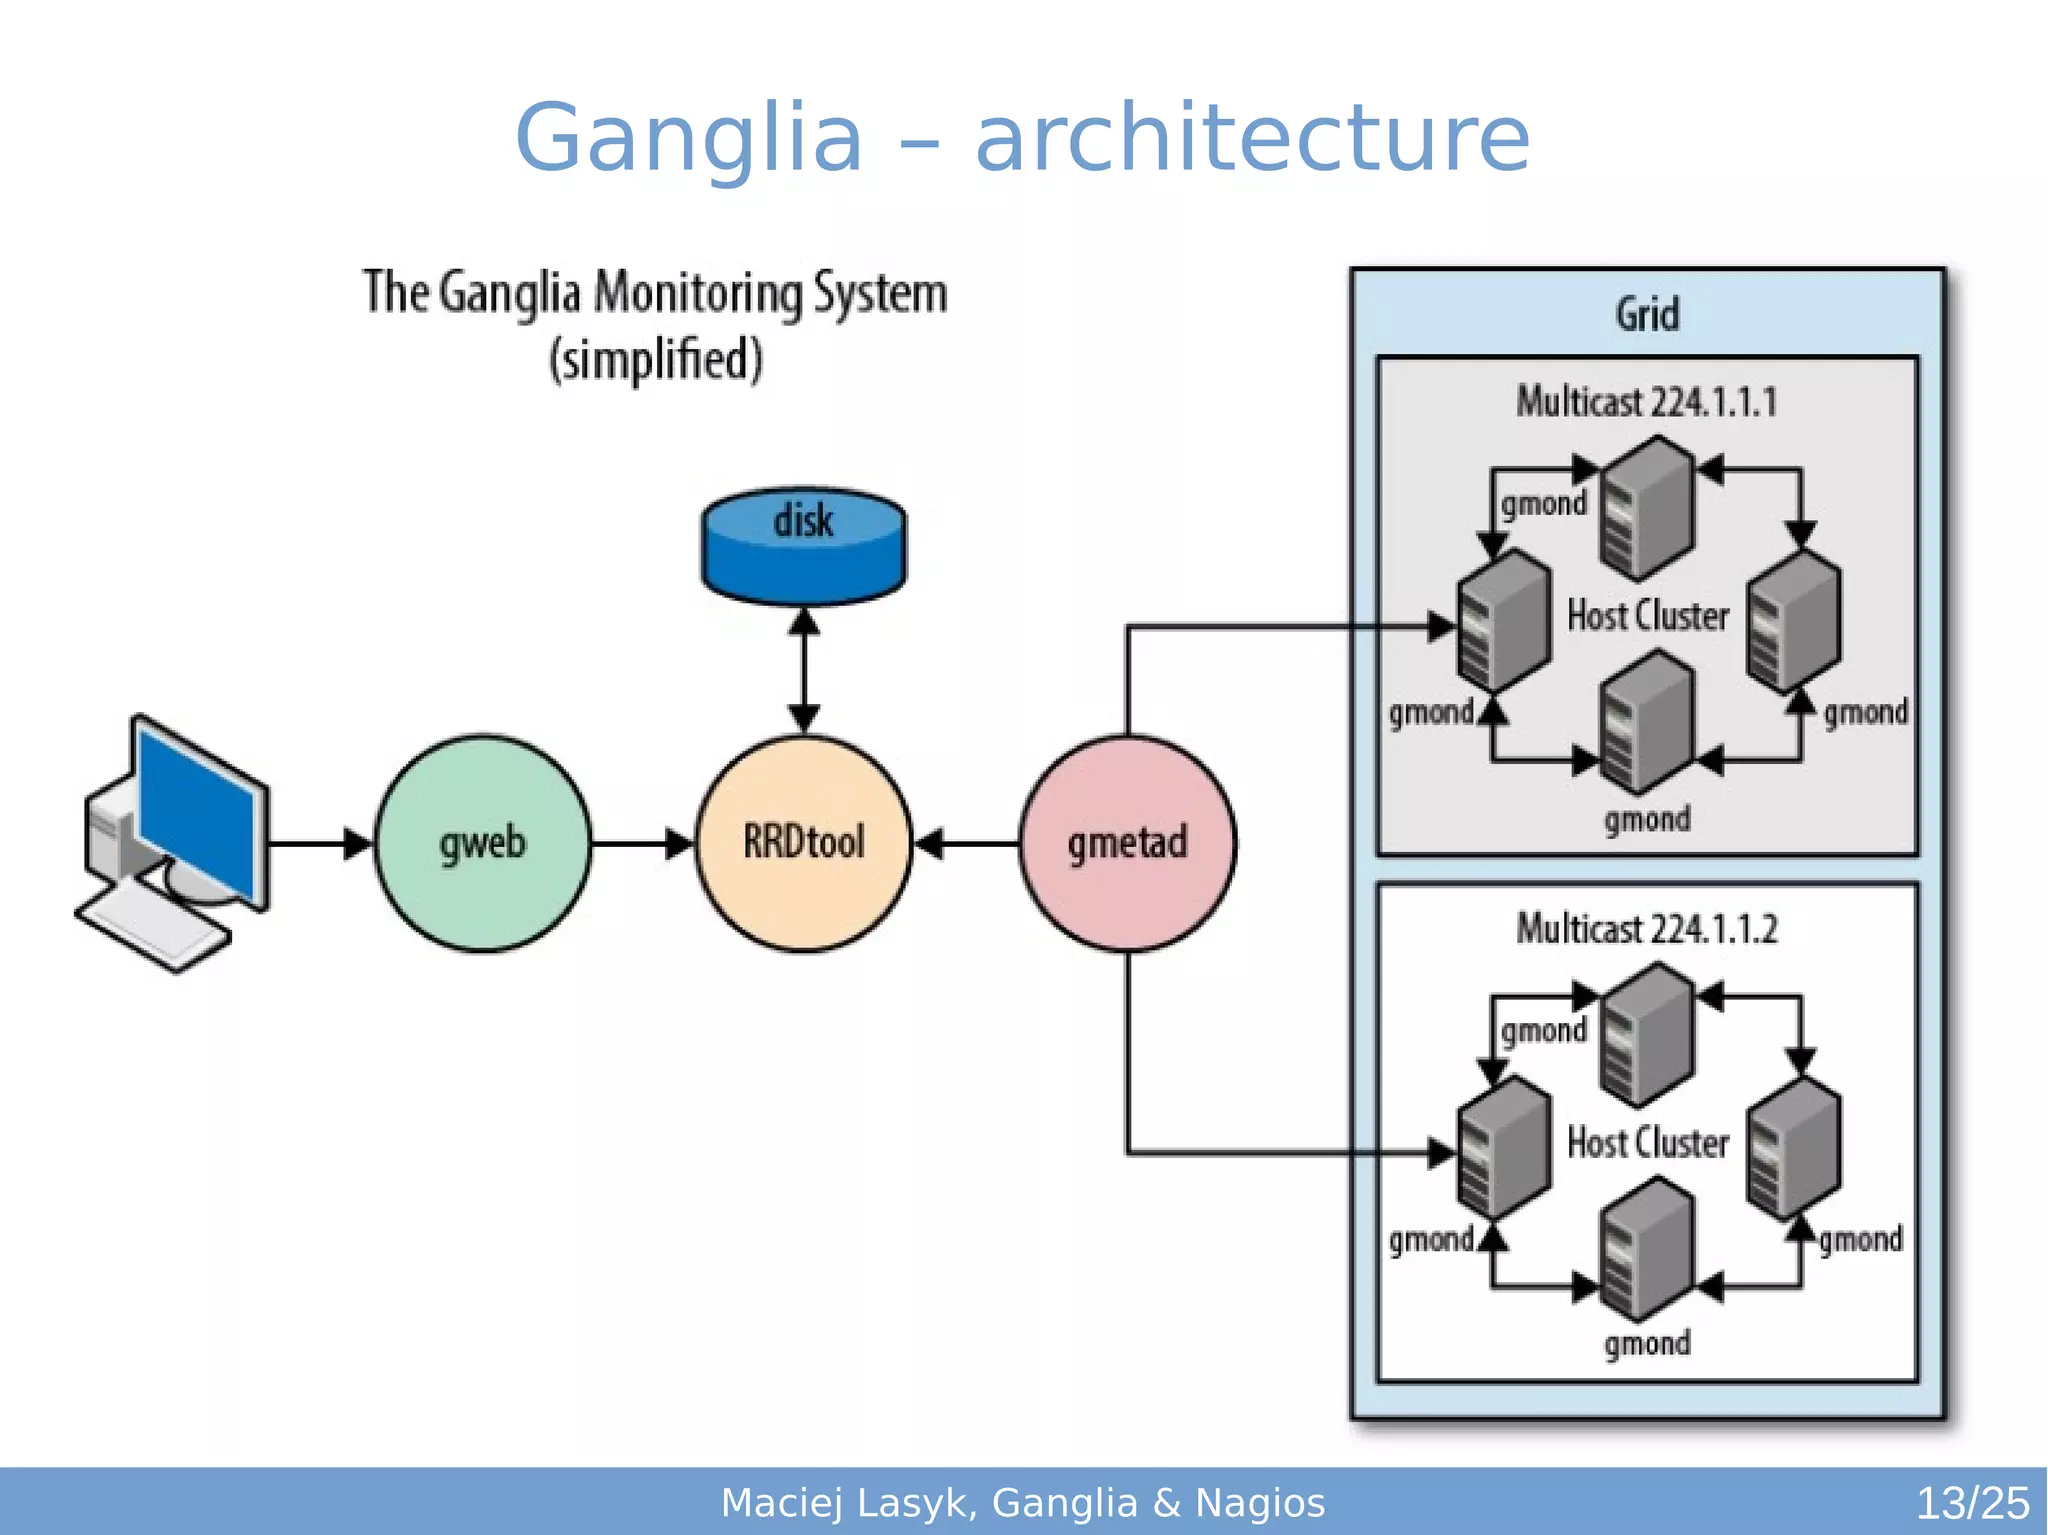
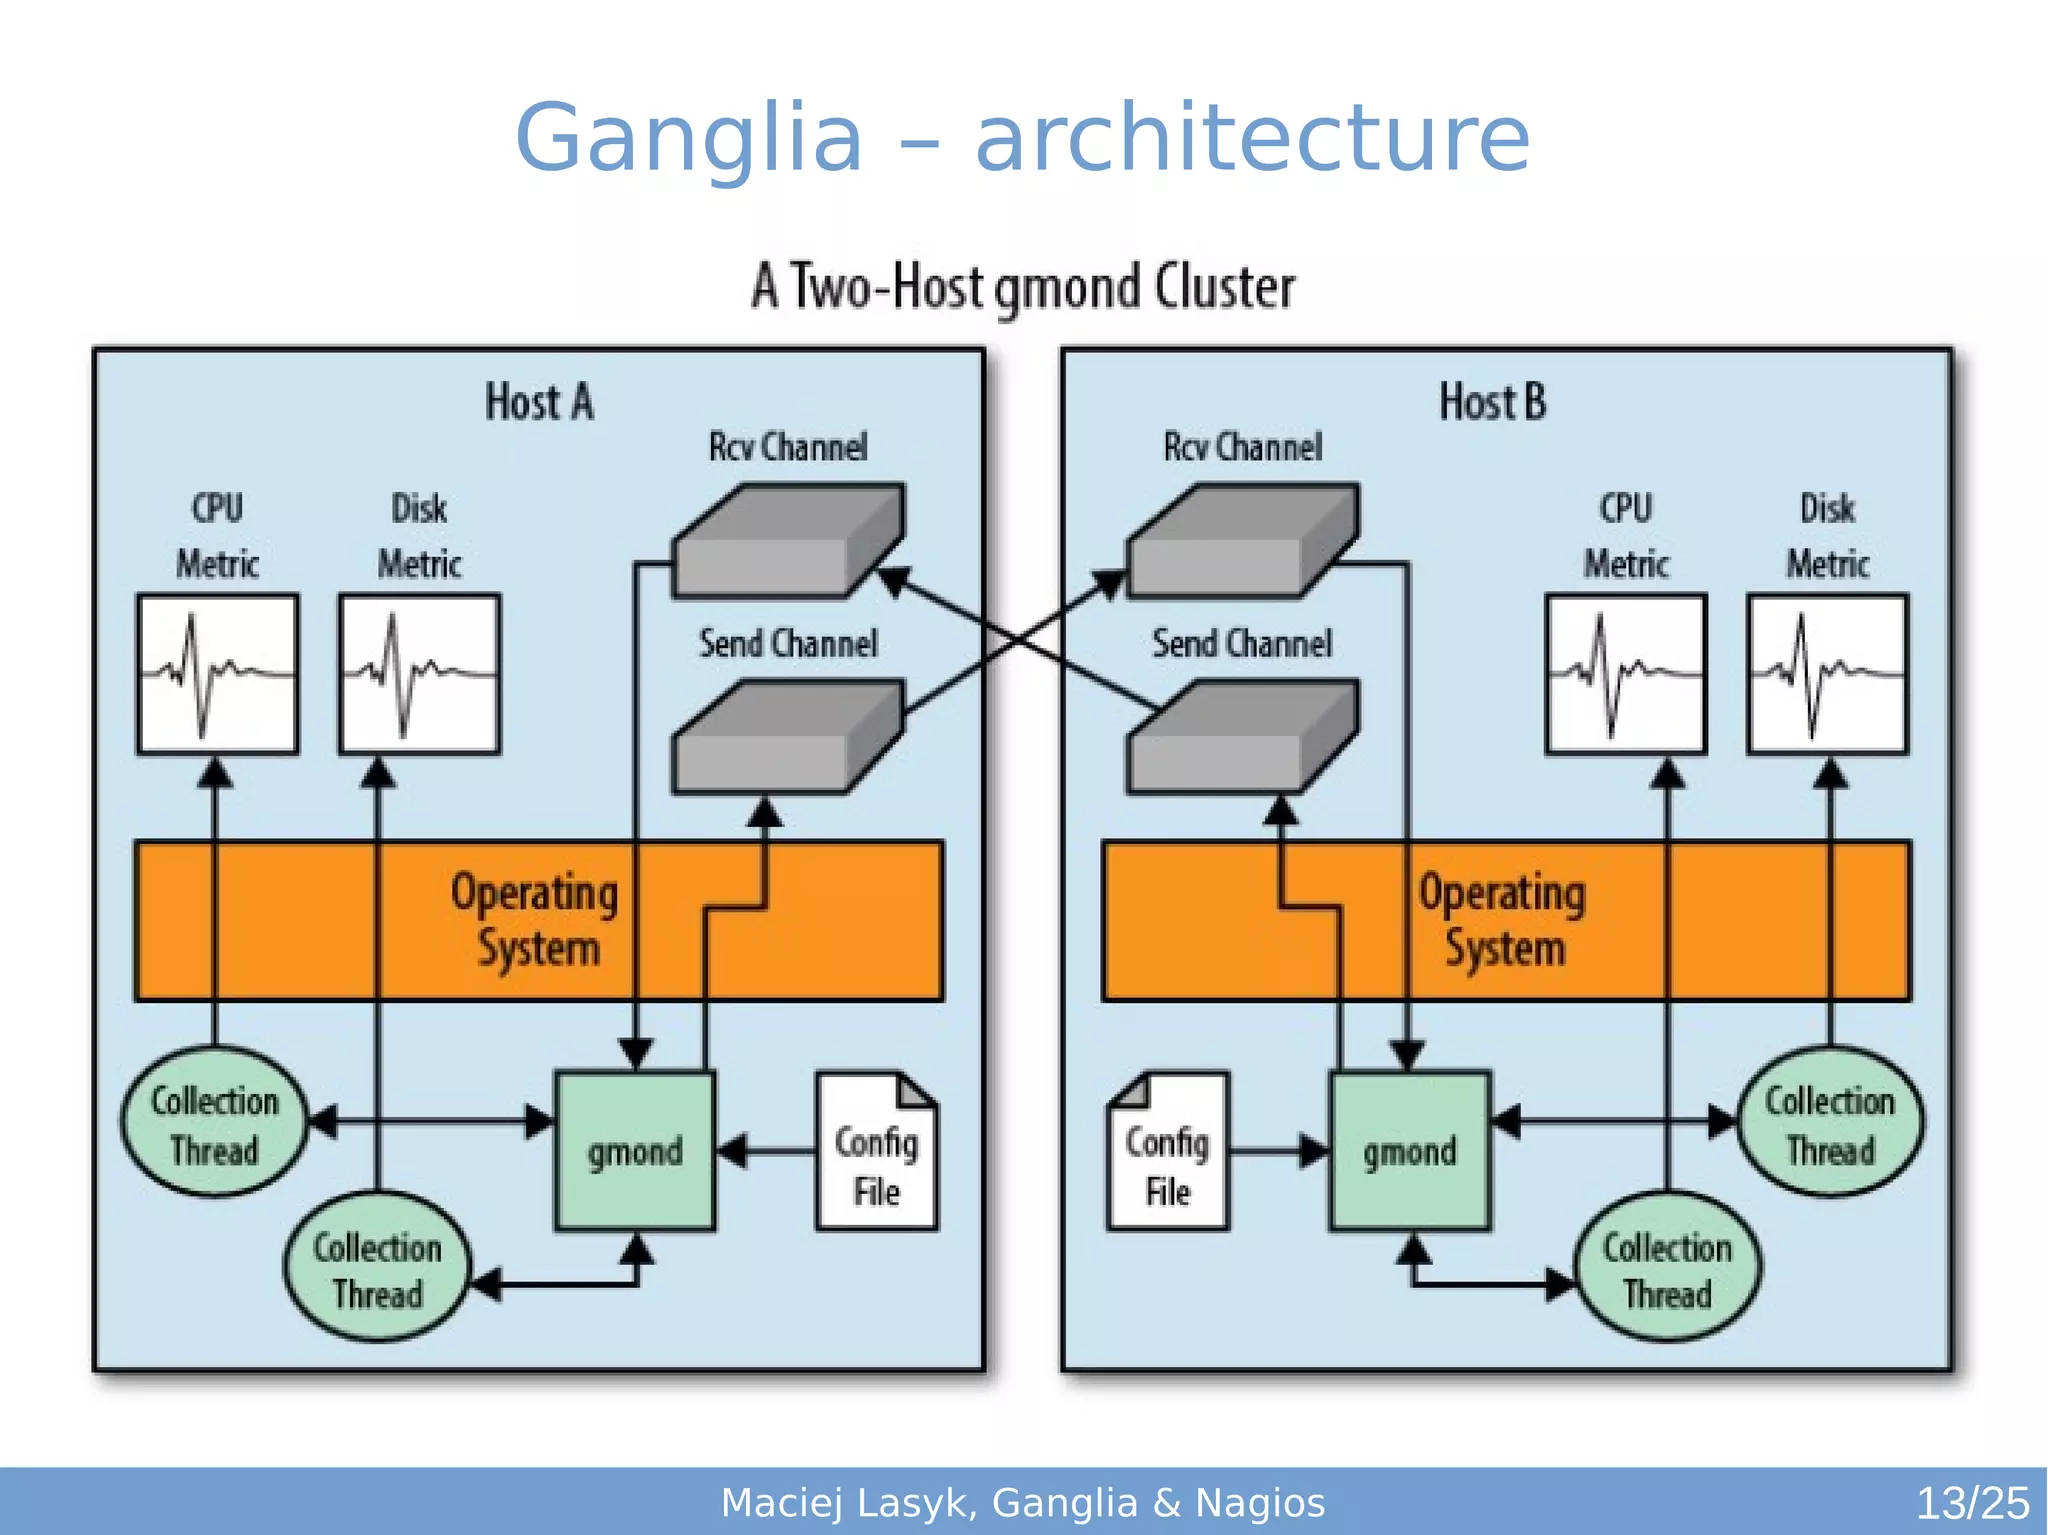
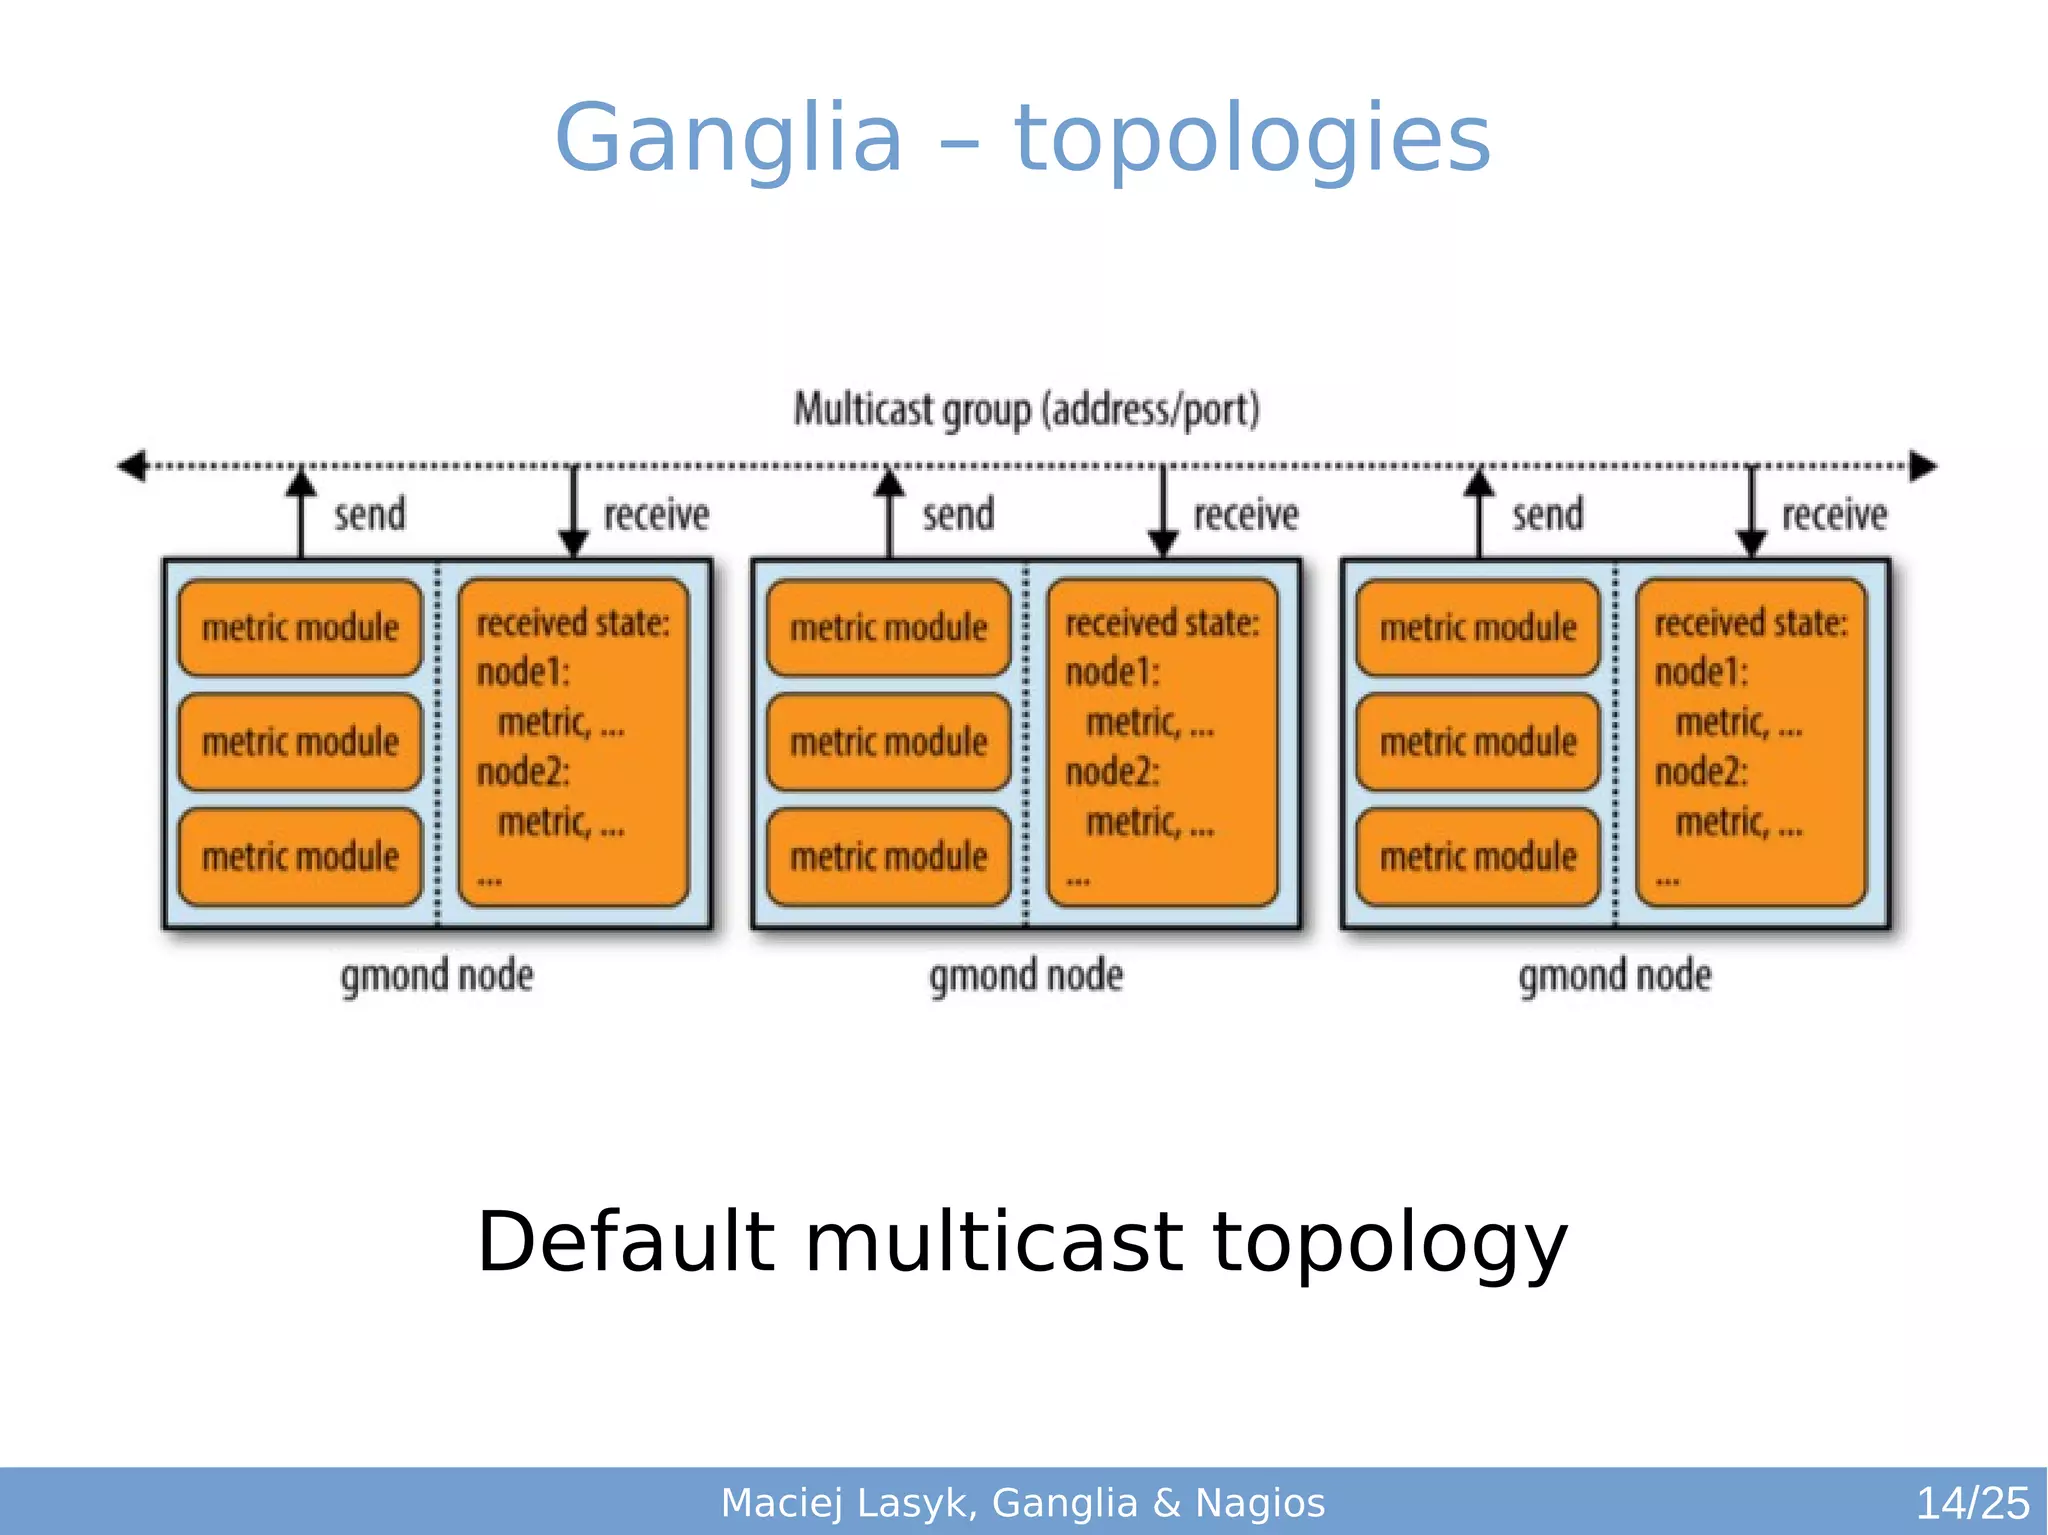
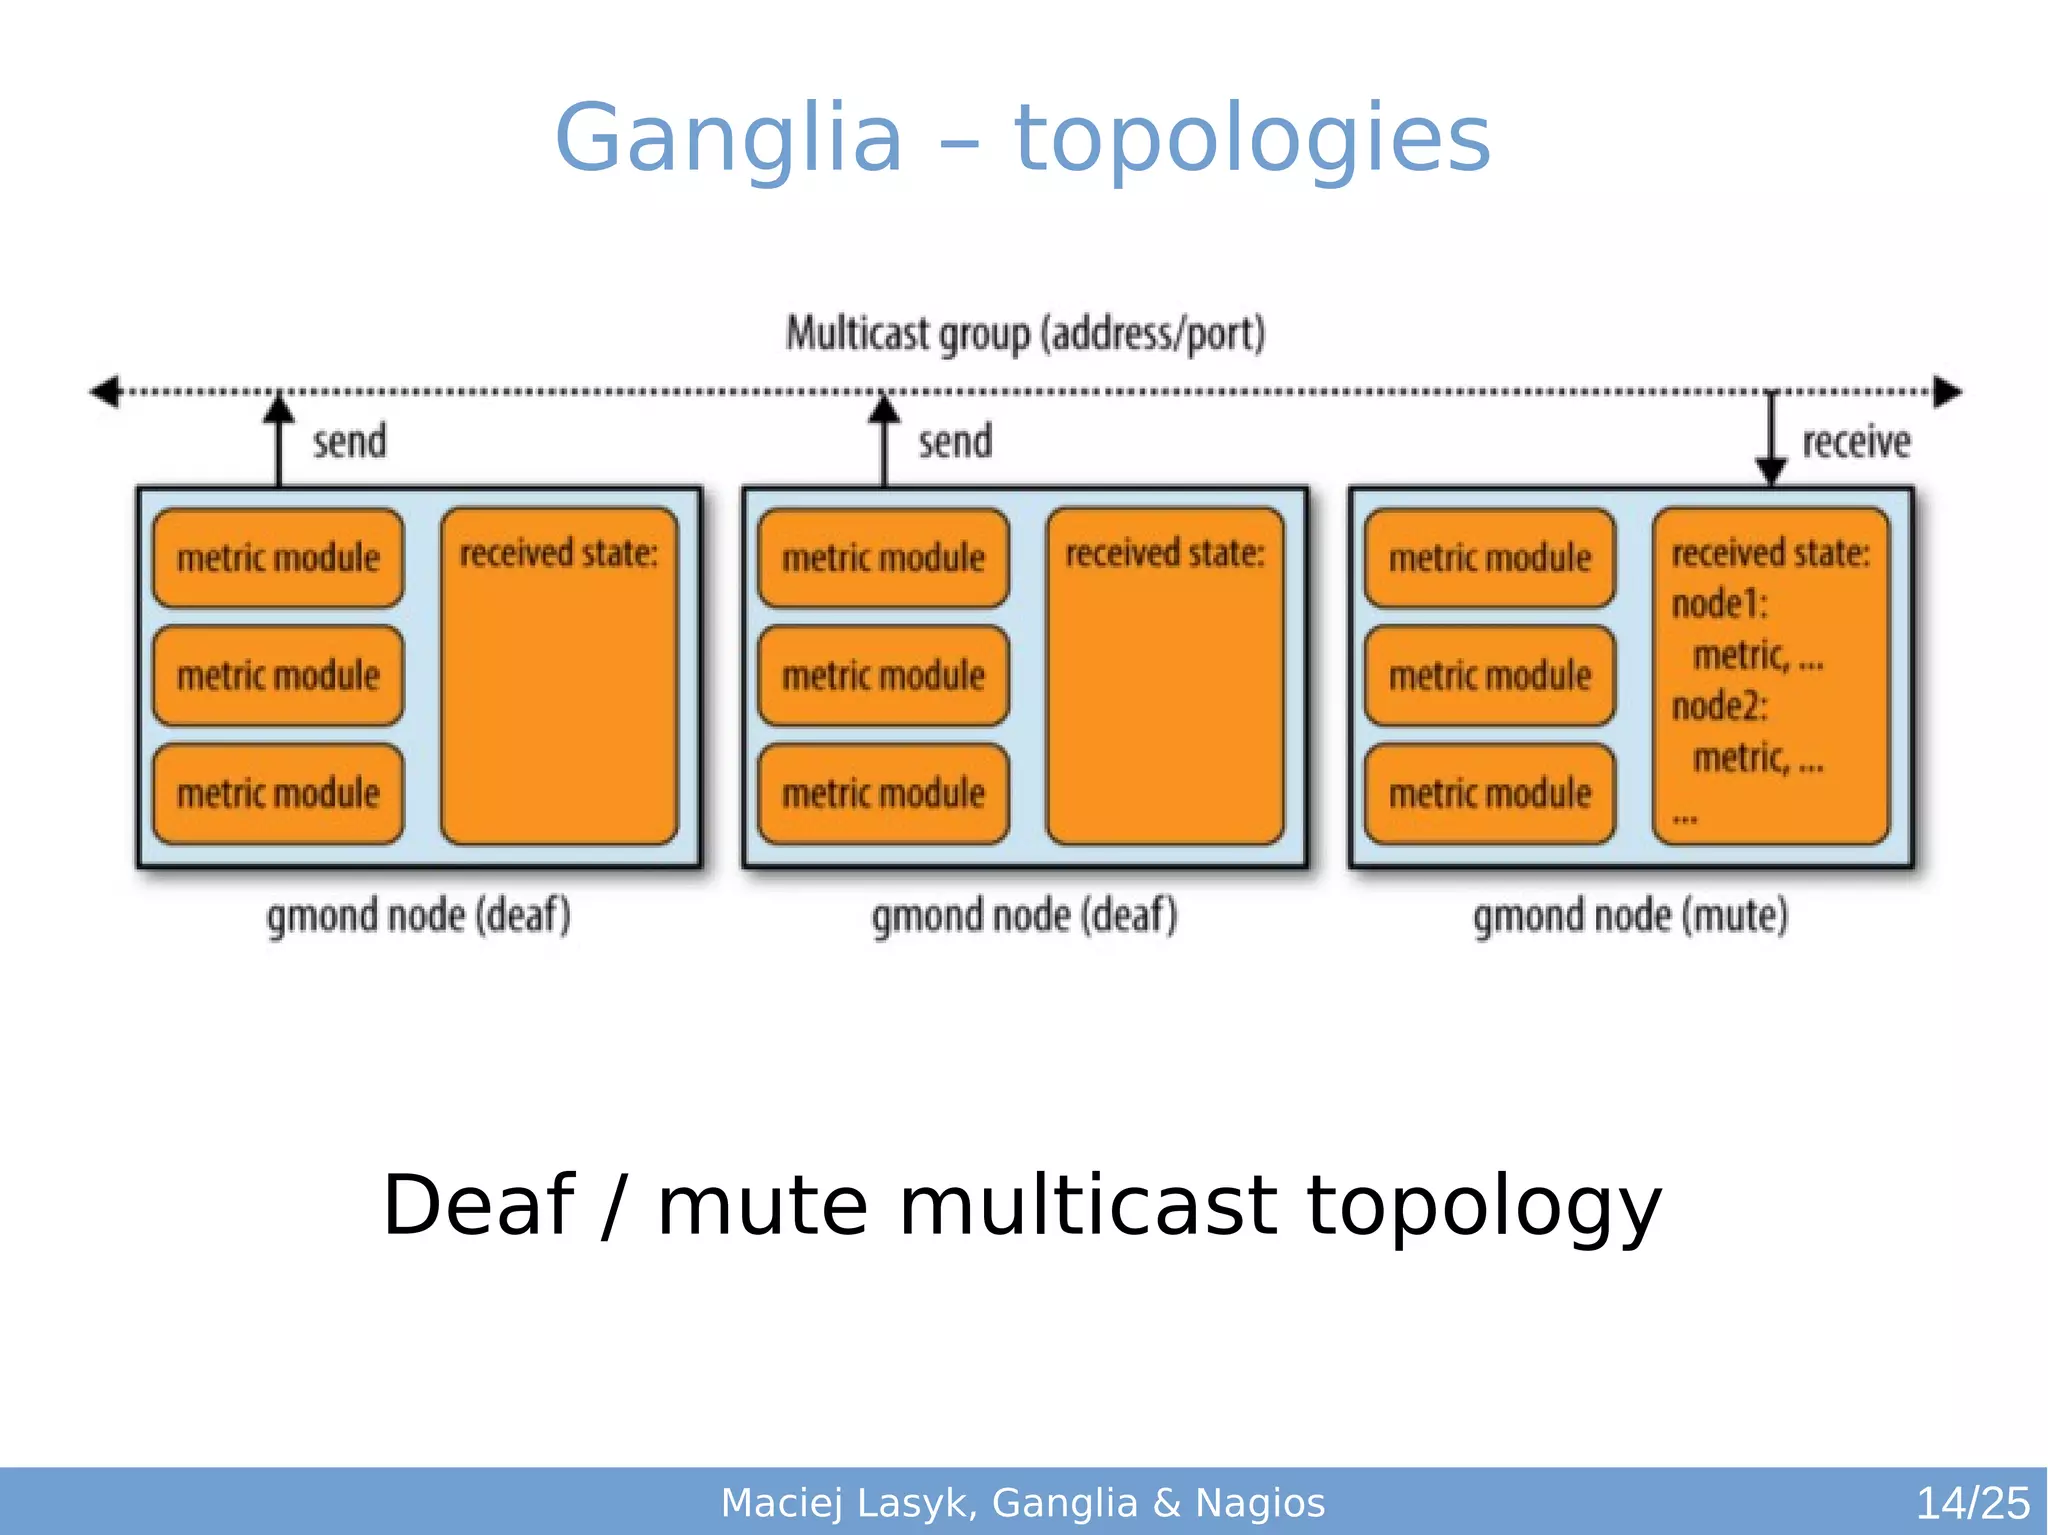
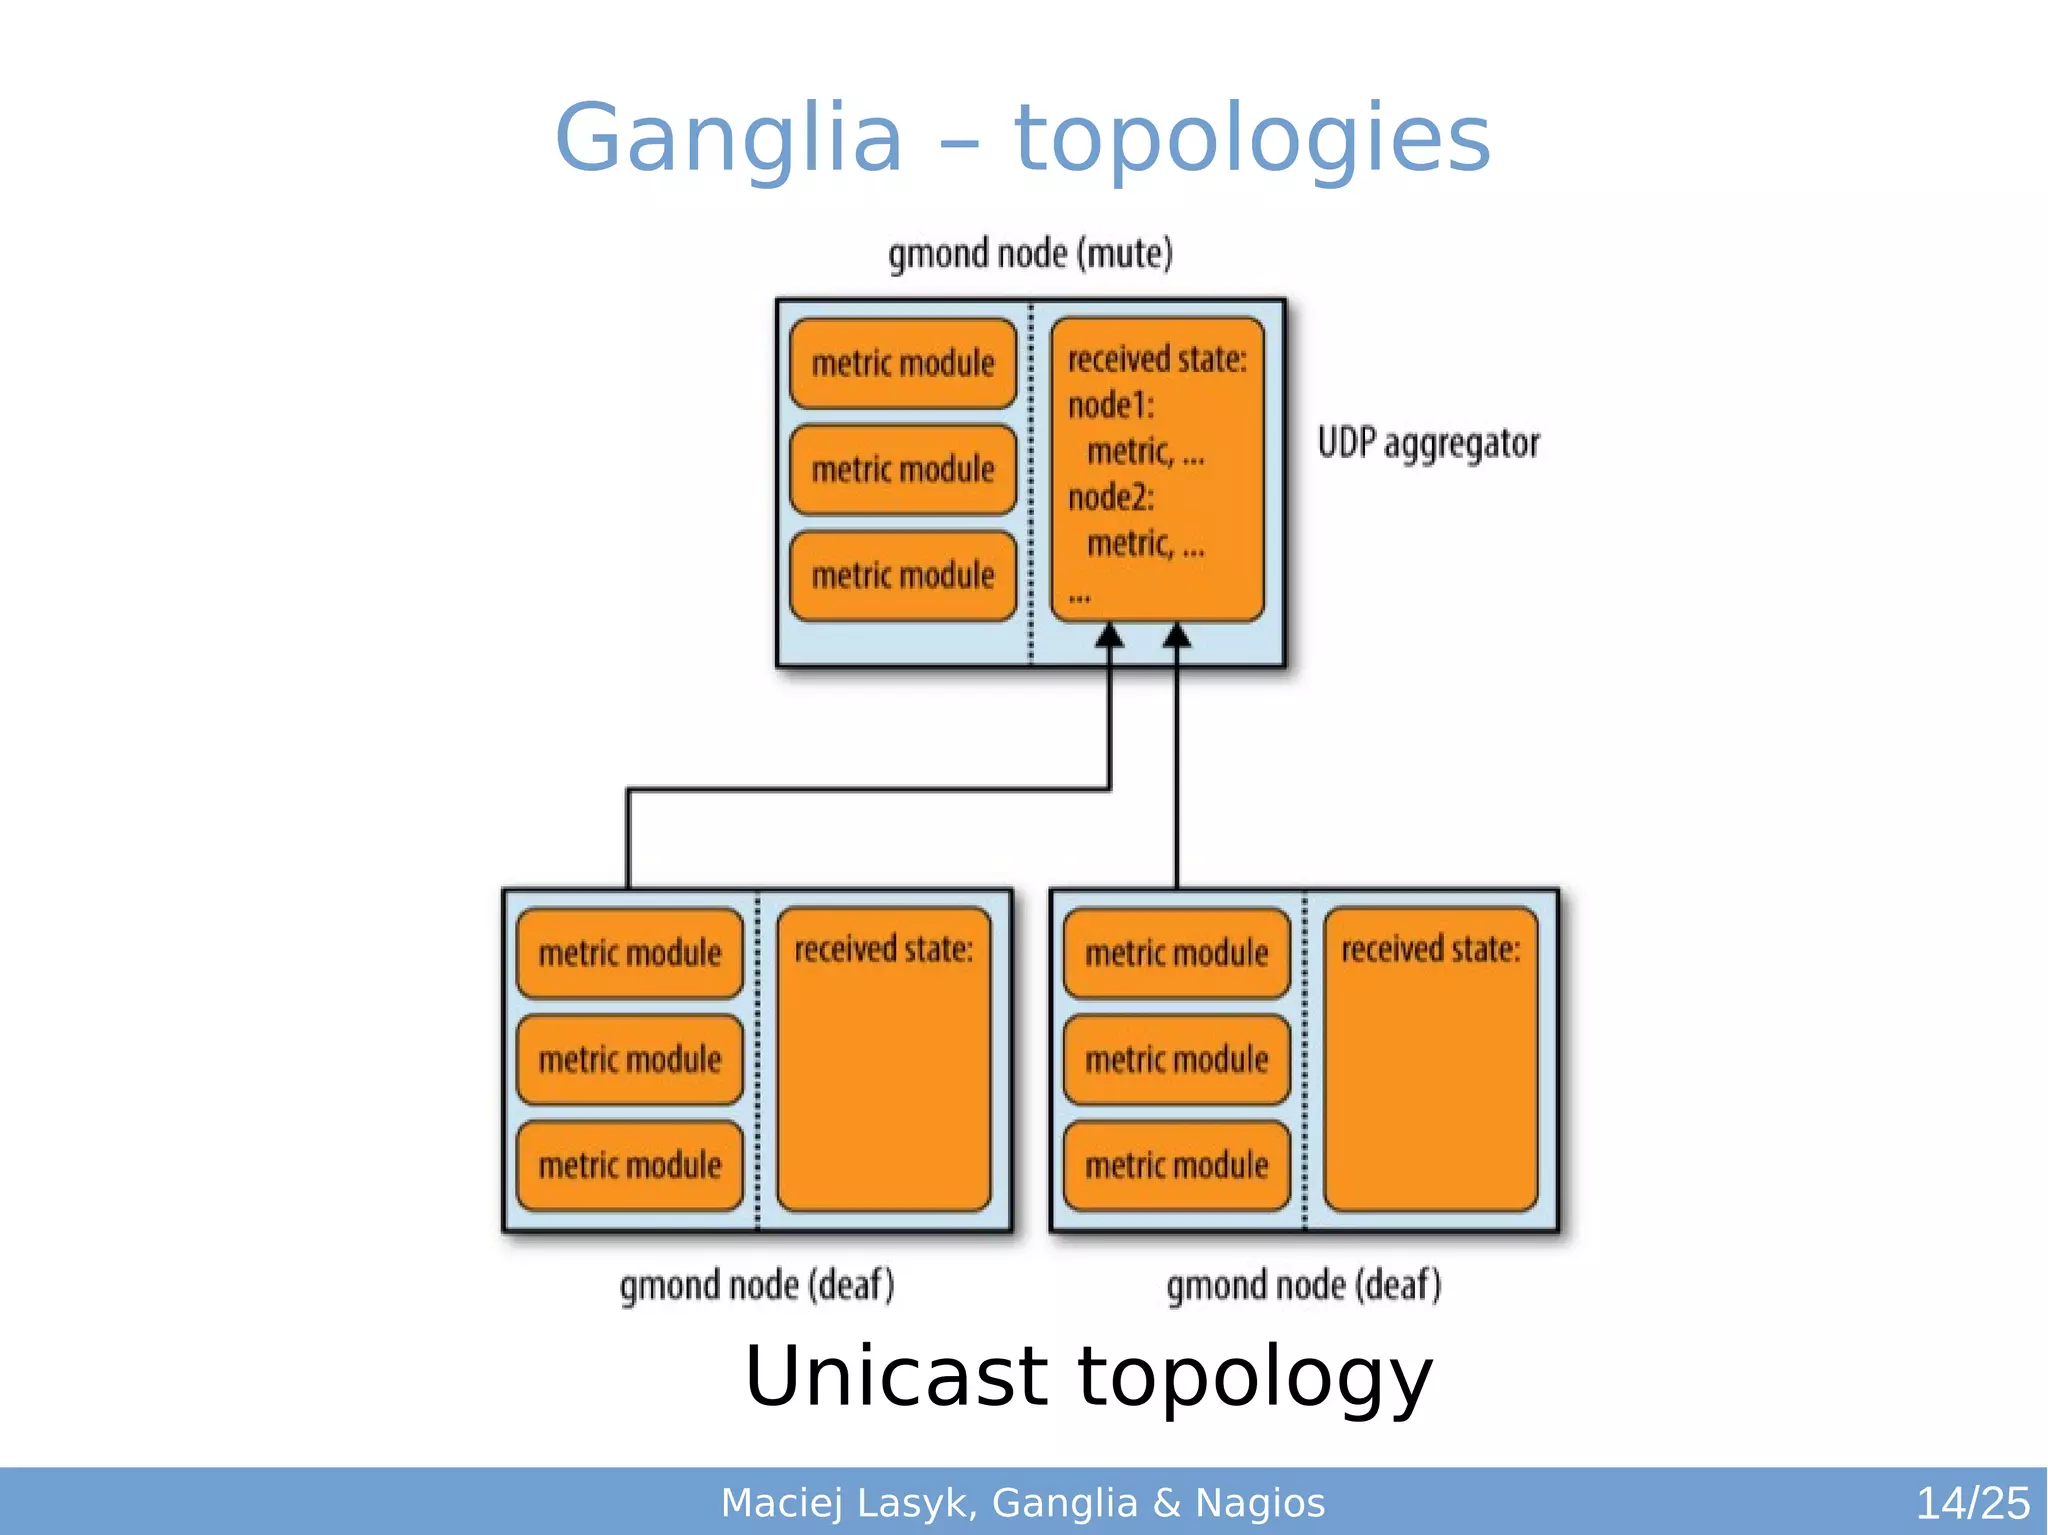
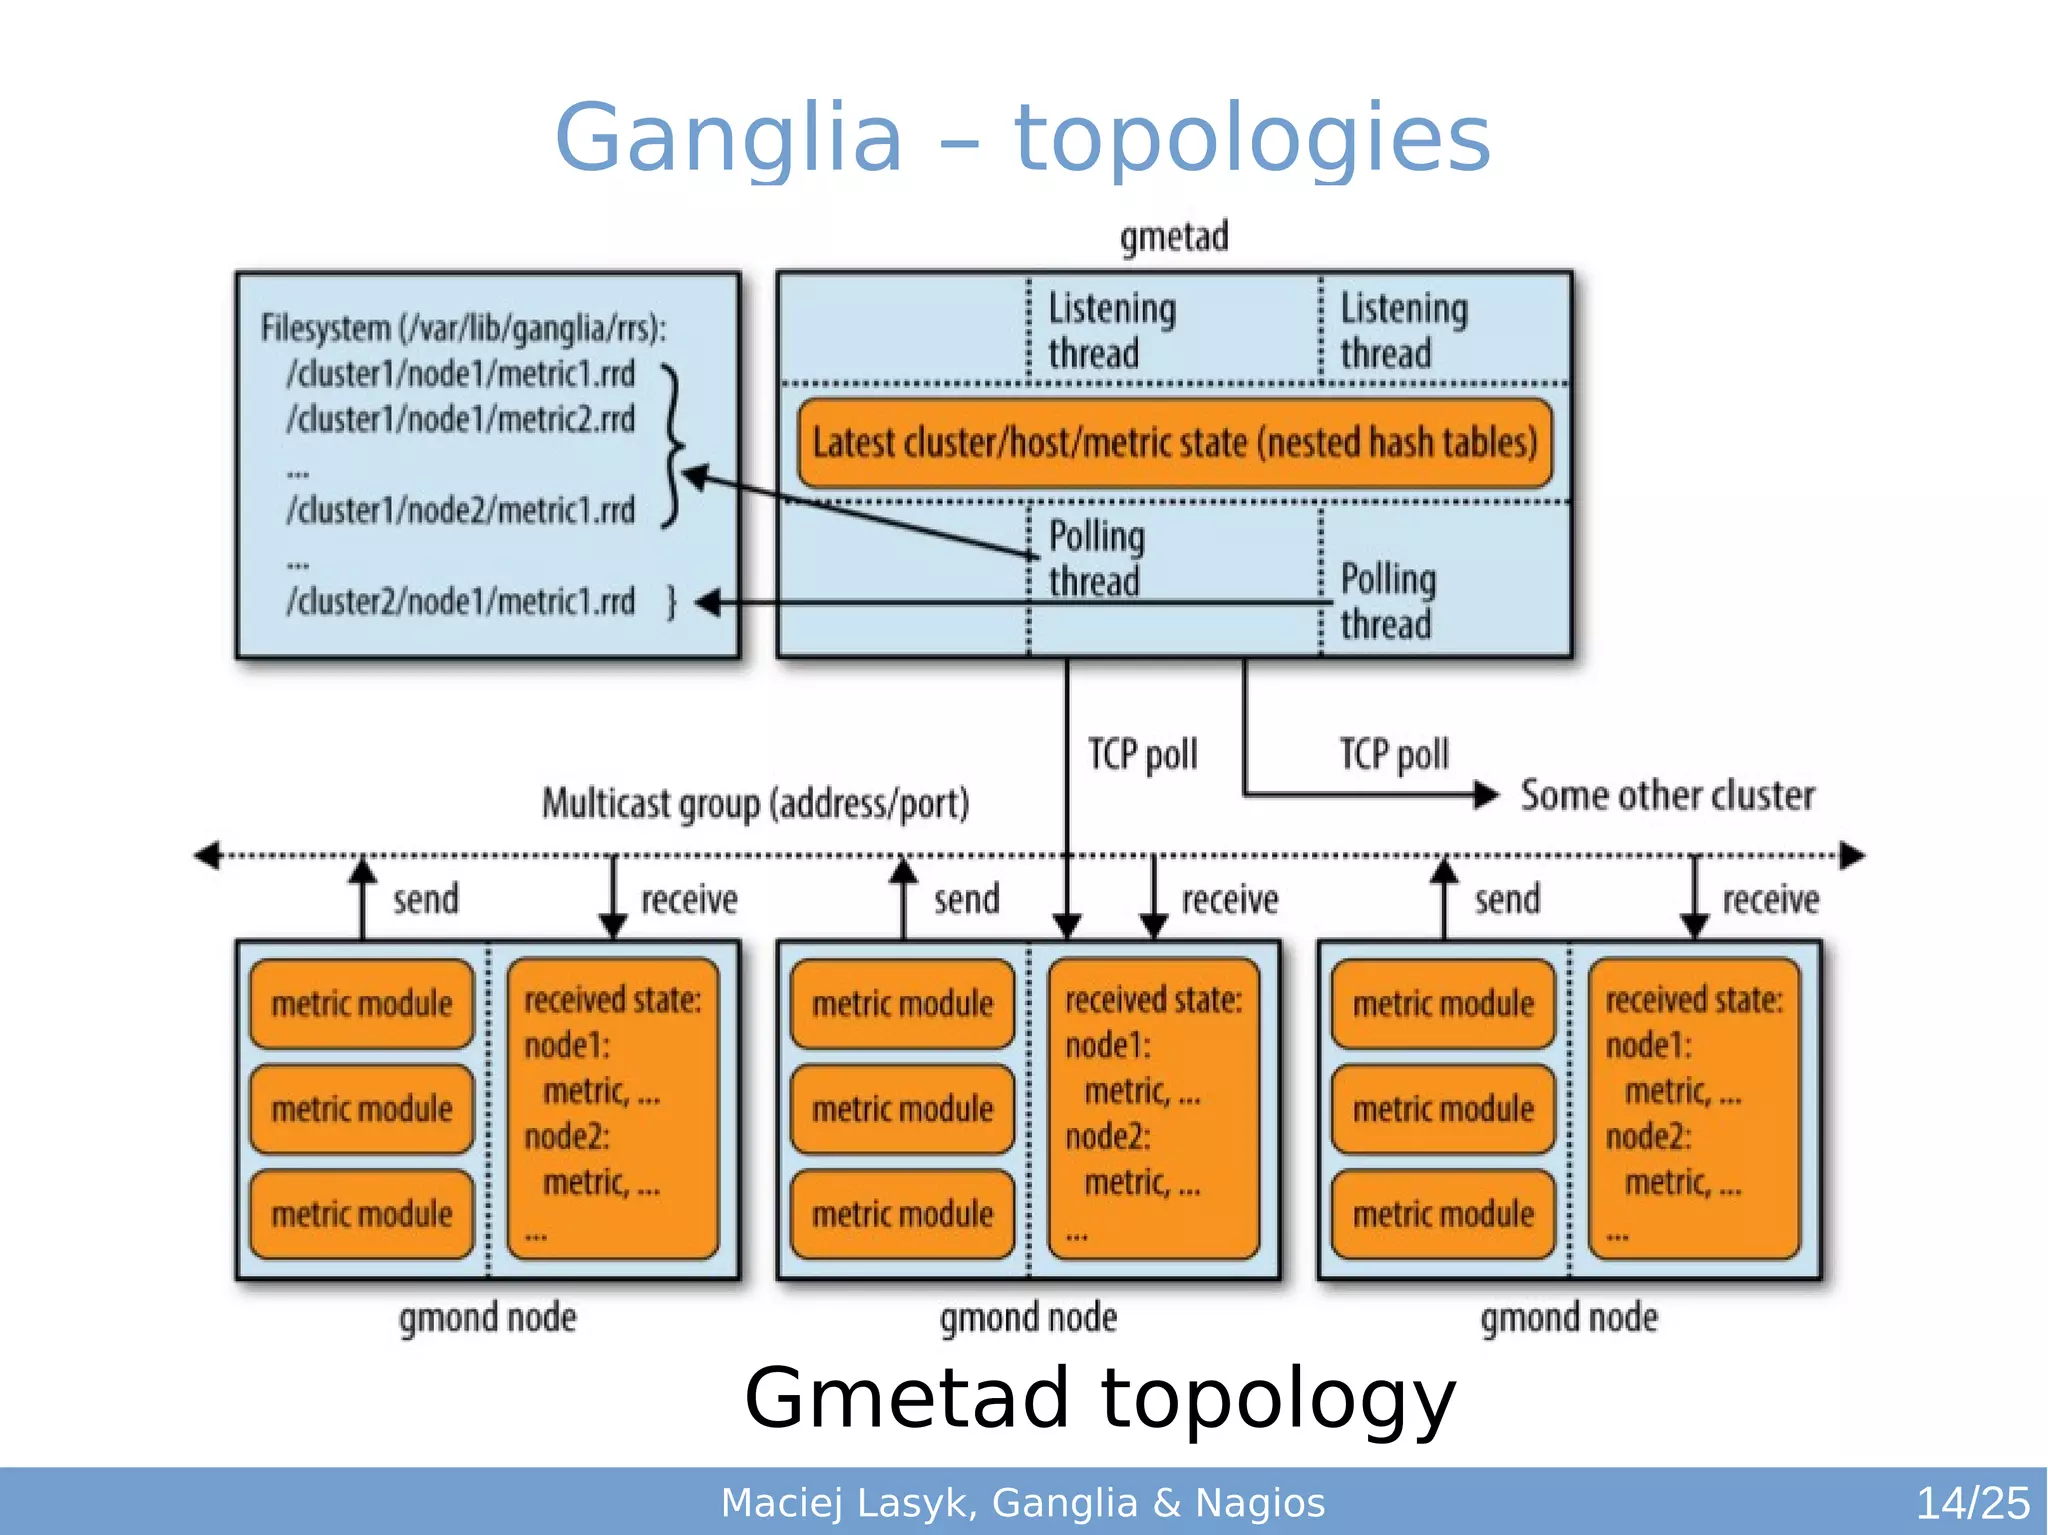
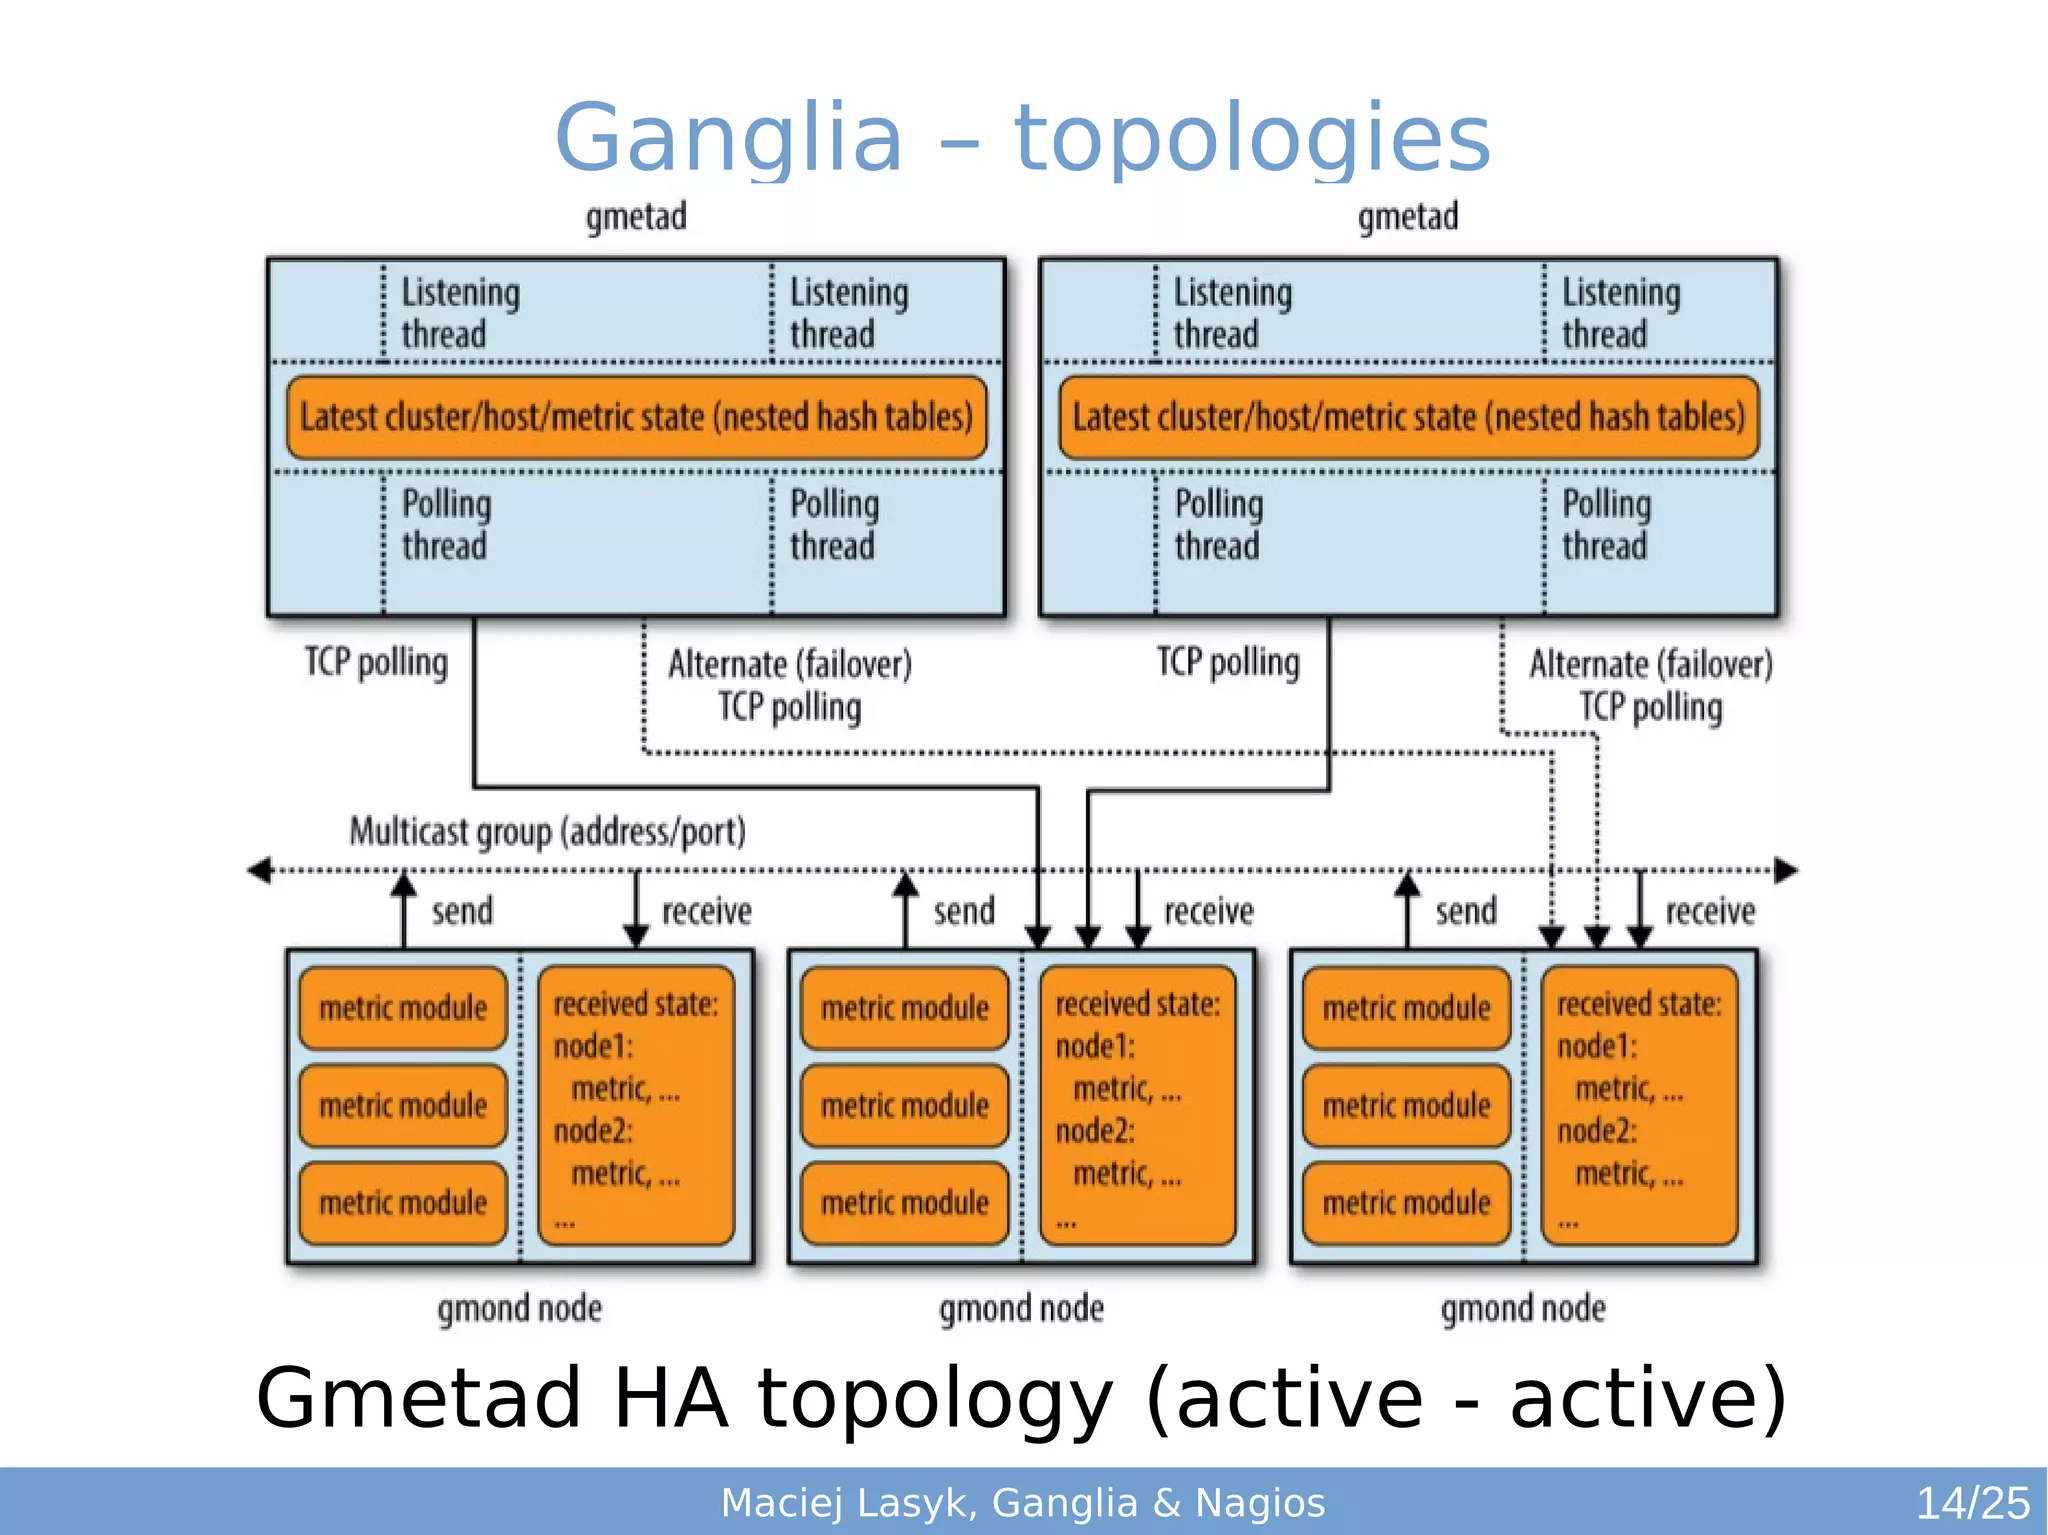
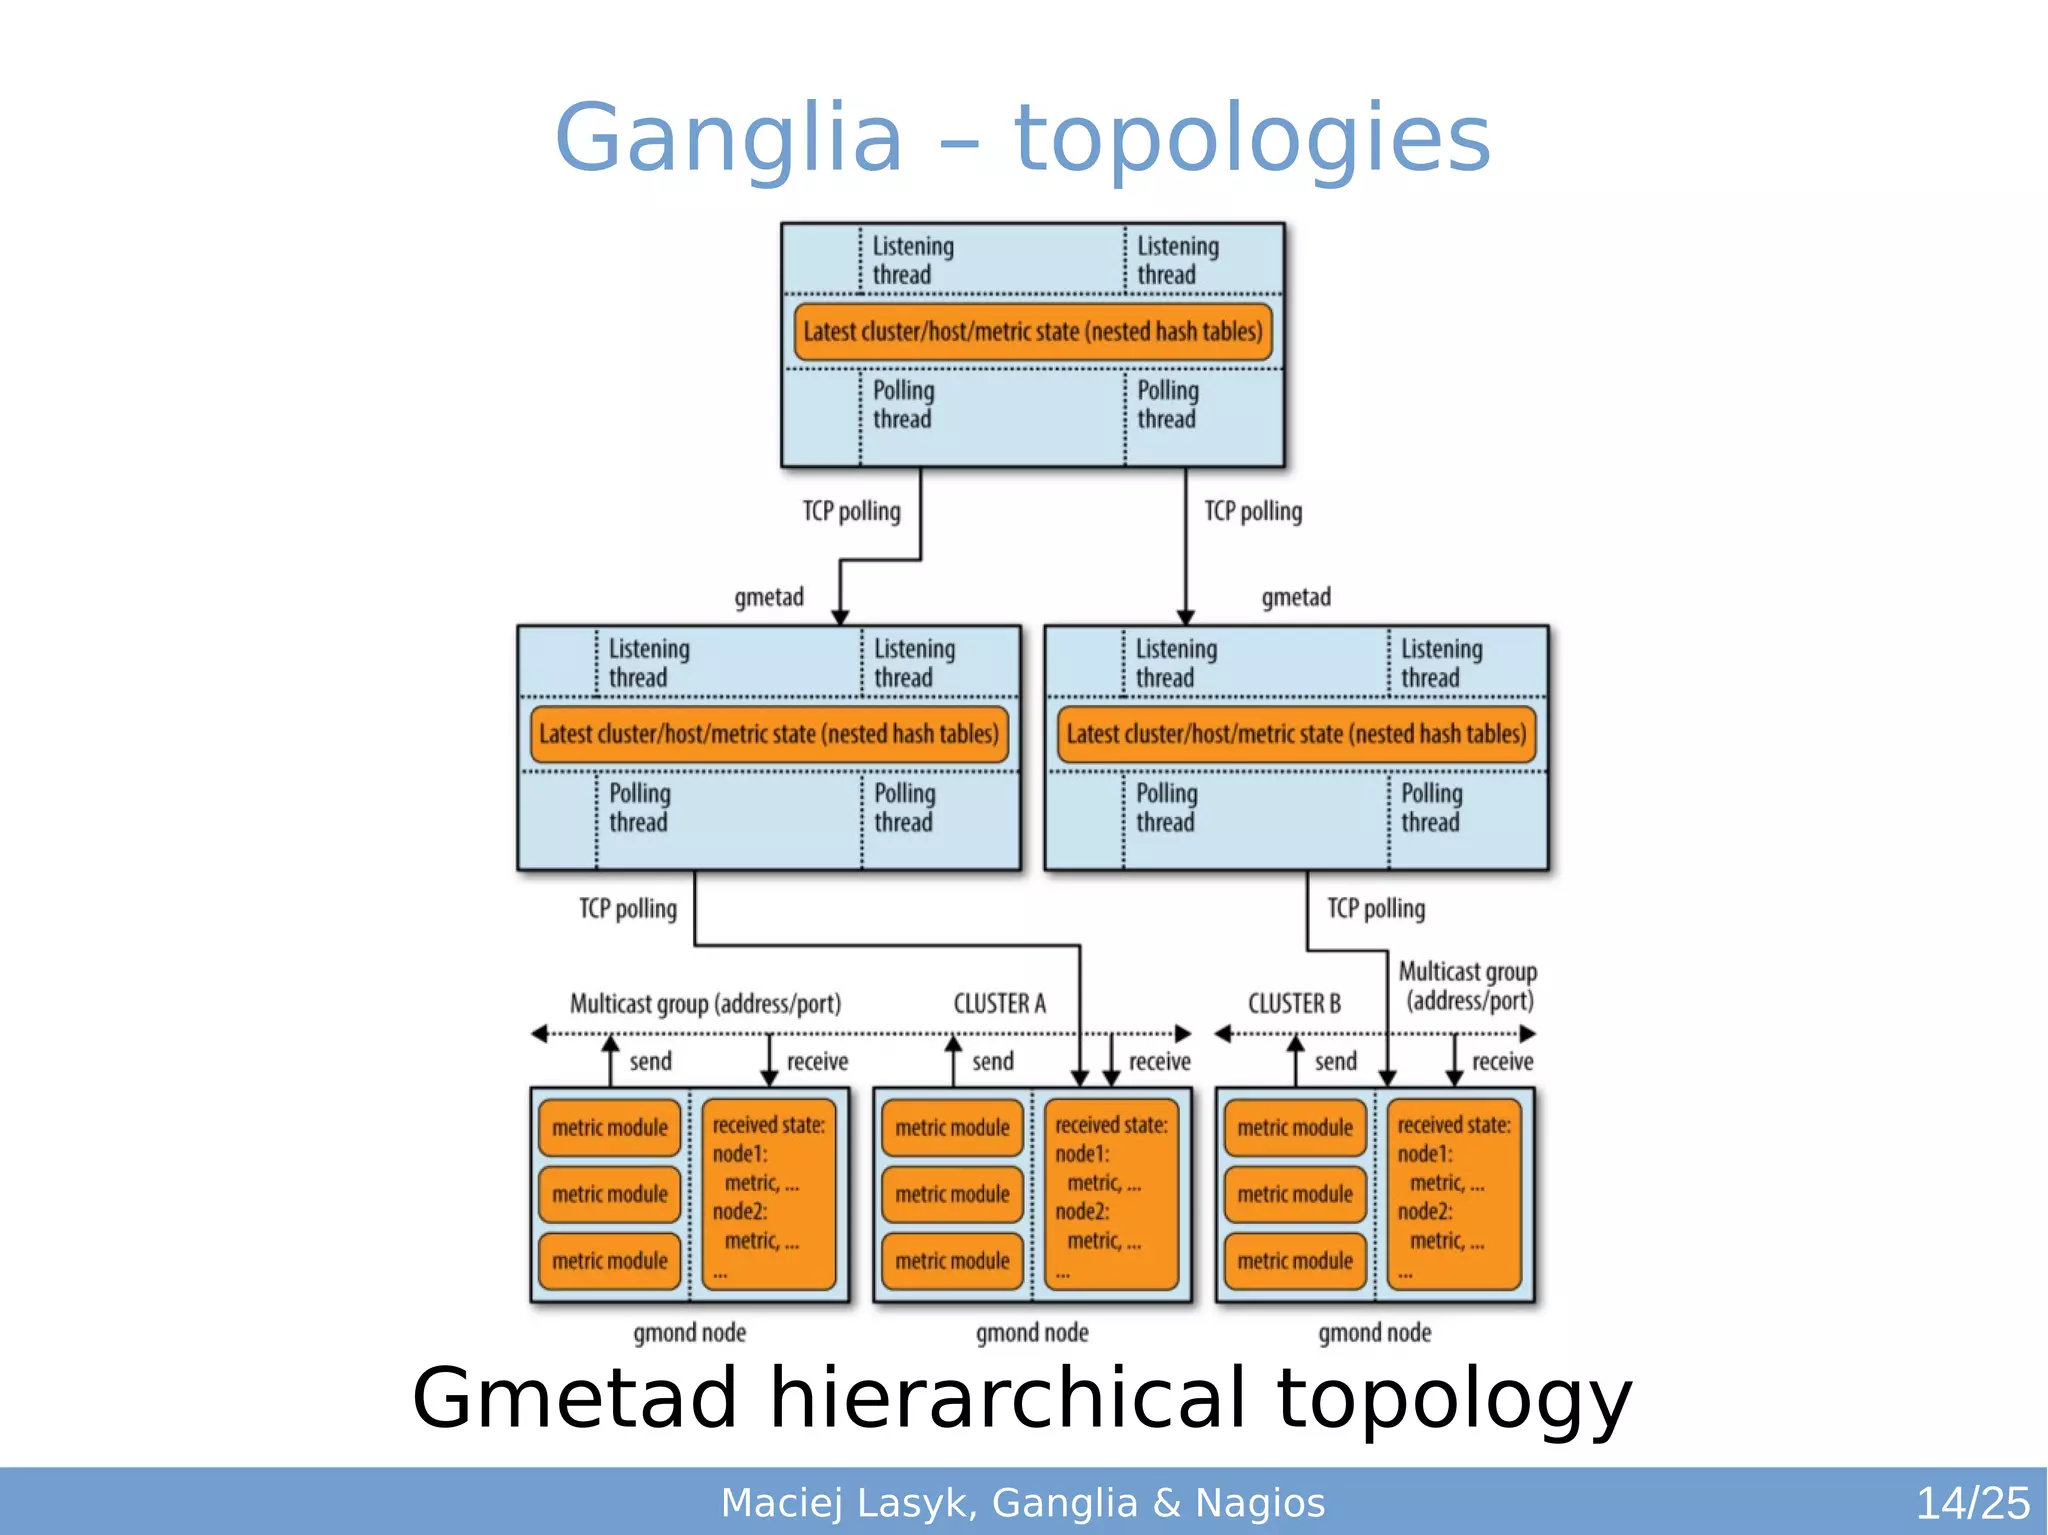
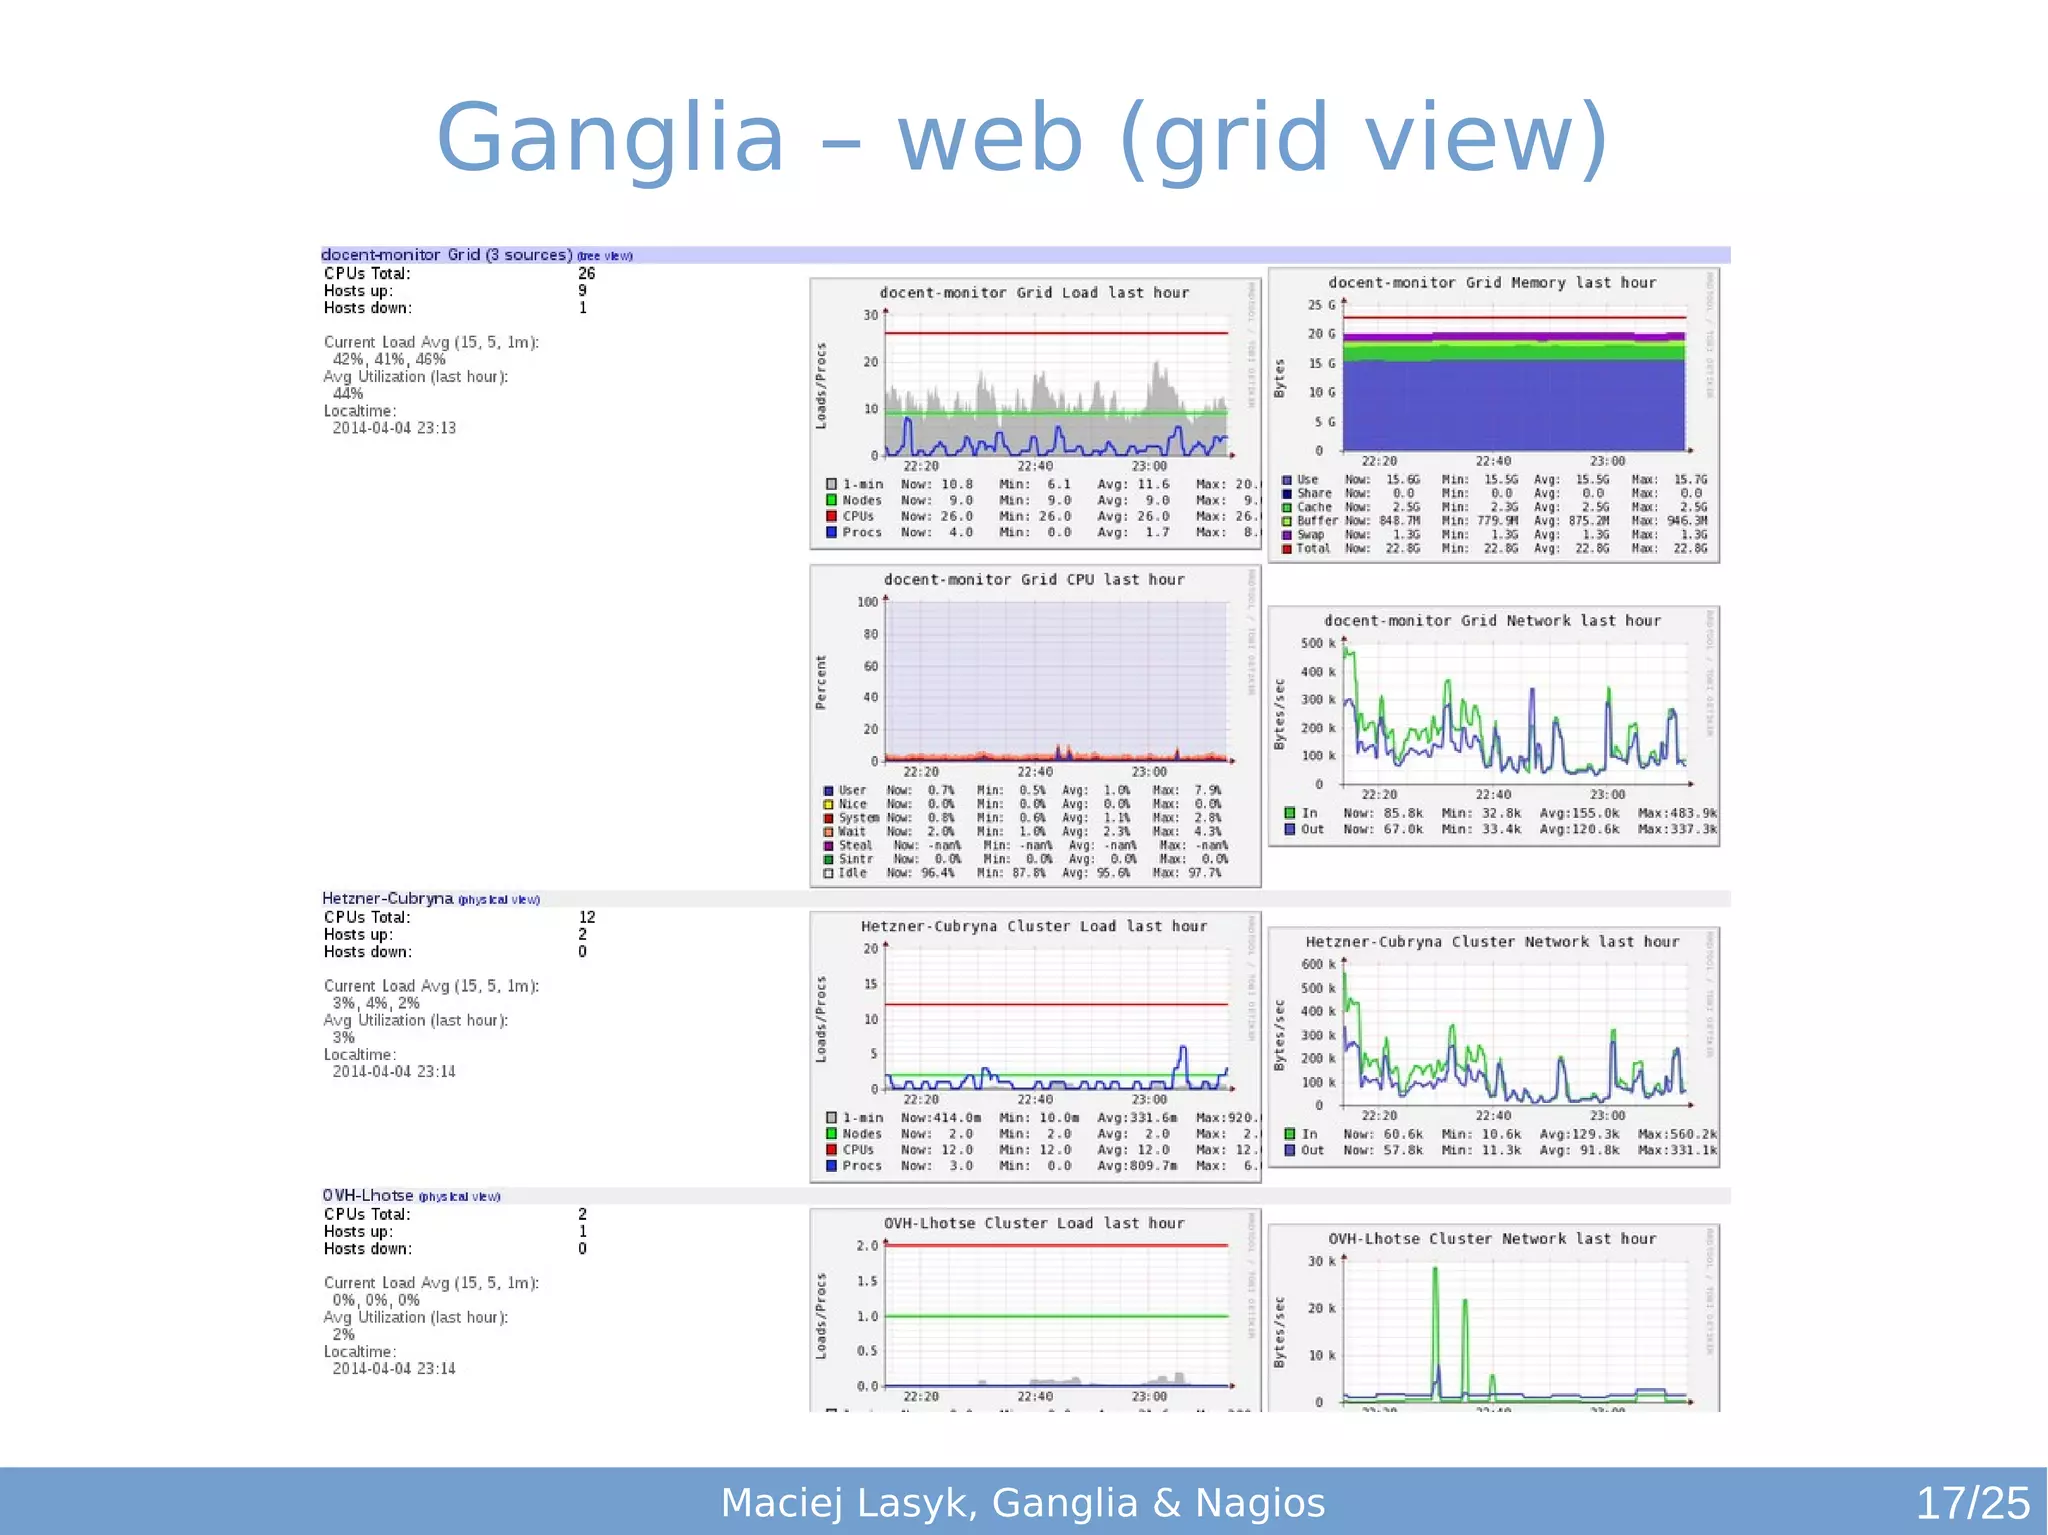
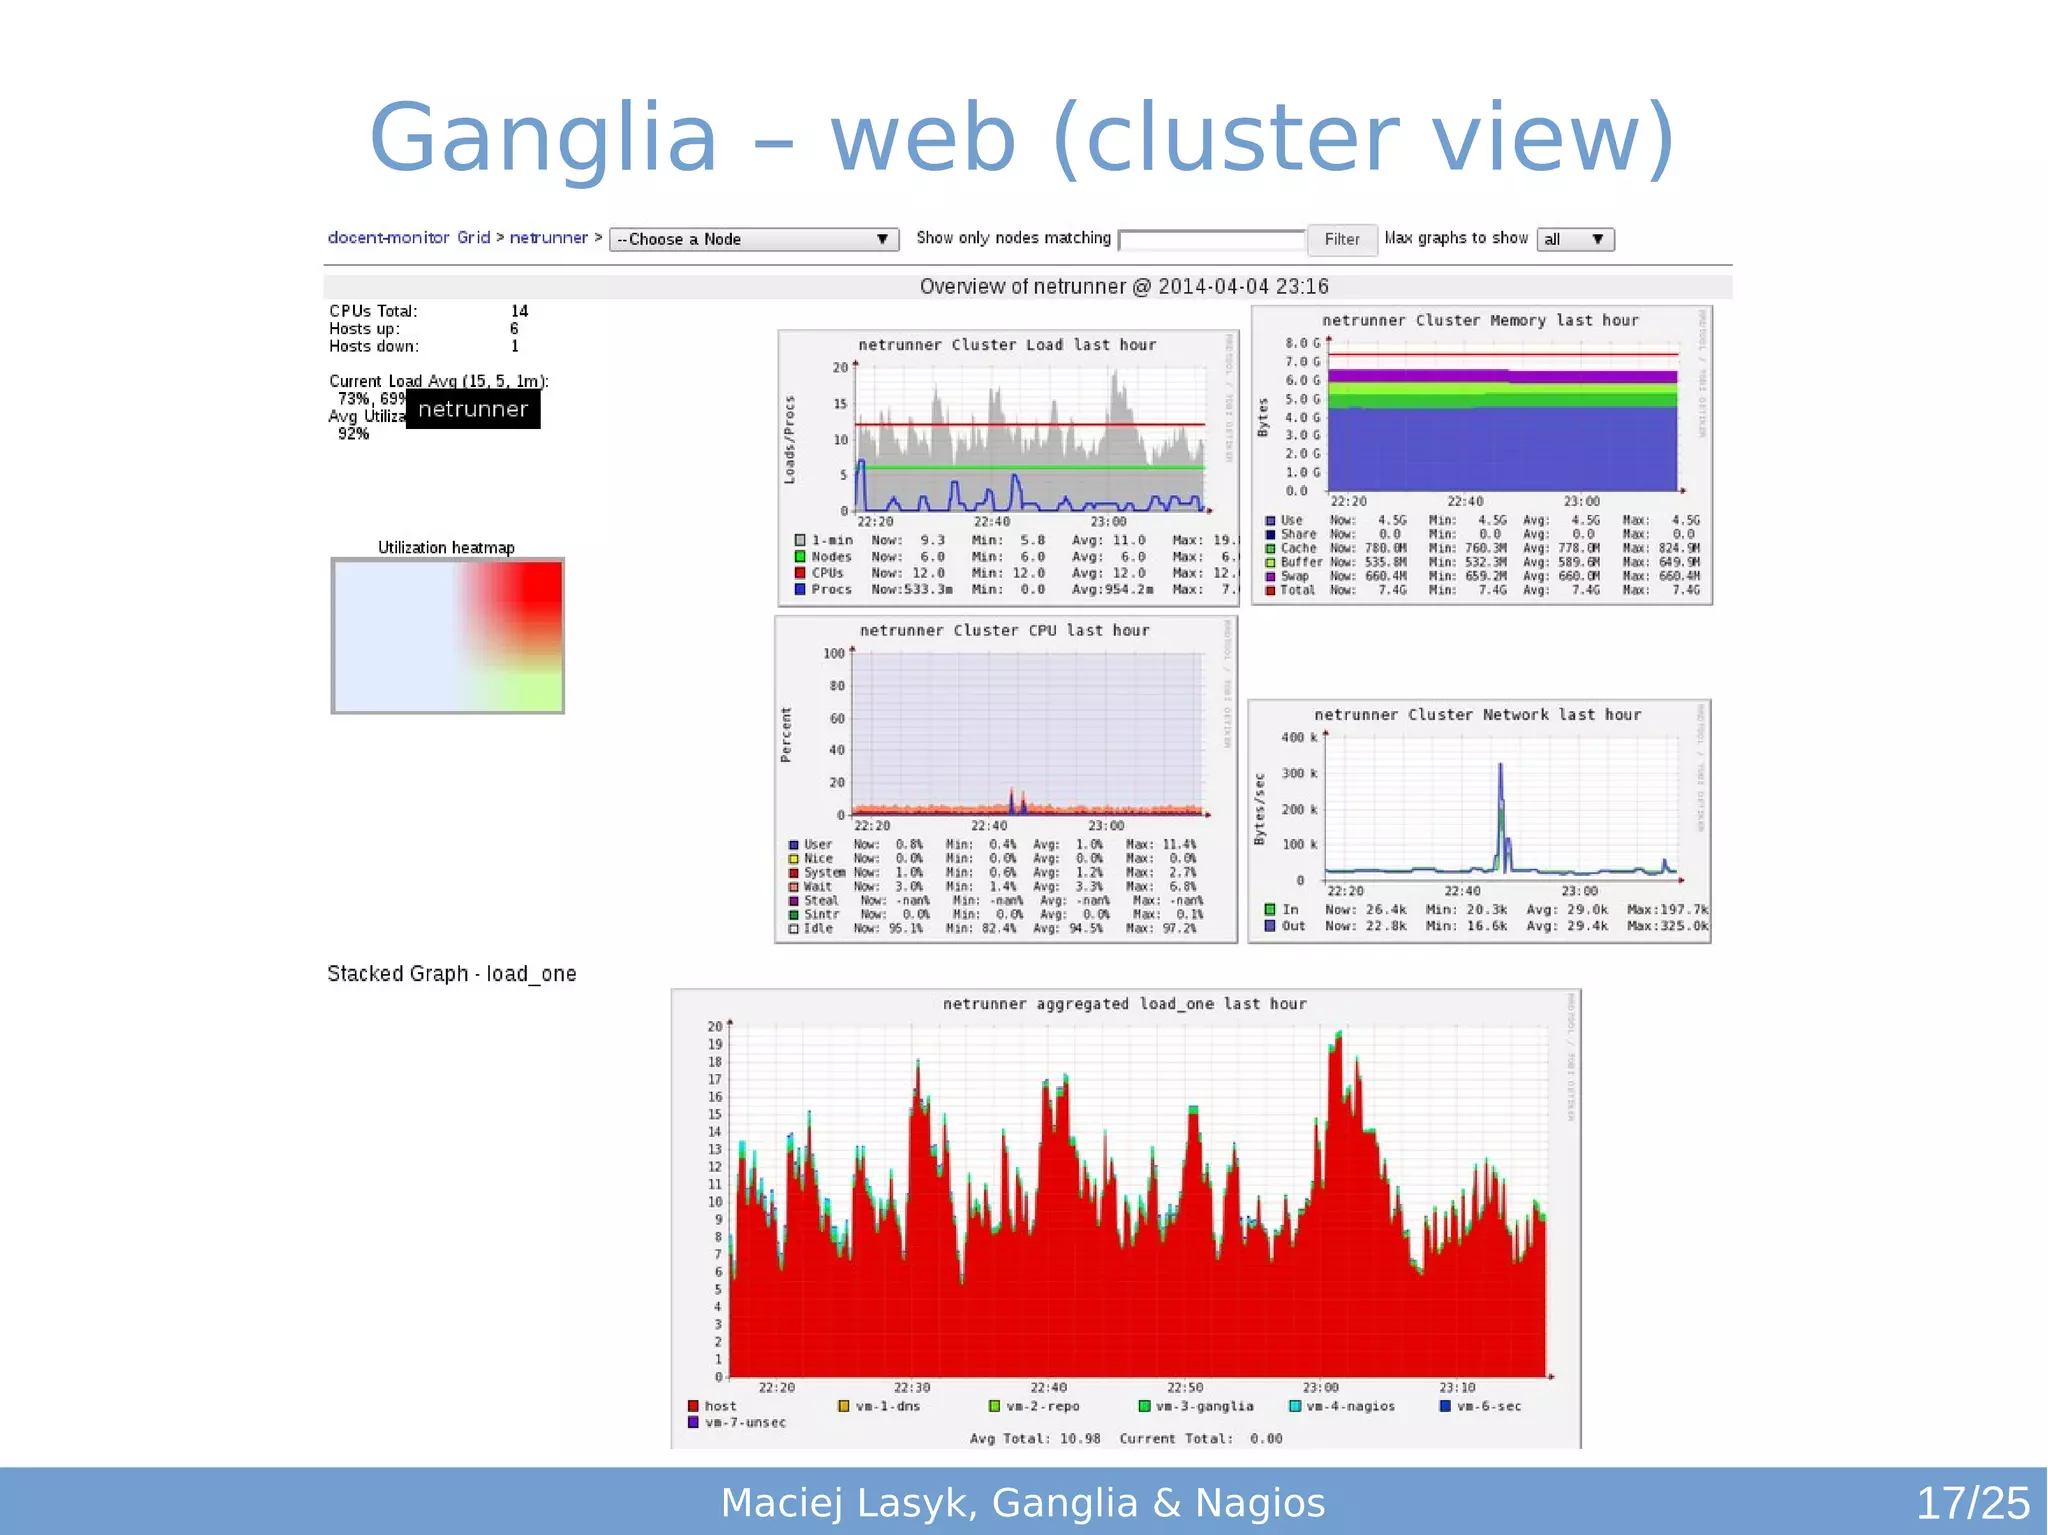
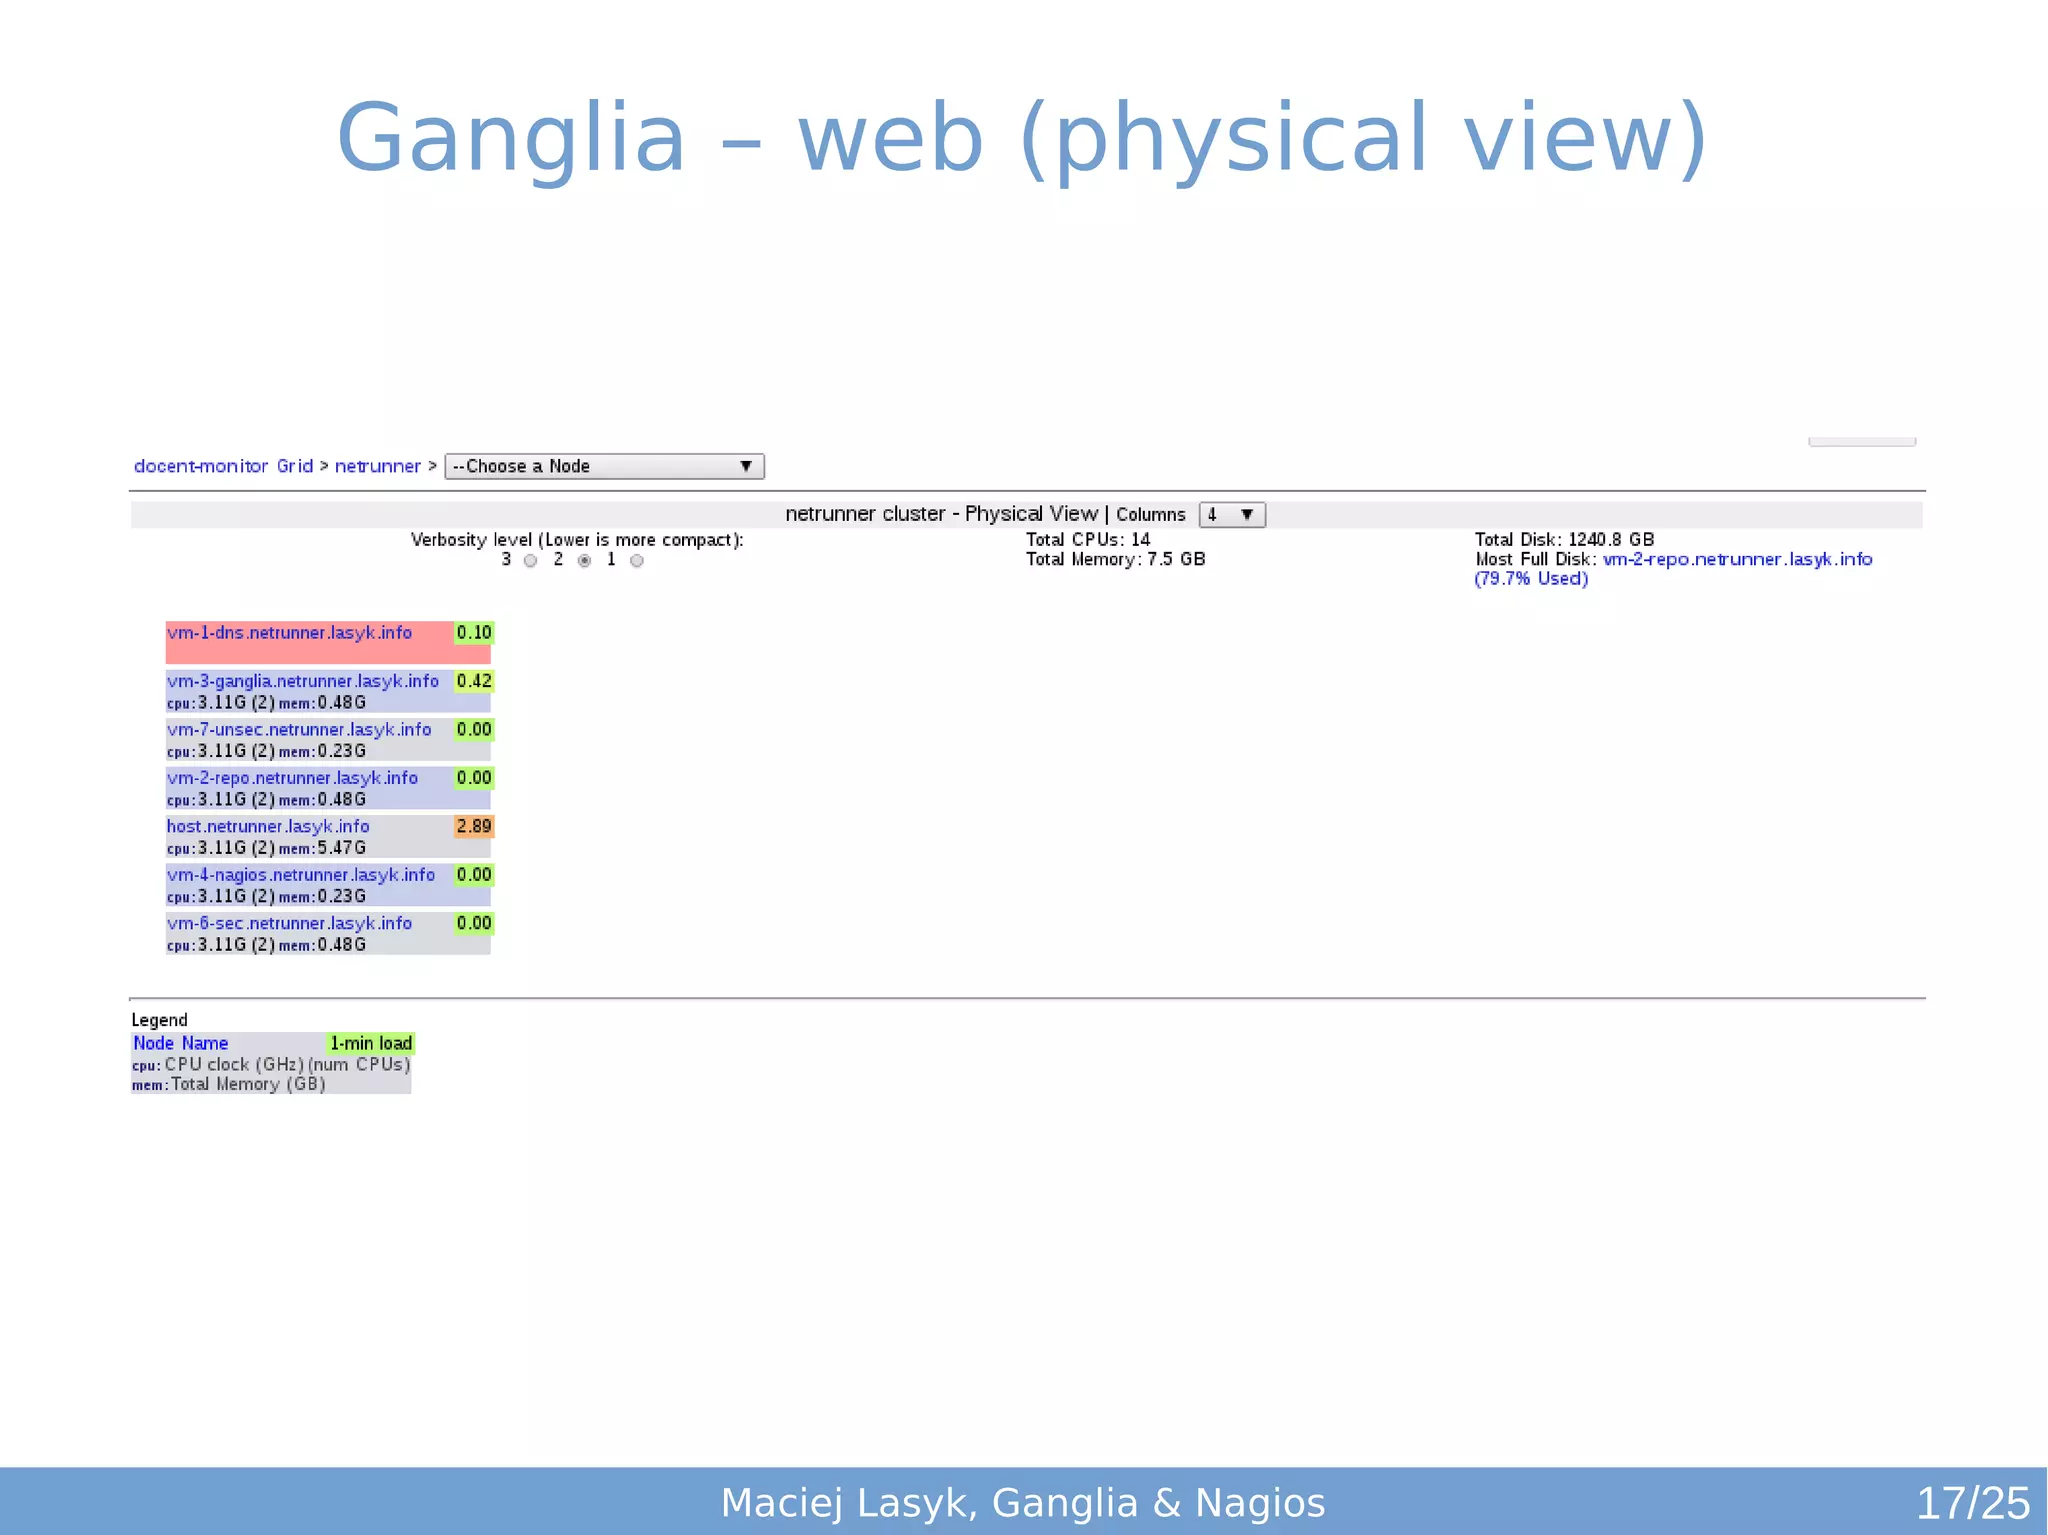
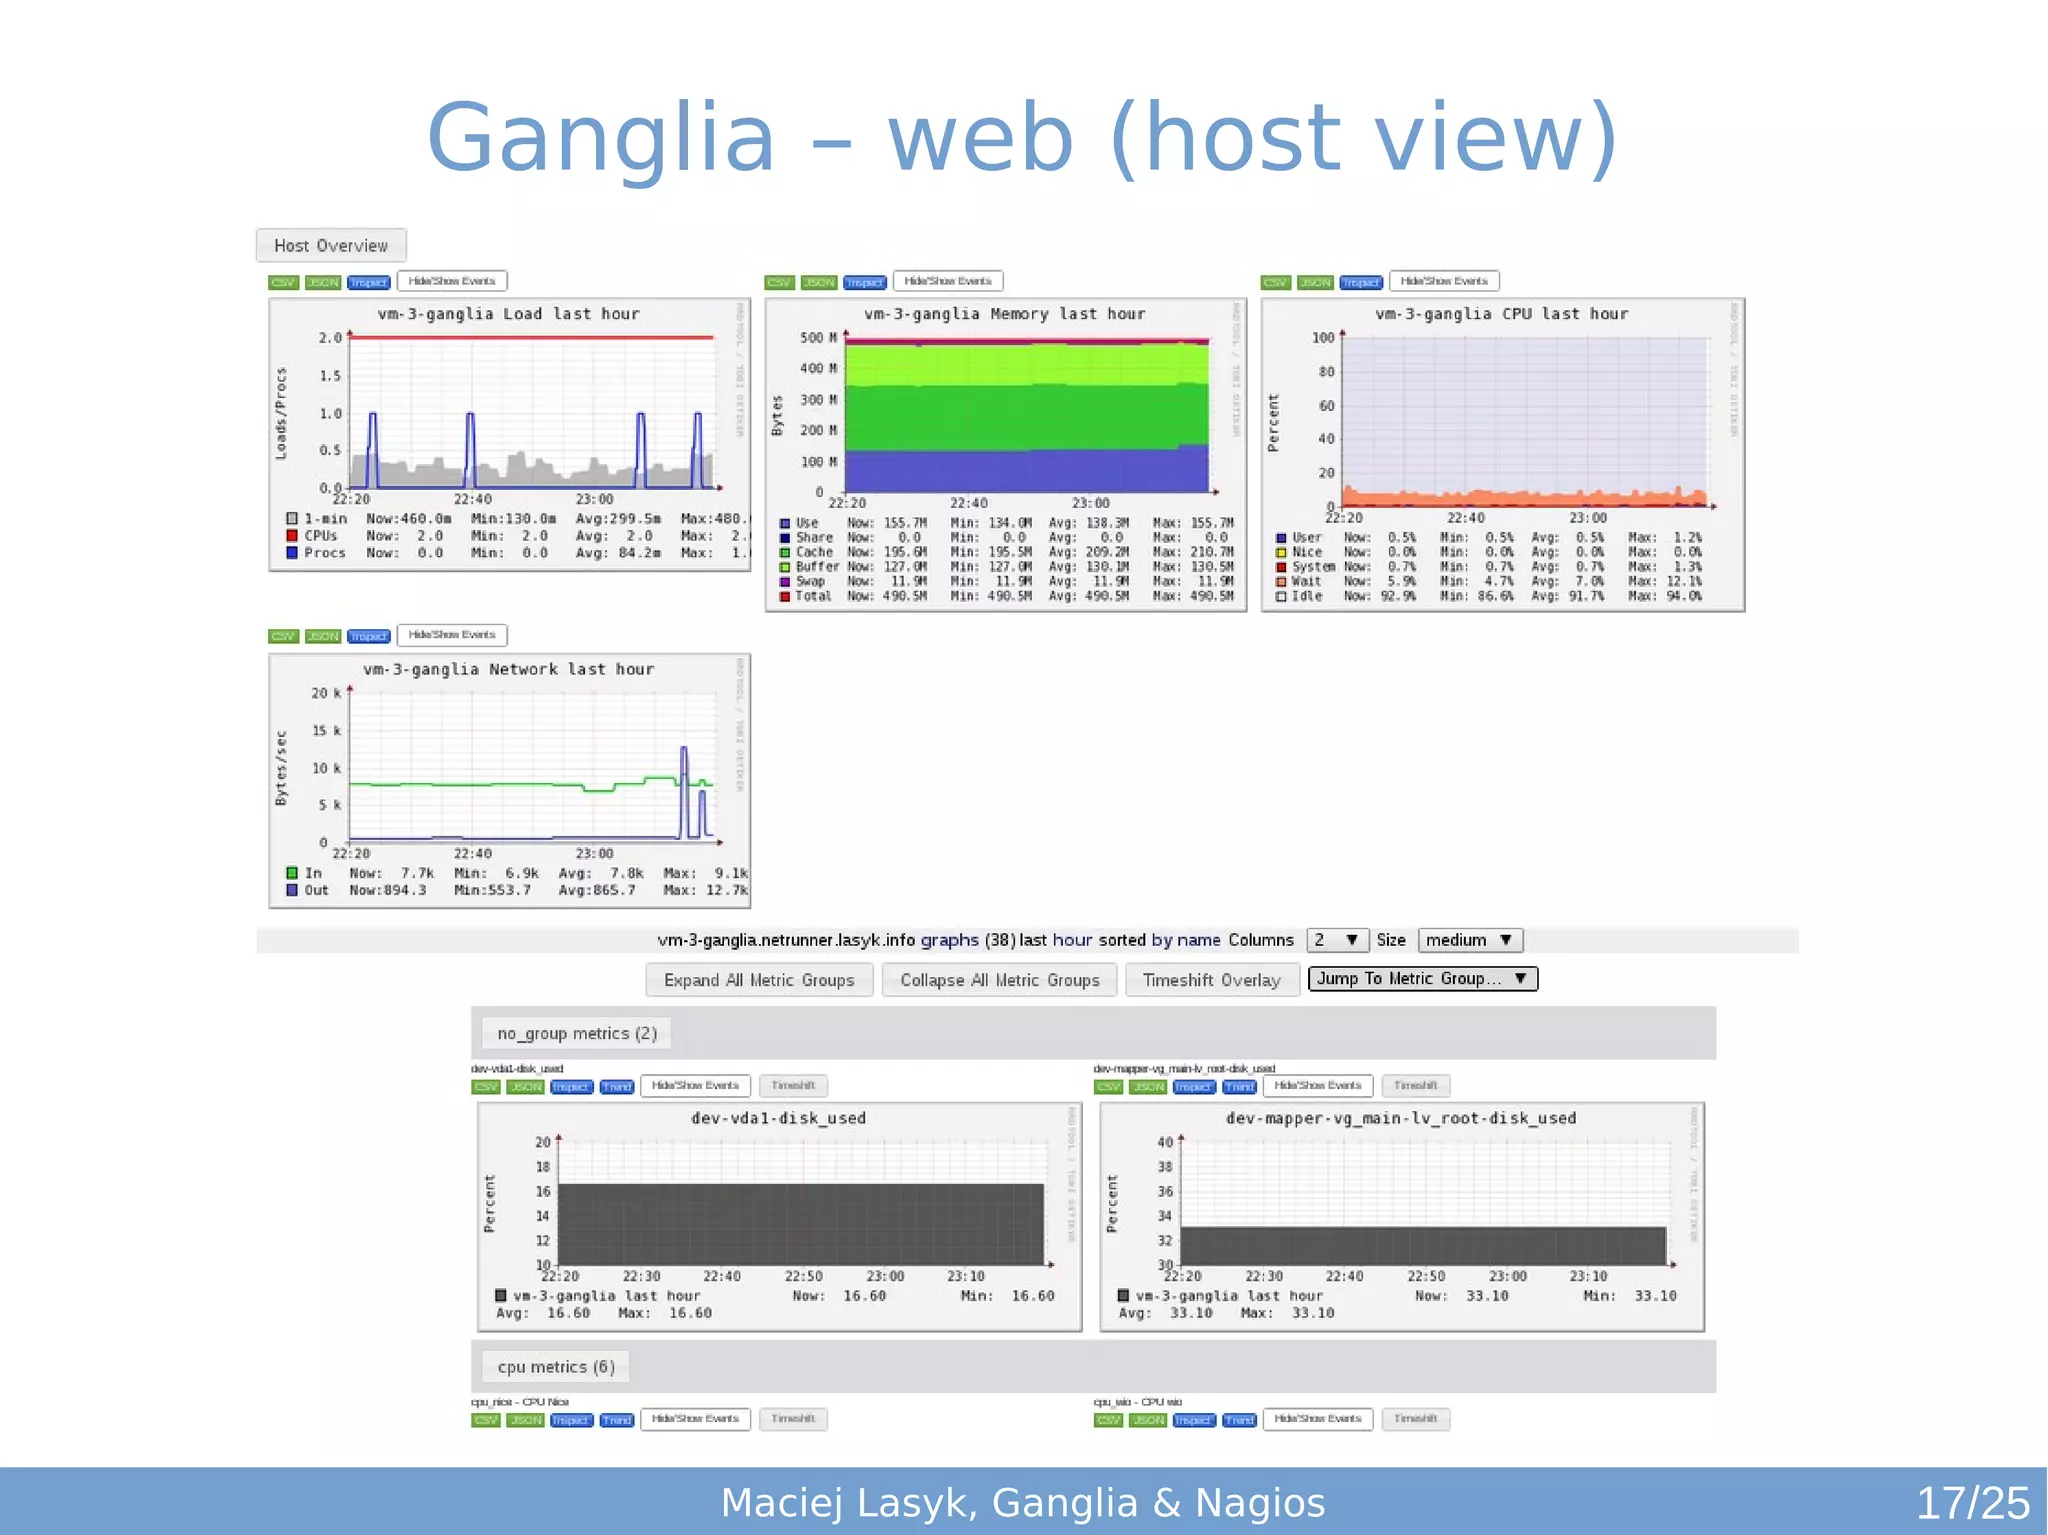


The document focuses on monitoring systems using Ganglia and Nagios, detailing their functionalities and integration capabilities. It addresses metrics such as uptime, mean time to diagnose, and repair, essential for high availability services. Additionally, it emphasizes the importance of best practices in monitoring and provides insights into the architectures and topologies of Ganglia.


![Nagios core vs. nagios xi presentation power point.pptx [diperbaiki]](https://cdn.slidesharecdn.com/ss_thumbnails/nagioscorevs-160911025342-thumbnail.jpg?width=640&height=640&fit=bounds)