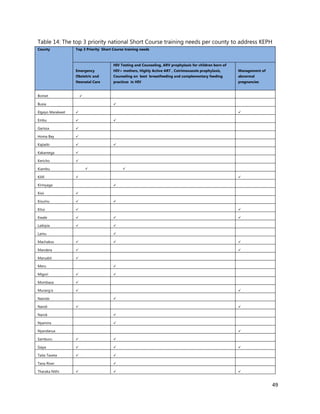
This document summarizes the findings of a training needs assessment of Kenya's health workforce conducted by the Ministry of Health in 2015. Key findings include:
- There are gaps in specialist skills across various clinical disciplines including internal medicine, surgery, anesthesia and nursing.
- Priority areas for in-service training were identified to strengthen delivery of essential health services. Management training was also a priority need.
- County health departments and management teams need training in leadership, management, governance, planning and other administrative functions to improve performance.
- Bottlenecks like lack of skills, weak coordination and low community awareness were negatively impacting service delivery.
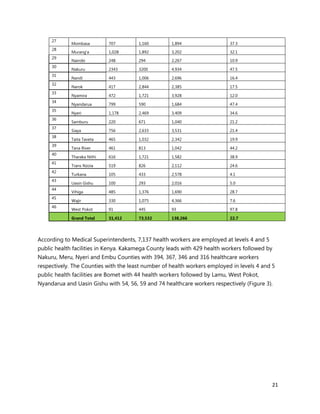
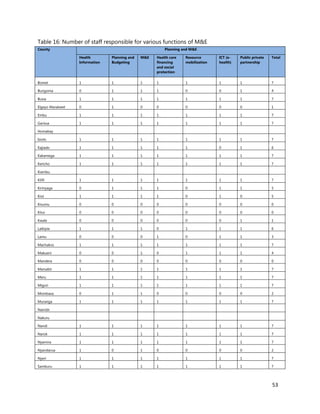

![126
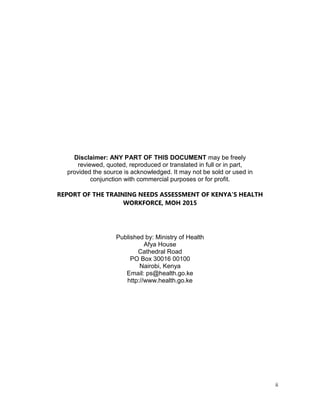
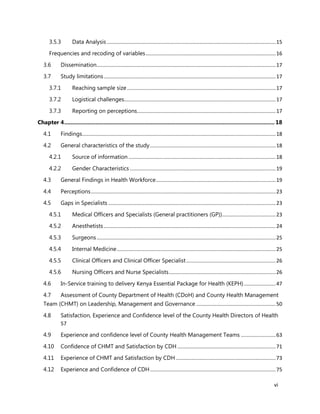
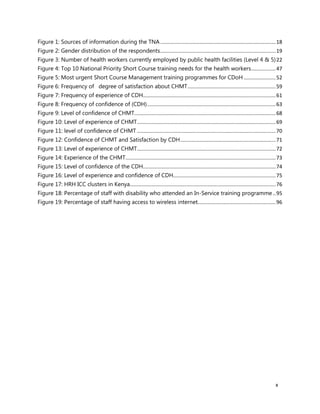
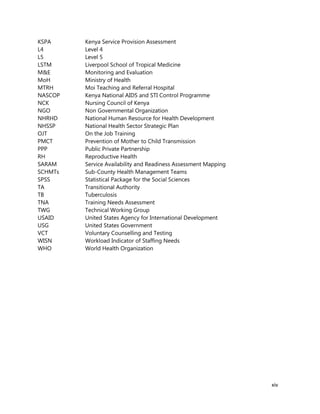
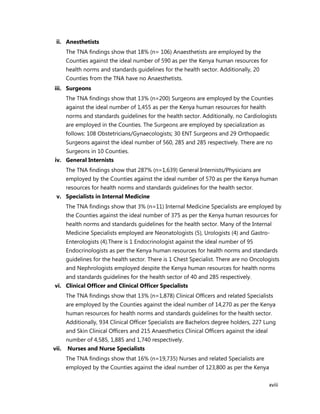
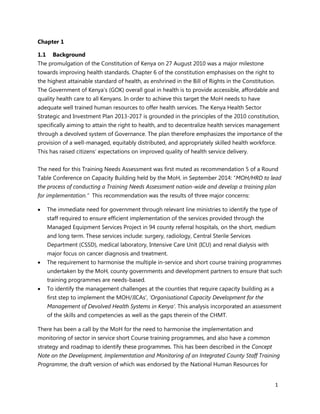
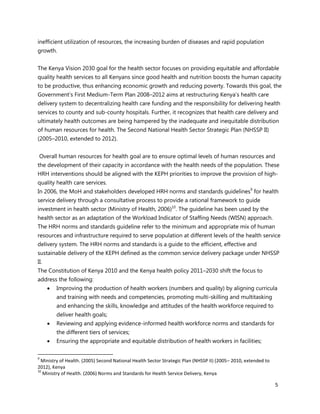
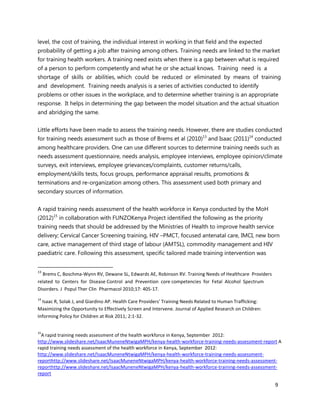
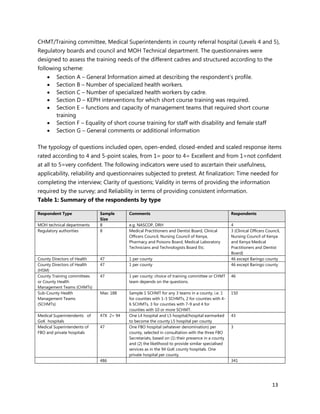
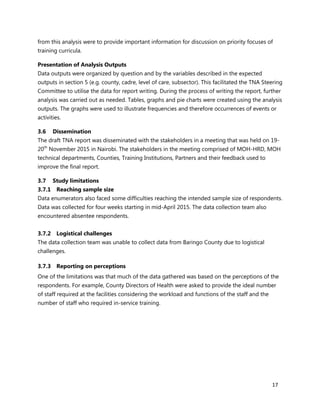
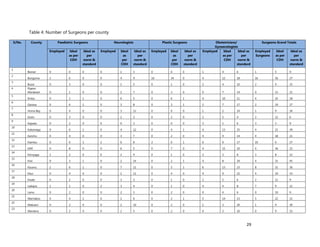
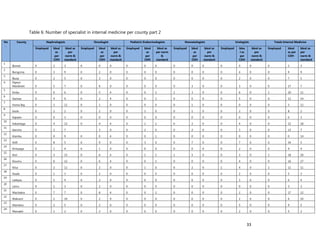
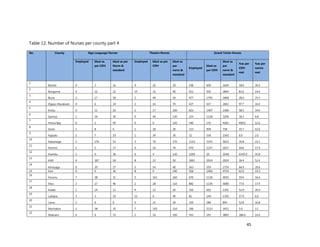
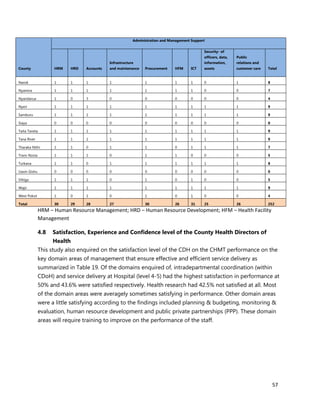
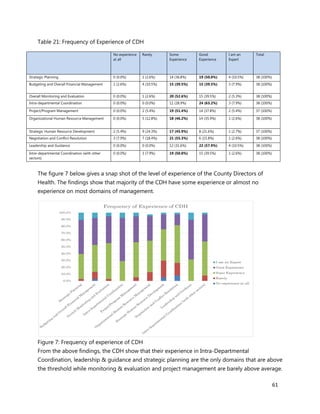
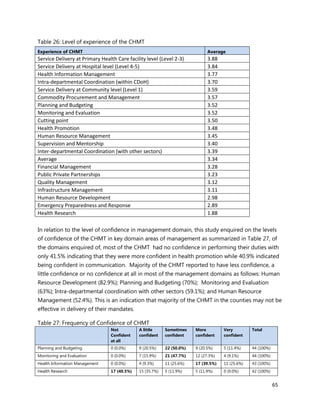
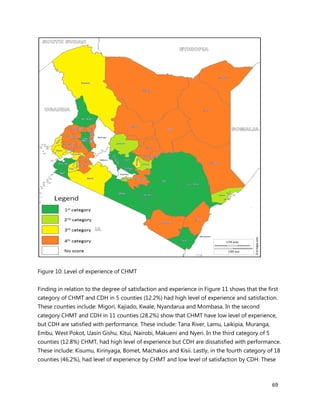
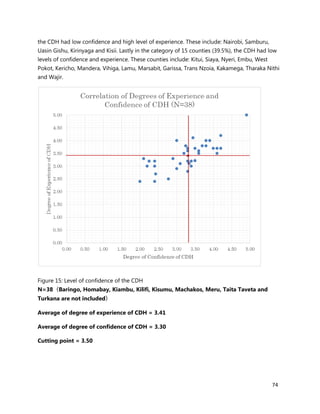
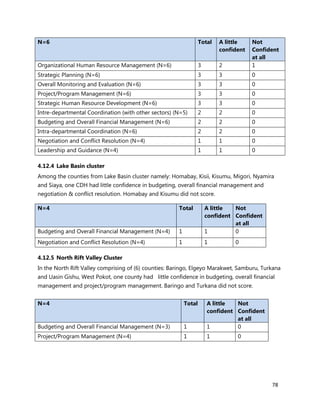
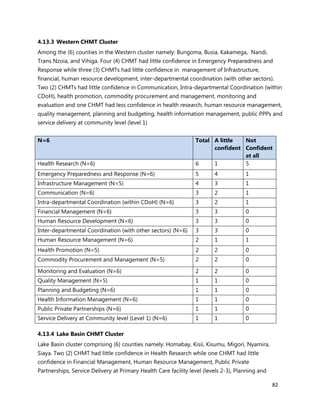
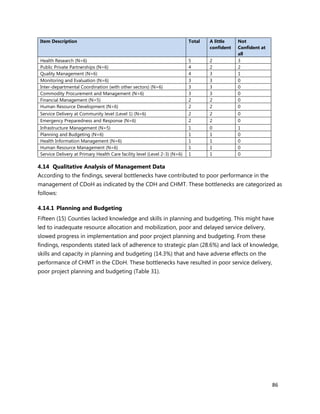
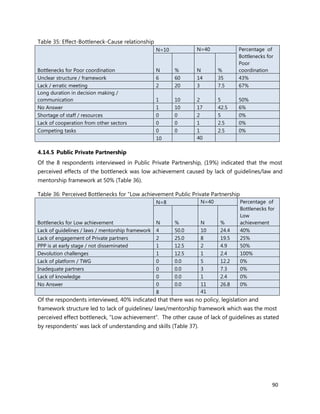
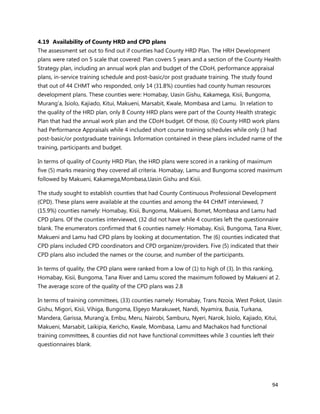
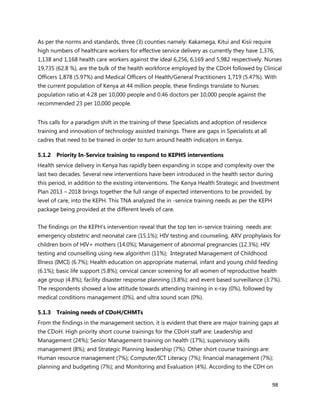
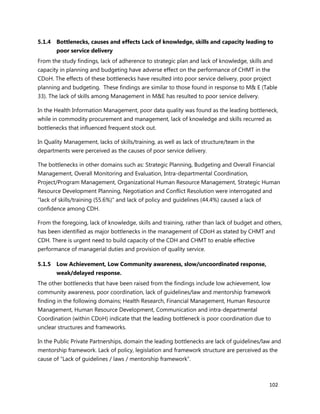
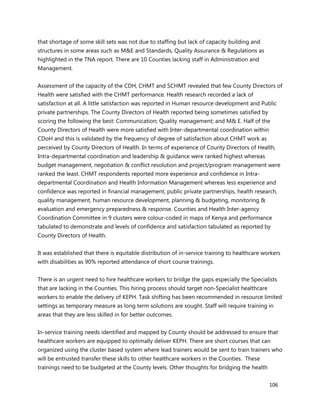
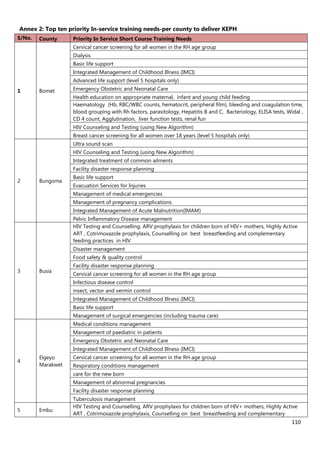
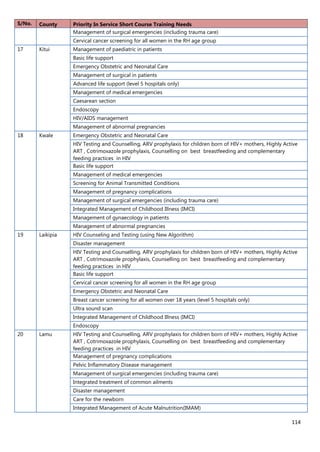
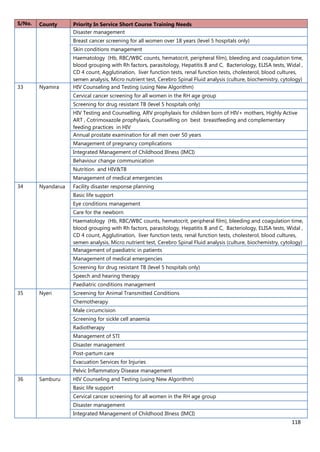
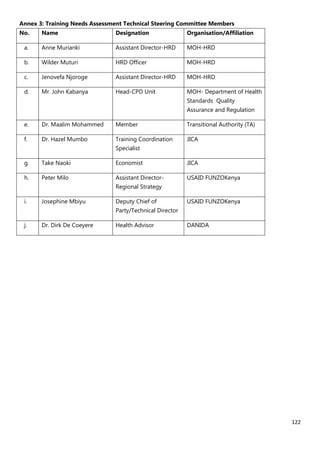
Annex 7: Questionnaire for County Chief Officer of Health, CHMT members, Medical
Superintendents of hospitals and Health Facility Managers
Name of Interviewer: ________________________________ Date: ___________________
Tool code: PM_________ Name of Respondent: _________________________________
[A1] Code of Facility: _________ [A2] County Code: _________
[A3] Ownership of facility: Public Private Faith based other (check as appropriate)
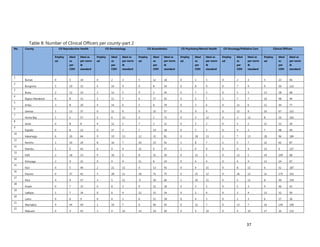
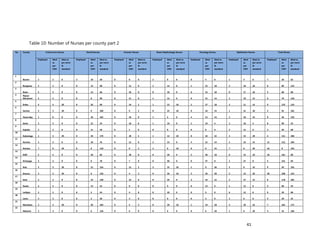
1. [A4] Number of workers in County /health Facility/Organization/, by cadre including specialist:
CADRE NUMBER(#)
A .Physicians
I. General Practitioners(GP)
II. Anesthetics
III. Pharmacists
IV. Neurosurgeons
V. Obstetrics &Gynecologist
VI. Ophthalmologist
VII. Pediatricians
VIII. Dentists
IX. Renal Specialists/urologists
X. Pathologist
XI. Psychiatrists
XII. Radiologist
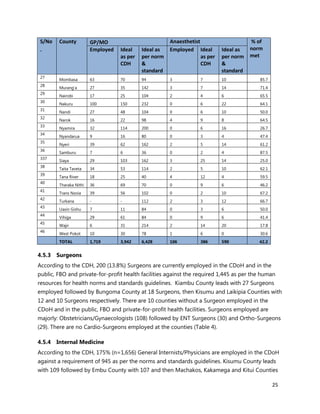
XIII. Oncologists
XIV. Chest specialist
XV. Dermatologists
a. Nurses
b. Medical Lab Technologists/Technicians
c. Clinical Officers (CO)
d. Pharm. Techs.
e. Public Health/Environmental Health Officers/Technicians
f. Nutritionists
g. Health Records Information Officers/technicians
h. Others (Please specify)](https://image.slidesharecdn.com/0f497df0-745d-4e0e-8fdd-4578098f62fe-160729035643/85/MoH-Training-Needs-Assessment-Report-August-2015-147-320.jpg)
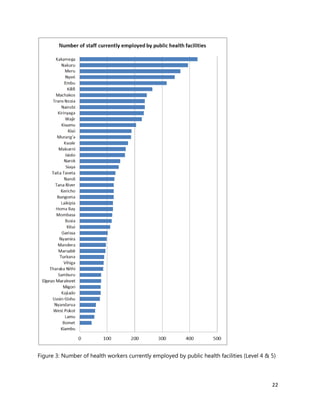
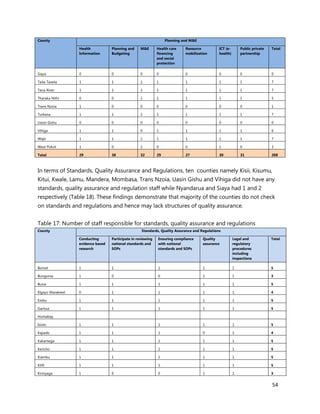
![127
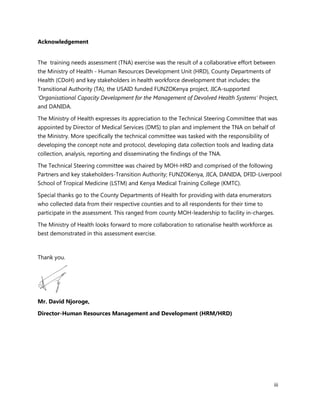
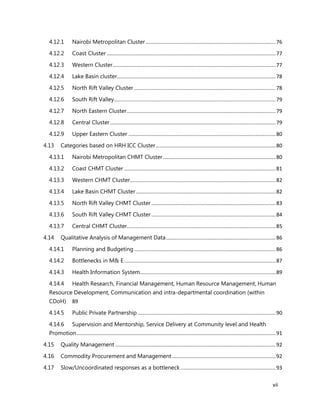
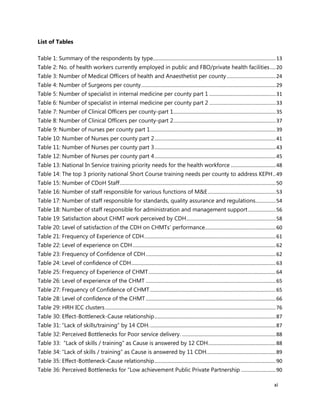
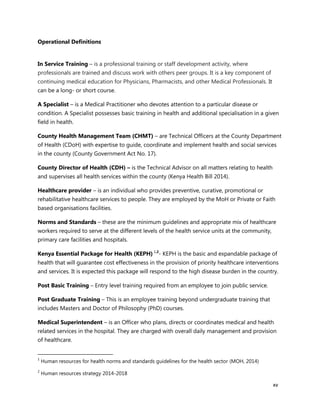
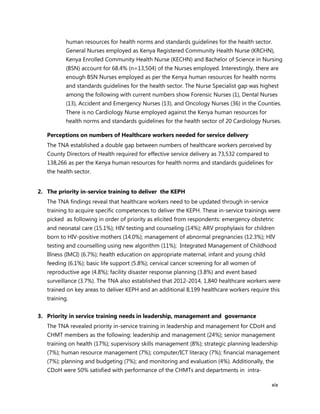
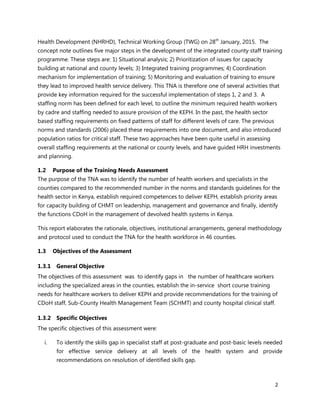
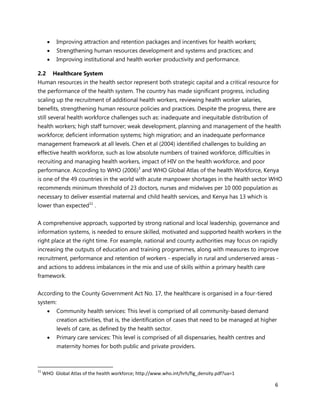
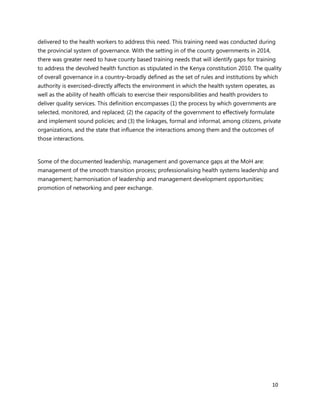
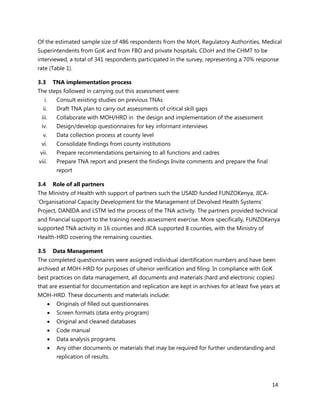
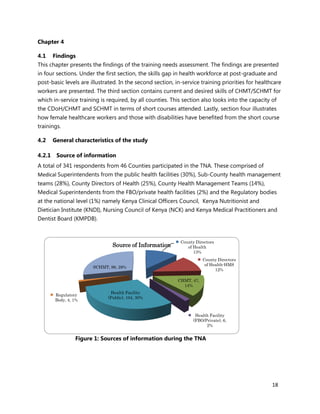
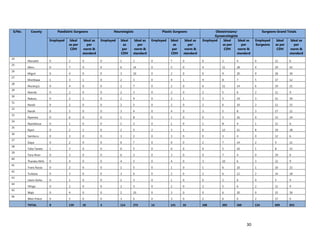
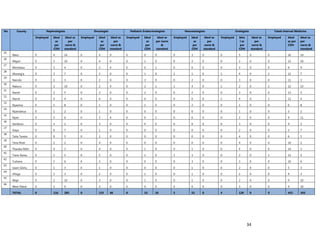
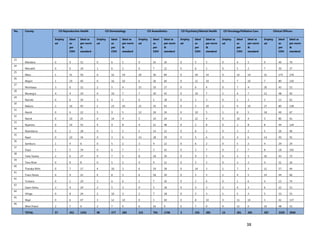
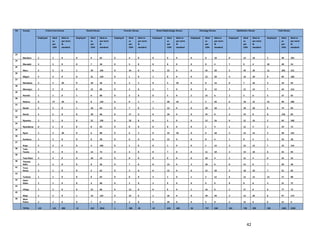
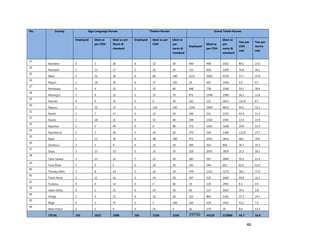
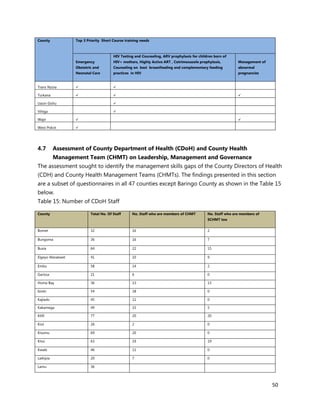
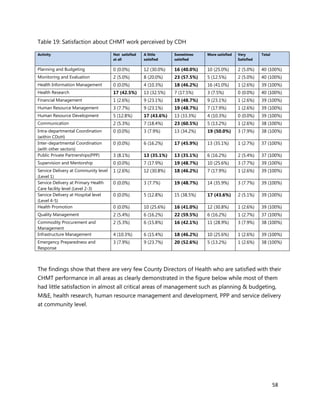
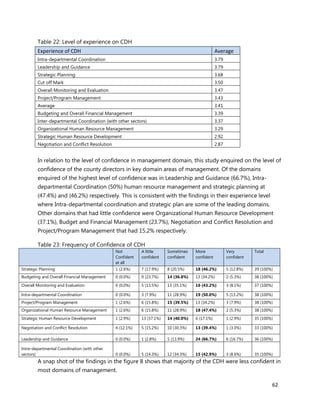
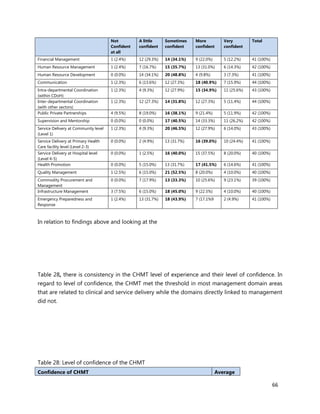
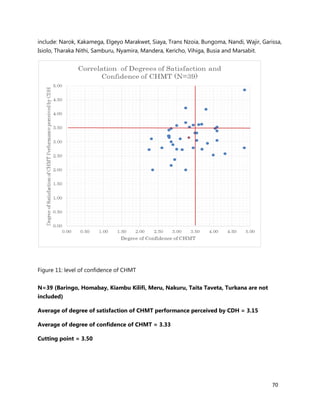
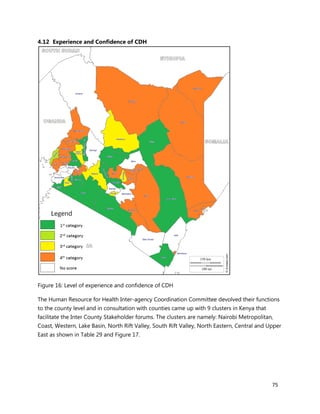
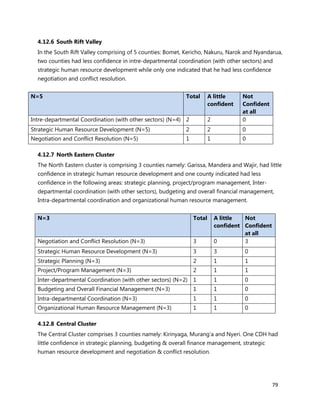
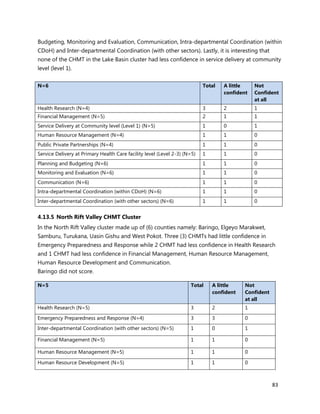
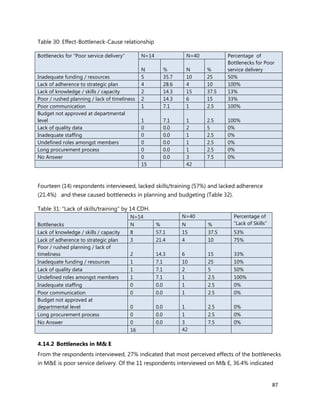
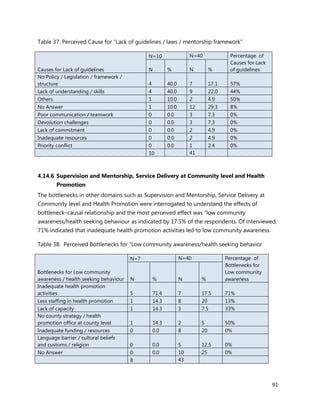
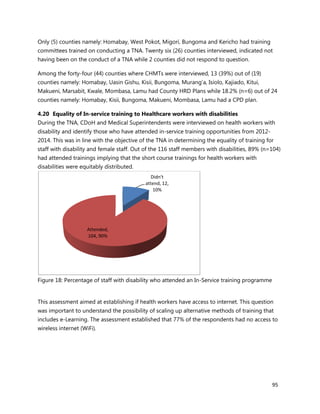
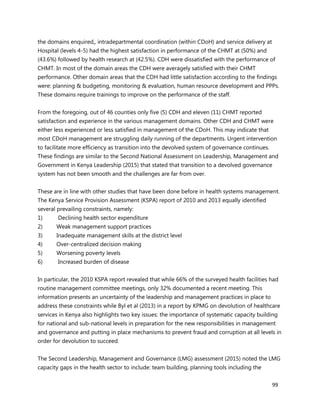
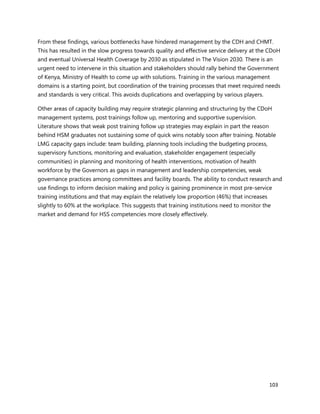
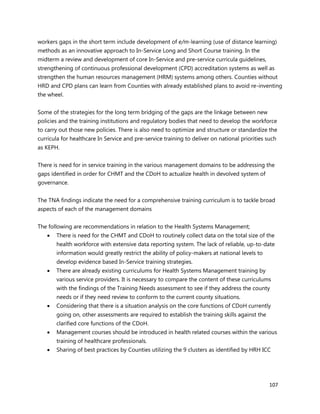
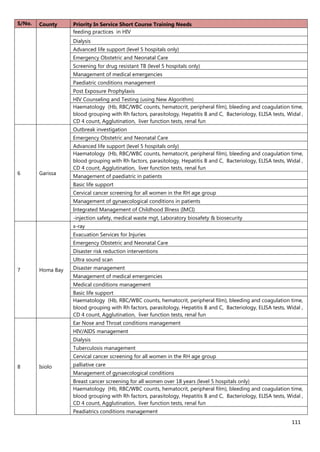
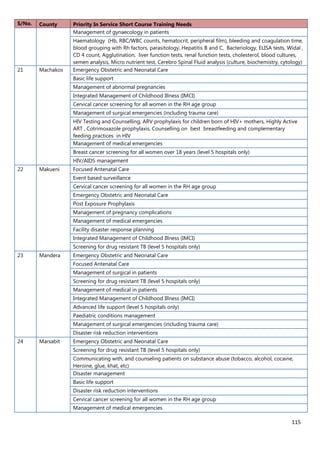
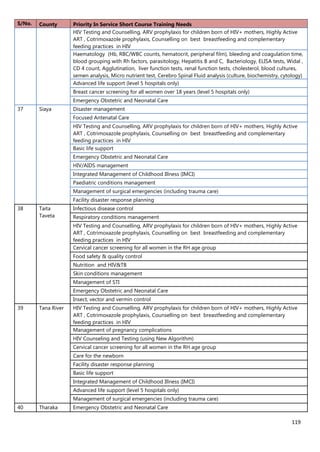
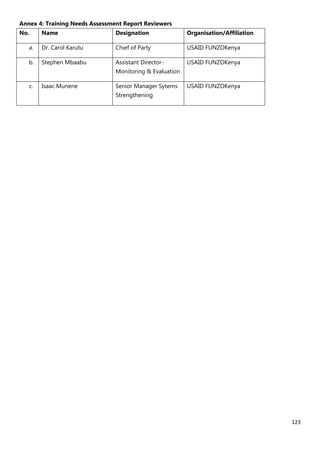
2. [A5] The following are some of the key service delivery and training need areas. Please put an “X” by the
top five for which you think training is most critically needed at your county/ health facility
KEY TRAINING
AREA
CRITICAL?
“X”=YES,
BLANK =NOT AT
THIS TIME
KEY TRAINING AREA CRITICAL?
“X”=YES,
BLANK =NOT AT
THIS TIME
HIV/AIDS Family planning
PMTCT Long acting & Reversible methods of
Family Planning
Pediatric HIV
care
Cervical Cancer Screening
Adult ART Sexual Gender Based violence(SGBV)
HIV Counseling
and Testing
using New
Algorithm
Malaria Case Management
Pediatric
Tuberculosis(TB
)
Integrated Commodity
Management(HIV,FP, etc)
TB Management
(Microscopy)
M&E – use of MOH tools for
monitoring
MDR TB
Management
Leadership and Management
Nutrition and
HIV&TB
Supportive supervision
MNCH Effective communication and giving
feedback
Focused
Antenatal Care
(FANC)
Budgeting and budget control
Emergency
Maternal
Obstetric and
Neonatal
Care(EmONC)
Hospital Administration
Newborn Care Human Resource management
Maternal Infant
and young child
feeding
(MIYCF)
Others: Please specify
Integrated
Management of
Childhood
Illness (IMCI)
Integrated
Management of
Acute
Malnutrition
(IMAM)](https://image.slidesharecdn.com/0f497df0-745d-4e0e-8fdd-4578098f62fe-160729035643/85/MoH-Training-Needs-Assessment-Report-August-2015-148-320.jpg)
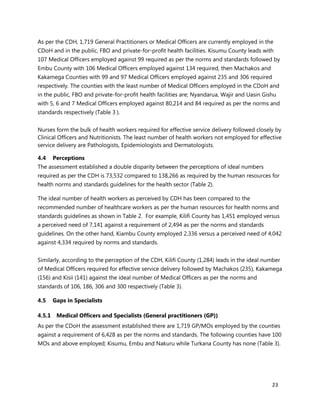
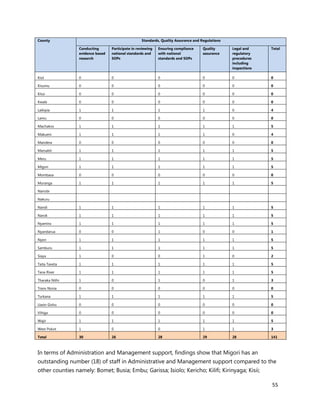
![128
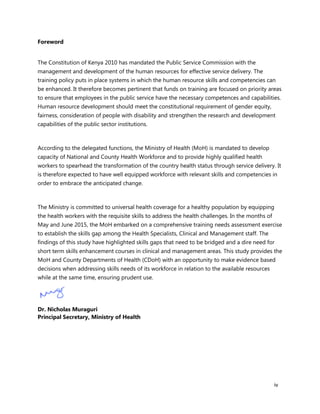
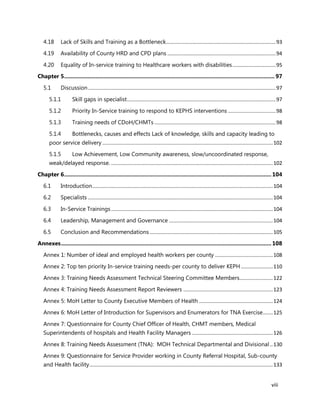
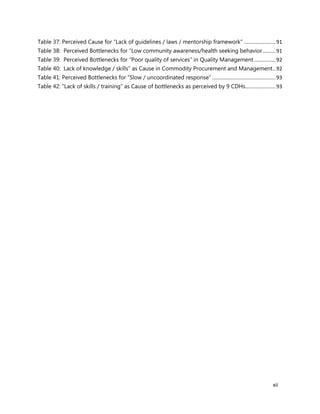
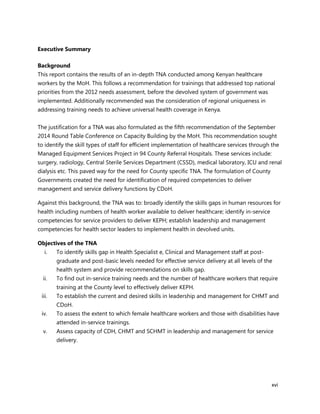
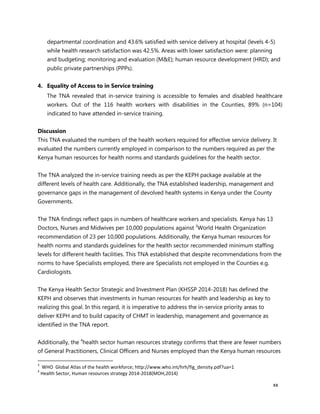
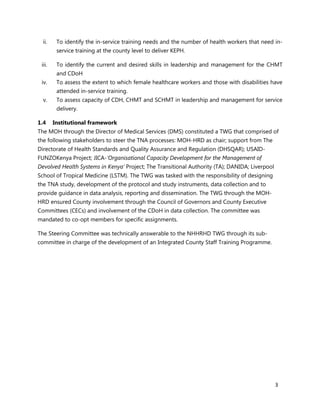
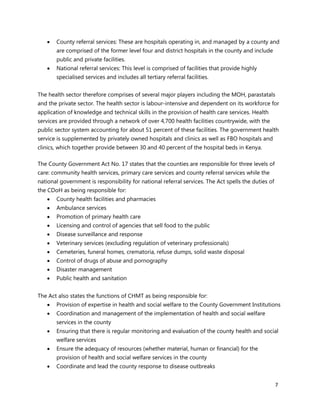
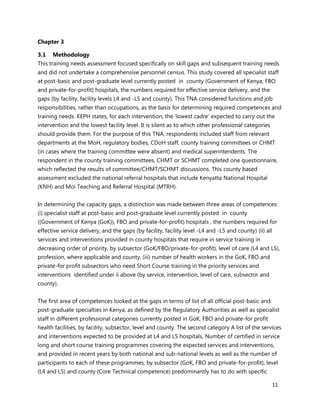
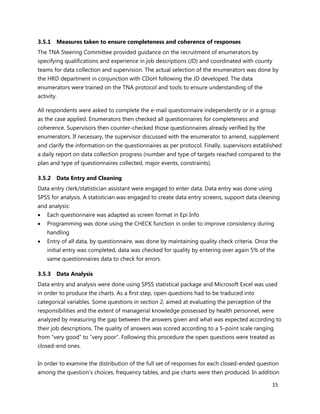
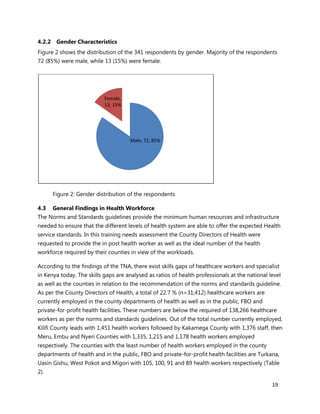
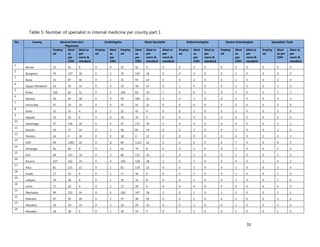
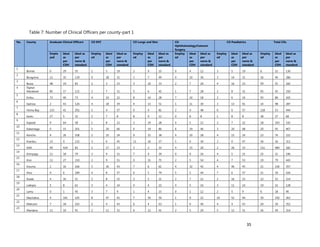
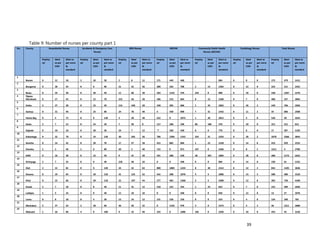
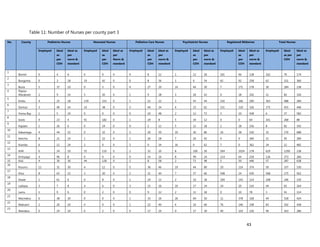
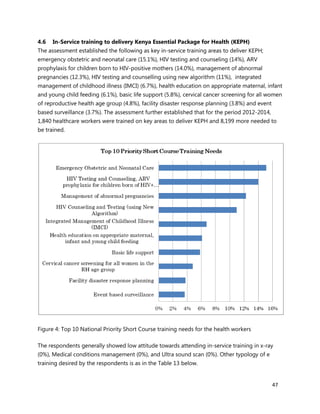
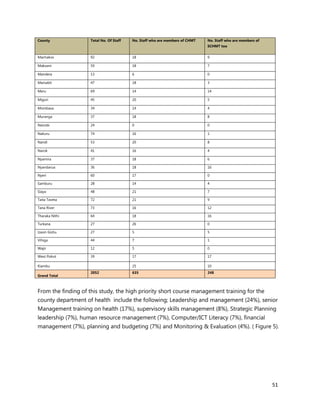
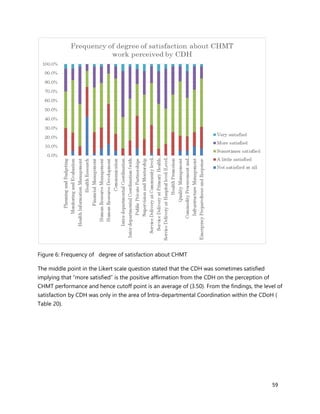
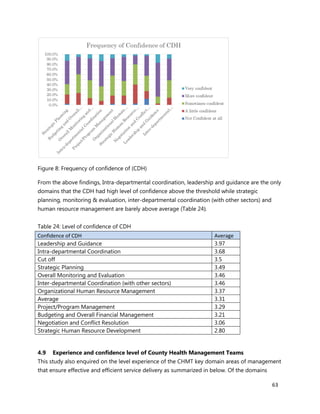
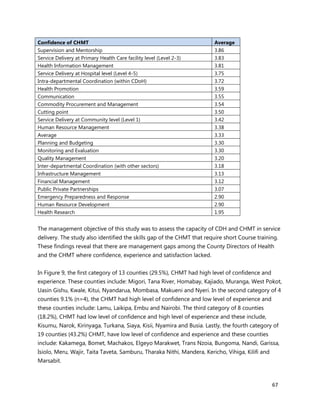
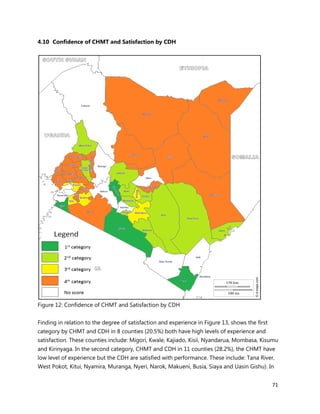
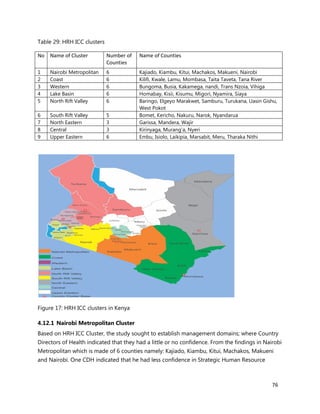
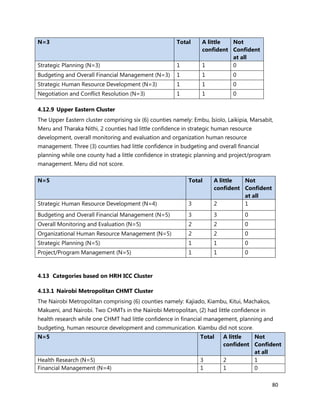
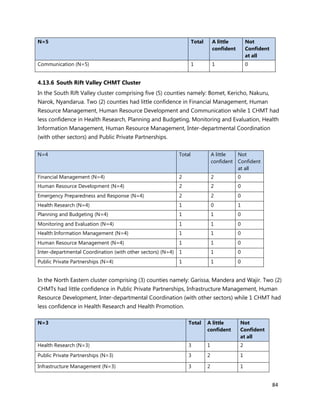
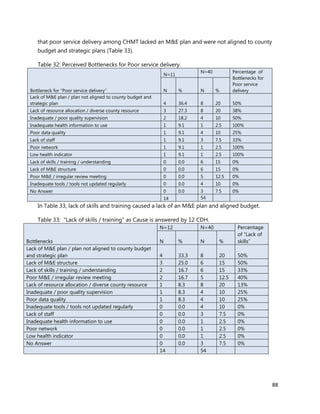
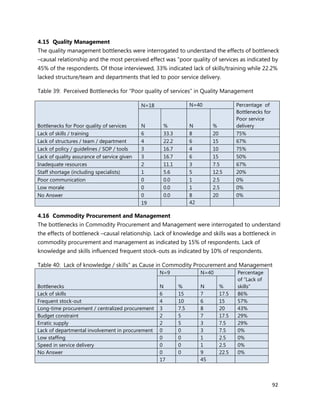
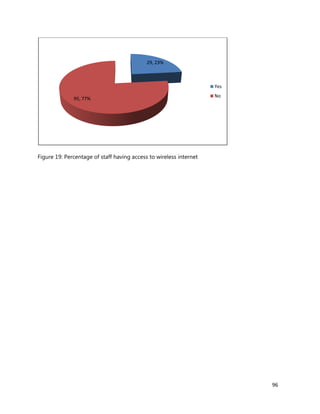
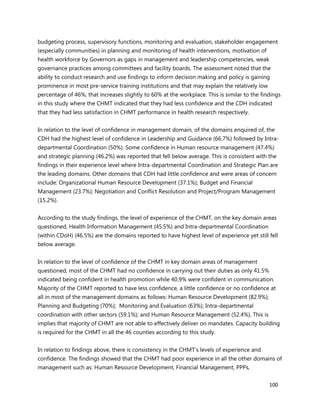
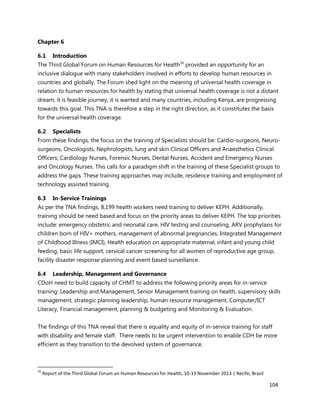
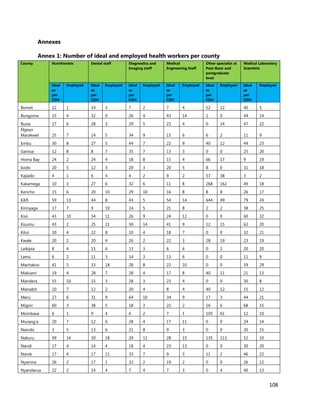
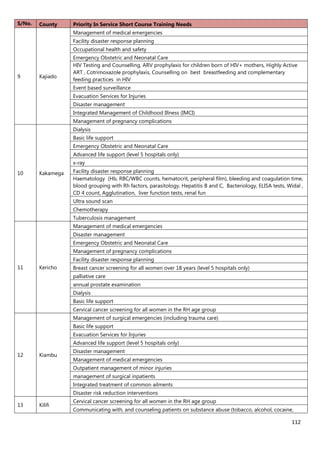
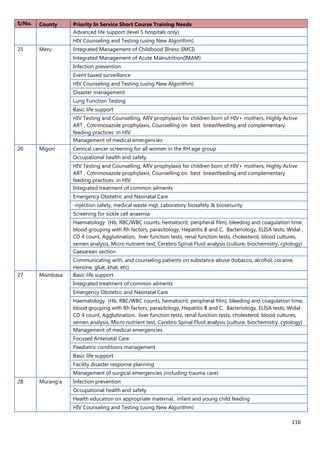
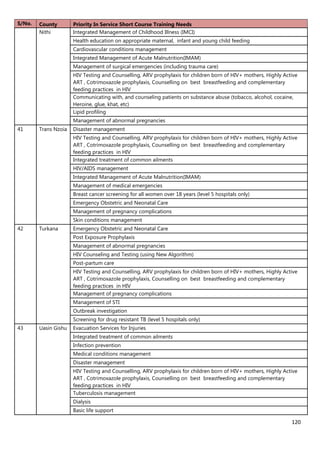
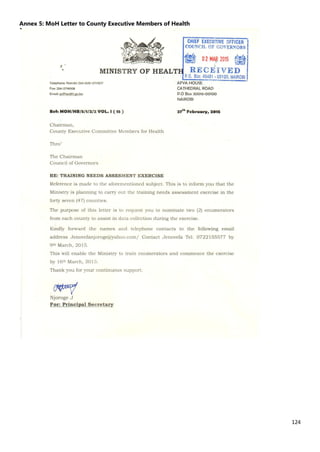
3. [A6] For each of the priority areas identified in NO. 2 , please indicate a) how many of your staff (health
workers have had training in the last 12 months and b) how many still need to be trained?
PRIORITY
AREA/CADRE
A)NUMBER OF HEALTH WORKERS
TRAINED IN LAST 12 MONTHS
B) NUMBER OF HEALTH WORKERS
WHO STILL NEED TO BE TRAINED
Priority Area #1
(Description)
Priority Area #2
(Description)
Priority Area #3
(Description)
Priority Area #4
(Description)
Priority Area #5
(Description)
4. [A7] Who usually provides training for your staff/health workers? (please check all that apply)
MOH Trainers Trainers from our own staff
Training Institutions Consulting Firms
National Organizations (NASCOP, etc.) Other (please specify in the space below)___________________
5. [A8] How do you usually pay for training for your staff/health workers?
Training budget provided through the Ministry of Health
Separate training budget provided by our organization/facility
Staff pays for their own training
Donor funding (please provide name:………………………
Other (please specify)………………………….
6. [A9] Do you have a robust (well structured, coordinated, on schedule and well attended) Continuous
medical education (CME) run in your county/facility?
Yes No
7. [A10] Do you have a functional training committee in your county/facility that coordinates training of
health workers in regard to identifying training needs, nominating staff for training and providing post
training follow up as required?
Yes No
8. [A11] Where is training usually provide for your staff?
MOH facility nearby (please name: _____________________________)
In-house training room/facility
Hotel
Other training facility (please name: _____________________________)
9. [A12] Do you have access to the following for training at your facility?
COMPONENT YES/NO WHAT IS THE QUALITY/CONDITION OF THE
EQUIPMENT/SERVICE? (4= EXCELLENT. 3= GOOD,
2=FAIR, 1=POOR)
Wired Internet](https://image.slidesharecdn.com/0f497df0-745d-4e0e-8fdd-4578098f62fe-160729035643/85/MoH-Training-Needs-Assessment-Report-August-2015-149-320.jpg)
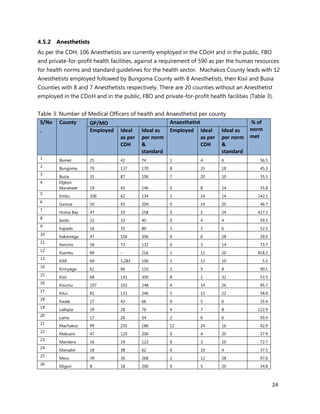
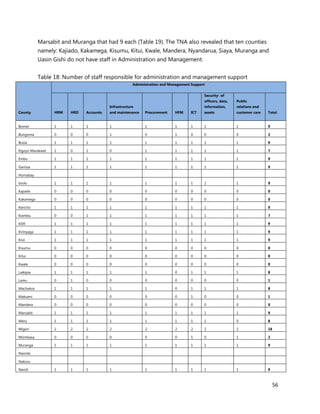
![129
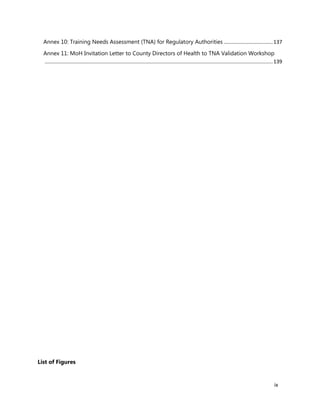
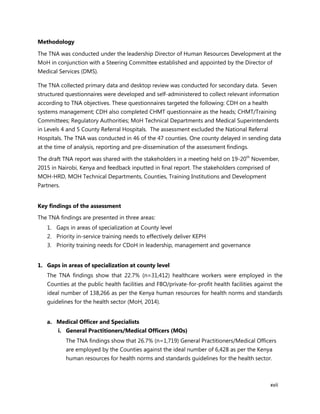
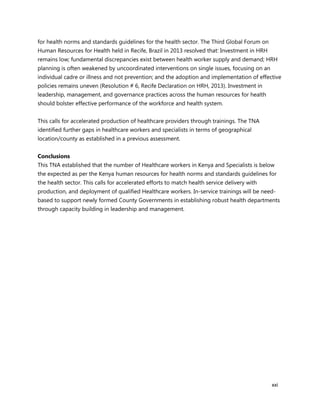
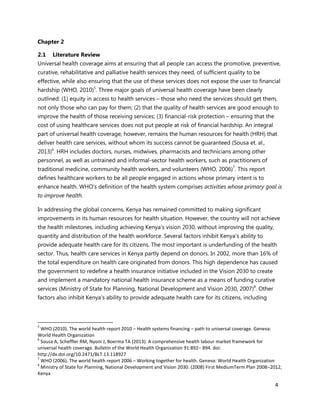
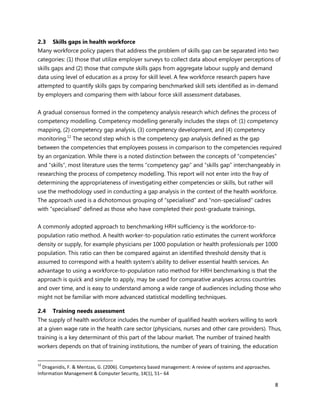
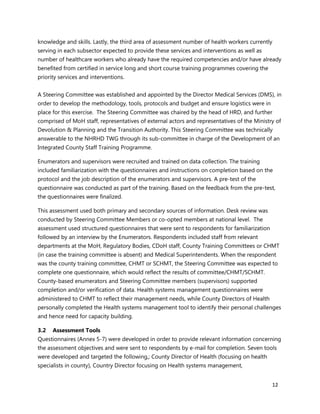
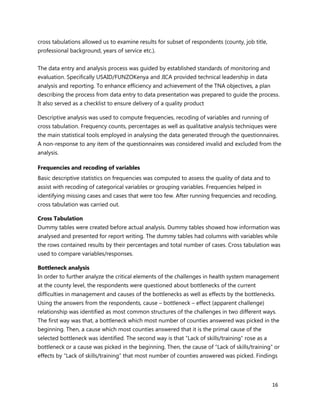
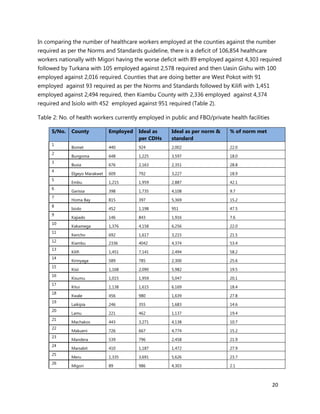
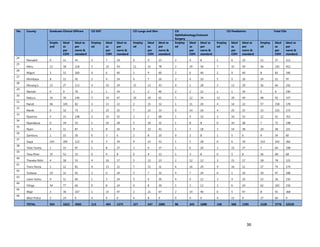
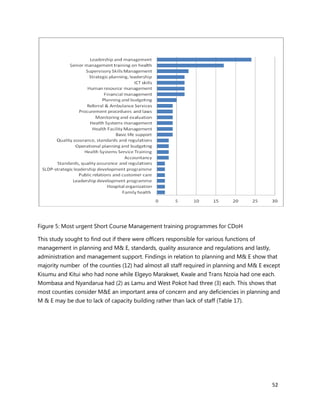
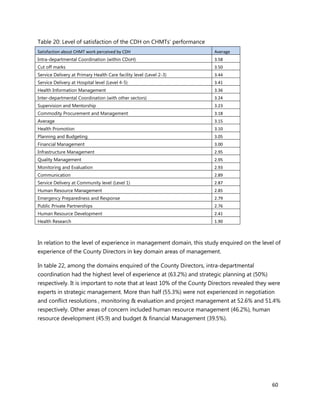
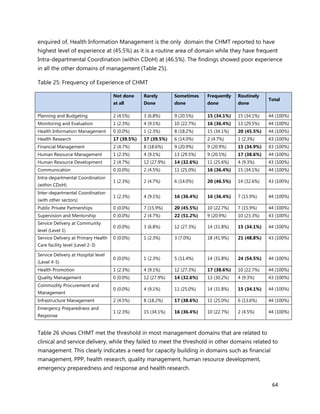
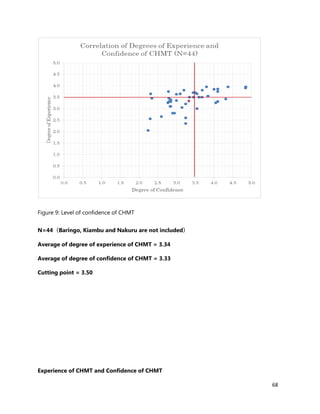
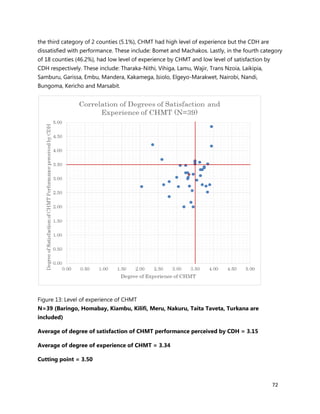
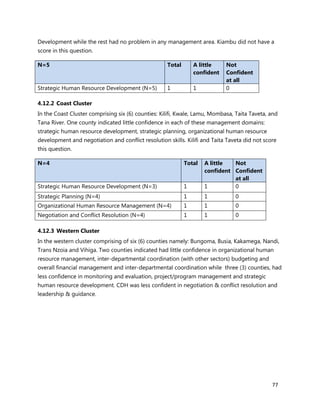
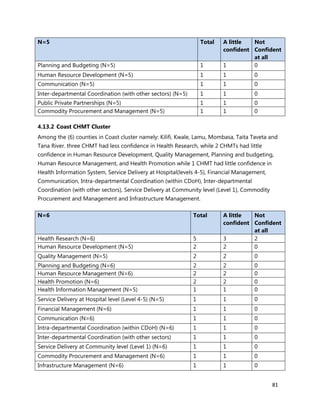
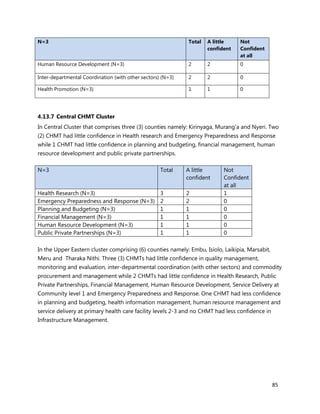
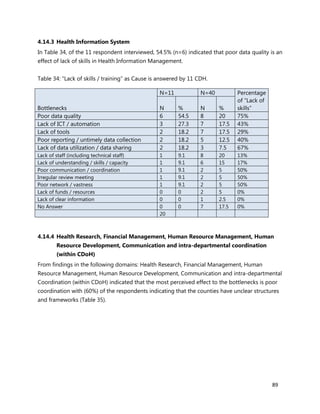
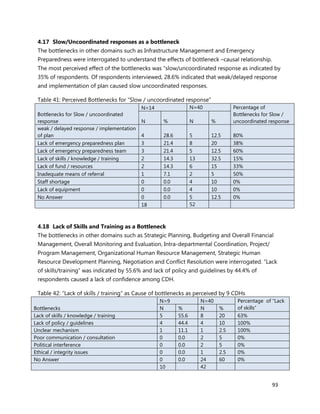
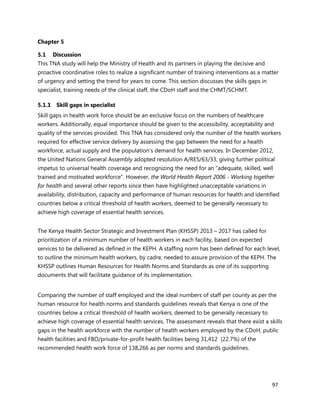
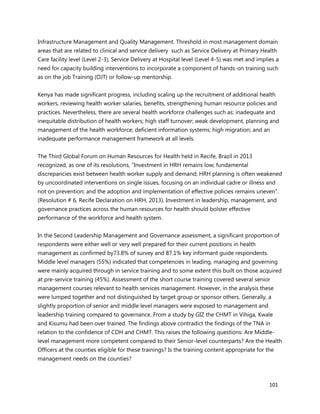
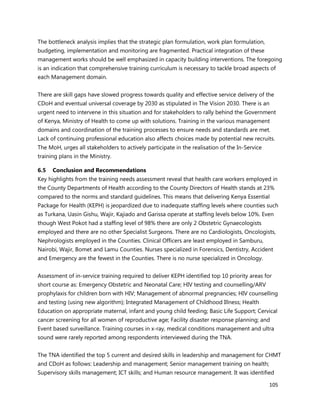
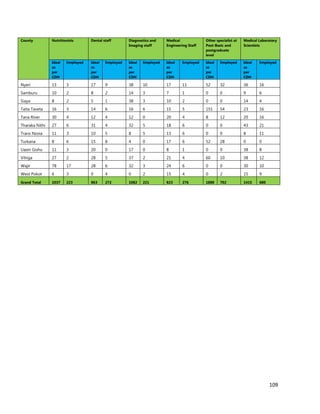
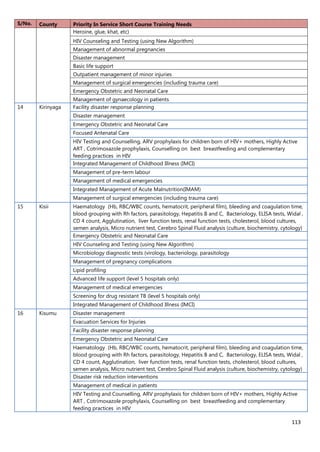
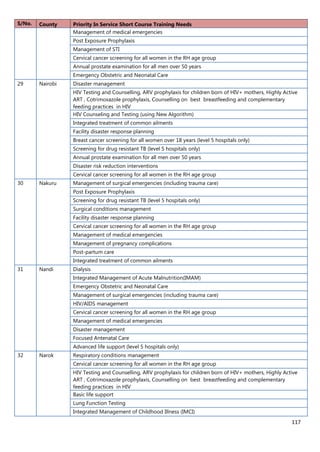
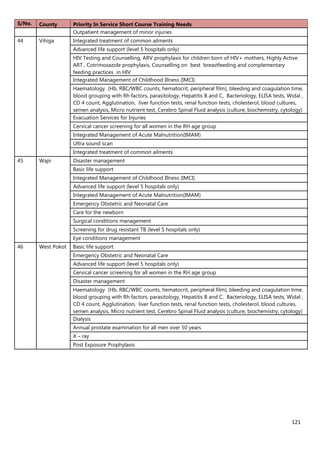
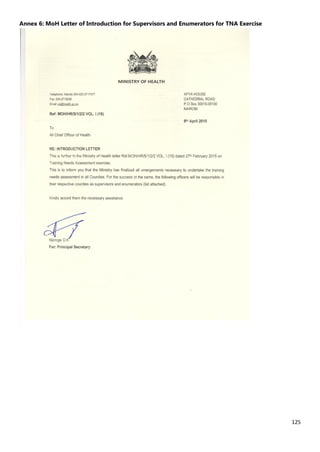
Wireless Internet/Wifi
Skills Lab
Others (please specify)
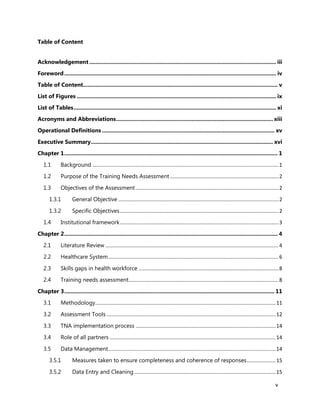
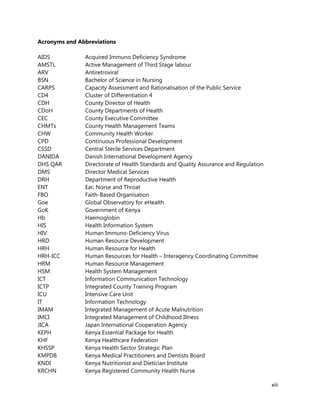
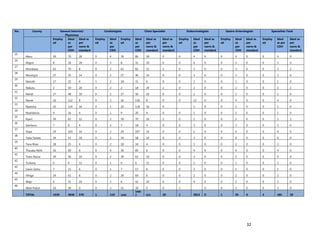
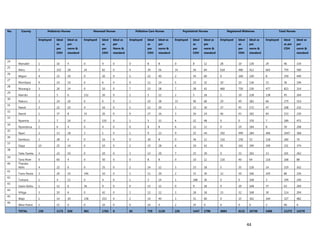
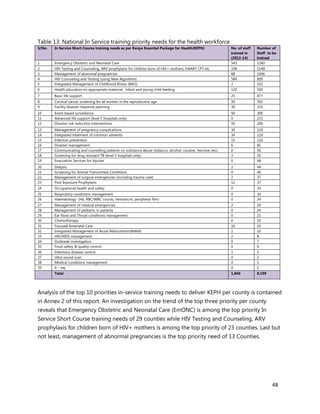
10. [A13] What equipment, teaching aids and resources do you have that can be utilized while facilitating
trainings for health workers in your location (County/Health Facility etc.)?
TYPE OF EQUIPMENT AND TITLE OF REFERENCE
MATERIALS
NUMBER AVAILABLE (ONLY COUNT EQUIPMENT THAT IS
FUNCTIONAL & AVAILABLE FOR TRAINING)
a. Whiteboard
b. Computer (Desktop)
c. Computer (Laptop)
d. Demonstration equipment-e.g. Complete
package for Mankins for EmONC, FP etc
e. Flip chart stands
f. Over head projector
g. Other (please specify)
11. [A14] Is there any additional information you would want us to know in regard to training in your
county/Health facility?
______________________________________________________________________________
______________________________________________________________________________
______________________________________________________________________________](https://image.slidesharecdn.com/0f497df0-745d-4e0e-8fdd-4578098f62fe-160729035643/85/MoH-Training-Needs-Assessment-Report-August-2015-150-320.jpg)
![130
Annex 8: Training Needs Assessment (TNA): MOH Technical Departmental and Divisional
Name of Interviewer: ________________________________ Date: ________________
Tool code: DD#_________ Name of Respondent: _____________________________
[A3] County Code: ________
[A4] Ownership/Type of organization: Public Private Faith Based Other (check as appropriate)
12. [A5] The following are some of the key service delivery and training need areas. Please put an “X” by the
top five for which you think training is most critically needed by service providers to improve service
delivery in Kenya.
KEY TRAINING AREA CRITICAL?
“X”=YES,
BLANK
=NOT AT
THIS TIME.
KEY TRAINING AREA CRITICAL?
“X”=YES,
BLANK =NOT
AT THIS
TIME.
HIV/AIDS Family planning
PMTCT Long acting & Reversible methods of Family
Planning
Pediatric HIV care Cervical Cancer Screening
Adult ART Sexual Gender Based violence(SGBV)
HIV Counseling and Testing using New
Algorithm
Malaria Case Management
Pediatric Tuberculosis(TB) Integrated Commodity Management(HIV,FP,
etc)
The Harmonized HIV Curriculum
TB Management (Microscopy) M&E – use of MOH tools for monitoring
MDR TB Management Leadership and Management
Nutrition and HIV&TB Supportive supervision
MNCH Effective communication and giving feedback
Focused Antenatal Care (FANC) Budgeting and budget control
Emergency Maternal Obstetric and
Neonatal Care(EmONC)
Hospital Administration
Newborn Care Human Resource management
Maternal Infant and young child feeding
(MIYCF)
Others: Please specify
Integrated Management of Childhood
Illness (IMCI)
Integrated Management of Acute
Malnutrition(IMAM)
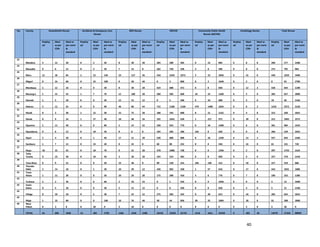
13. [A7] For each of the priority areas, please indicate the number of service providers that have been trained
in the last 12 months and how many more needs to be trained in the next 24 months( 2years)
PRIORITY AREA NUMBER
TRAINED IN
LAST 12
MONTHS
PLEASE INDICATE
COUNTIES FROM IN
THE LAST 12
MONTHS
NUMBERS THAT
NEED TO BE
TRAINED IN THE
NEXT 24 MONTHS
PLEASE
INDICATE
COUNTIES
FOR NEXT 24
MONTHS](https://image.slidesharecdn.com/0f497df0-745d-4e0e-8fdd-4578098f62fe-160729035643/85/MoH-Training-Needs-Assessment-Report-August-2015-151-320.jpg)
![131
Priority Area #1
(Description)
Priority Area #2
(Description)
Priority Area #3
(Description)
Priority Area #4
(Description)
Priority Area #5
(Description)
14. [A18] For each of these priority areas, how many trainers of trainers (TOTS) have you trained and updated
in the last 24 months (Also obtain a list)
PRIORITY AREA # OF TOTS BY LOCATION
County
____
County
____
County
____
County
____
County
____
County
____
County
____
County
____
Priority Area #1
(Description)
Priority Area #2
(Description)
Priority Area #3
(Description)
Priority Area #4
(Description)
Priority Area #5
(Description)
15. [A8] How do you usually support training for health workers in the key priority areas?
Training budget provided through the Ministry of Health-GOK
Separate training budget provided by our organization/Division
Health workers pay for their own training
Donor funding (please provide name:………………………
Other (please specify)………………………….
16. [A12] Where do you provide the trainings you support?
MOH facility nearby (please name: _____________________________)
In-house training room/facility
Hotel
Other training facility (please name: _____________________________)
17. [A19] In which Counties in Kenya does the department/division have other training centers/facilities?
COUNTY # OF
FACILITIES
TOWN WHERE FACILITIES ARE LOCATED
(PLEASE LIST)
TOTAL CAPACITY OF
FACILITIES (# OF
PEOPLE THAT CAN BE
TRAINED AT ONE
TIME)](https://image.slidesharecdn.com/0f497df0-745d-4e0e-8fdd-4578098f62fe-160729035643/85/MoH-Training-Needs-Assessment-Report-August-2015-152-320.jpg)
![132
18. [A13] Has your department/Division offered some of your trainings via eLearning to service providers?
Yes No. If yes which ones?.......................................
19. Do you have a functional Training Database and available in the division and outside the division? Yes
No.
If Yes, Which one, please select as may apply; TRAINSMART iHRIS Others, Please
specify………………….
20. Do you have working collaboration with Training institutions and Universities (Local/International) in
regard to integrating some of your in-service courses to pre-service curriculum?
Yes No
If Yes, Which ones?............................. and Name type of collaboration:
Curriculum Development Faculty Development Content conversion to eLeaning
Others: please specify………………………………….
21. [A17] Is there any additional information you would want us to know?
______________________________________________________________________________
______________________________________________________________________________
______________________________________________________________________________
______________________________________________________________________________](https://image.slidesharecdn.com/0f497df0-745d-4e0e-8fdd-4578098f62fe-160729035643/85/MoH-Training-Needs-Assessment-Report-August-2015-153-320.jpg)
![133
Annex 9: Questionnaire for Service Provider working in County Referral Hospital, Sub-county and
Health facility
Name of Interviewer: ________________________________ Date: ___________________
Tool code: PM_________ Name of Respondent: _________________________________
[A1] Code of Facility: _________ [A2] County Code: _________
[A3] Ownership of facility: Public Private Faith based other (check as appropriate)
(A4) What section of the Hospital are you working (Please check all that apply)
OPD Maternity in-patient Casualty/accident and Emergency Comprehensive care centre Operating
theatre Pharmacy Lab & Blood Bank Radiology Orthopedics Ophthalmology Dental Pediatrics
Health Records Physiotherapy Medical Engineering & Maintenance Public Health Others: Please
Specify…………….
2. [A4] What is your cadre?( please check in the table below)
CADRE ( )
A .Physicians
I. General Practitioners(GP)
II. Anesthetics
III. Pharmacists
IV. Neurosurgeons
V. Obstetrics &Gynecologist
VI. Ophthalmologist
VII. Pediatricians
VIII. Dentists
IX. Renal Specialists/urologists
X. Pathologist
XI. Psychiatrists
XII. Radiologist
XIII. Oncologists
XIV. Chest specialist
XV. Dermatologists
a. Nurses
b. Medical Lab Technologists/Technicians
c. Clinical Officers (CO)
d. Pharm. Techs.
e. Public Health/Environmental Health
Officers/Technicians
f. Nutritionists
g. Health Records Information Officers/technicians
h. Others (Please specify)
22. [A5] The following are some of the key service delivery and training need areas. Please put an “X” by the
top five for which you think training is most critically needed by you in your service delivery point in your
facility
KEY TRAINING AREA CRITICAL? KEY TRAINING AREA CRITICAL?](https://image.slidesharecdn.com/0f497df0-745d-4e0e-8fdd-4578098f62fe-160729035643/85/MoH-Training-Needs-Assessment-Report-August-2015-154-320.jpg)
![134
“X”=YES,
BLANK =NOT
AT THIS
TIME.
“X”=YES,
BLANK =NOT AT
THIS TIME.
HIV/AIDS Family planning
PMTCT Long acting & Reversible methods of Family
Planning
Pediatric HIV care Cervical Cancer Screening
Adult ART Sexual Gender Based violence(SGBV)
HIV Counseling and
Testing using New
Algorithm
Malaria Case Management
Pediatric
Tuberculosis(TB)
Integrated Commodity
Management(HIV,FP, etc)
TB Management
(Microscopy)
M&E – use of MOH tools for monitoring
MDR TB Management Leadership and Management
Nutrition and HIV&TB Supportive supervision
MNCH Effective communication and giving
feedback
Focused Antenatal Care
(FANC)
Budgeting and budget control
Emergency Maternal
Obstetric and Neonatal
Care(EmONC)
Hospital Administration
Newborn Care Human Resource management
Maternal Infant and
young child feeding
(MIYCF)
Others: Please specify
Integrated Management
of Childhood Illness
(IMCI)
Integrated Management
of Acute
Malnutrition(IMAM)
23. [A5] The following are some of the key service delivery and training need areas. Please put an “X” by the
top five for which you think training is most critically needed by you in your service delivery point in your
facility
KEY TRAINING AREA CRITICAL?
“X”=YES,
BLANK =NOT
AT THIS
TIME.
KEY TRAINING AREA CRITICAL?
“X”=YES,
BLANK =NOT AT
THIS TIME.
HIV/AIDS Family planning
PMTCT Long acting & Reversible methods of Family
Planning
Pediatric HIV care Cervical Cancer Screening
Adult ART Sexual Gender Based violence(SGBV)
HIV Counseling and
Testing using New
Algorithm
Malaria Case Management
Pediatric
Tuberculosis(TB)
Integrated Commodity
Management(HIV,FP, etc)
TB Management
(Microscopy)
M&E – use of MOH tools for monitoring
MDR TB Management Leadership and Management
Nutrition and HIV&TB Supportive supervision
MNCH Effective communication and giving
feedback
Focused Antenatal Care Budgeting and budget control](https://image.slidesharecdn.com/0f497df0-745d-4e0e-8fdd-4578098f62fe-160729035643/85/MoH-Training-Needs-Assessment-Report-August-2015-155-320.jpg)
![135
(FANC)
Emergency Maternal
Obstetric and Neonatal
Care(EmONC)
Hospital Administration
Newborn Care Human Resource management
Maternal Infant and
young child feeding
(MIYCF)
Others: Please specify
Integrated Management
of Childhood Illness
(IMCI)
Integrated Management
of Acute
Malnutrition(IMAM)
24. [A4] The following are some of the key service delivery and training need areas. Please put an “X” to
training(s) you have undertaken in the last 24 months as part of building your capacity to effective service
delivery.
KEY TRAINING AREA “X”=YES,
BLANK =NO
TRAINING
KEY TRAINING AREA “X”=YES,
BLANK =NO
TRAINING
HIV/AIDS Family planning
PMTCT Long acting & Reversible methods of
Family Planning
Pediatric HIV care Cervical Cancer Screening
Adult ART Sexual Gender Based violence(SGBV)
HIV Counseling and Testing
using New Algorithm
Malaria Case Management
Pediatric Tuberculosis(TB) Integrated Commodity Management
(HIV, FP, etc)
TB Management
(Microscopy)
M&E – use of MOH tools for monitoring
MDR TB Management Leadership and Management
Nutrition and HIV&TB Supportive supervision
MNCH Effective communication and giving
feedback
Focused Antenatal Care
(FANC)
Budgeting and budget control
Emergency Maternal
Obstetric and Neonatal
Care(EmONC)
Hospital Administration
Newborn Care Human Resource management
Maternal Infant and young
child feeding (MIYCF)
Others: Please specify
Integrated Management of
Childhood Illness (IMCI)
Integrated Management of
Acute Malnutrition (IMAM)
25. [A7] Who usually provides training for your? (please check all that apply)
MOH Trainers Trainers from our own staff
Training Institutions Consulting Firms
National Organizations (NASCOP, etc.) Other (please specify in the space below)___________________
26. [A8] How do you usually pay for your training?
Training budget provided through the Ministry of Health
Separate training budget provided by our organization/facility
Staff pays for their own training](https://image.slidesharecdn.com/0f497df0-745d-4e0e-8fdd-4578098f62fe-160729035643/85/MoH-Training-Needs-Assessment-Report-August-2015-156-320.jpg)
![136
Donor funding (please provide name:………………………
Other (please specify)………………………….
27. [A9] Do you have a robust (well structured, coordinated, on schedule and well attended) Continuous
medical education (CME) run in your county/facility?
Yes No
28. [A10] Are you aware of a functional training committee in your health facility that coordinates training of
health workers in regard to identifying training needs, nominating staff for training and providing post
training follow up as required?
Yes No
29. [A11] Where do you attend training provide to you ?
MOH facility nearby (please name: _____________________________)
In-house training room/facility
Hotel
Other training facility (please name: _____________________________)
30. [A12] Do you have access to the following facilities for training at your facility?
COMPONENT YES/NO WHAT IS THE QUALITY/CONDITION OF THE
EQUIPMENT/SERVICE? (4= EXCELLENT. 3= GOOD,
2=FAIR, 1=POOR)
Wired Internet
Wireless Internet/Wifi
Skills Lab
Others (please specify)
31. [A13] What equipment, teaching aids and resources do you have access to for learning in your facility?
TYPE OF EQUIPMENT AND TITLE OF REFERENCE
MATERIALS
NUMBER AVAILABLE (ONLY COUNT EQUIPMENT THAT IS
FUNCTIONAL & AVAILABLE FOR TRAINING)
a. Whiteboard
b. Computer (Desktop)
c. Computer (Laptop)
d. Demonstration equipment-e.g. Complete
package for Mankins for EmONC, Family
planning etc
e. Flip chart stands
f. Over head projector/LCD
g. Other (please specify)
32. [A14] Is there any additional information you would want us to know in regard to your training that leads
to improved service delivery ?
_________________________________________________________________________________](https://image.slidesharecdn.com/0f497df0-745d-4e0e-8fdd-4578098f62fe-160729035643/85/MoH-Training-Needs-Assessment-Report-August-2015-157-320.jpg)
![137
Annex 10: Training Needs Assessment (TNA) for Regulatory Authorities
Name of Interviewer: ________________________________ Date: ___________________
Tool code: RA_________ Name of Respondent: _________________________________
County Code: ___________
[B1] Please check the regulatory body?
Kenya Medical Practitioners and Dentists Board (KMPDB)
Nursing Council of Kenya (NCK)
Kenya Pharmacy and Poisons Board (KPPB)
Kenya Medical Laboratory and Technicians Board (KMLTTB)
Kenya Clinical Officers Council (COC)
Kenya Nutritionist and Dietician Council (KNDC)
1. [A1] How many members do you have from the following cadres including specialists?
CADRE NUMBER
A .Physicians
I. General Practitioners(GP)
II. Anesthetics
III. Pharmacists
IV. Neurosurgeons
V. Obstetrics &Gynecologist
VI. Ophthalmologist
VII. Pediatricians
VIII. Dentists
IX. Renal Specialists/urologists
X. Pathologist
XI. Psychiatrists
XII. Radiologist
XIII. Oncologists
XIV. Chest specialist
XV. Dermatologists
2. [A2] In the last one year, how many of your professional members attained training standards for re-
license and were thus re-licensed (please fill in the appropriate column in the table below)
CADRE NUMBER PERCENTAGE OF TOTAL
REGISTERED MEMBERS
a. Medical Officers (MO)
b. Nurses
c. Medical Lab Technologists/Technicians
d. Clinical Officers (CO)
e. Pharmacists/Pharm. Techs.
f. Public Health/Environmental Health
Officers/Technicians
g. Nutritionists
h. Health Record Information Officers
i. Others (Please specify)
3. [A23] Please describe the type of performance needs assessment the regulatory body conducts to determine
what training health workers need.
_________________________________________________________________________________
_________________________________________________________________________________](https://image.slidesharecdn.com/0f497df0-745d-4e0e-8fdd-4578098f62fe-160729035643/85/MoH-Training-Needs-Assessment-Report-August-2015-158-320.jpg)
![138
4. [A24] Do you have any performance needs assessment tools that you can share with us?
Yes No
5. [A25] What post training support do you provide to in-service trainees (please check as appropriate)?
a. Follow up by trainers (mentoring, coaching, etc.) Yes No
b. Sending of updates/manuals Yes No
c. website where learners can get more information Yes No
d. Other (please specify)
___________________________________________________________________________
6. [A26] In your opinion, how effective is the level of post-training support you provide to in-service health
workers?
Not at all effective somewhat effective Very effective
7. [A27] What type of post training support do you provide to training institutions?
_____________________________________________________________________________________
_____________________________________________________________________________________
8. [A28] In your opinion, how effective is the level of post-training support you provide to training
institutions?
Not at all effective somewhat effective Very effective
9. [A30] What methods of evaluation do you utilize to determine the effectiveness of training?
_____________________________________________________________________________________
_____________________________________________________________________________________
10. [A17] Is there any additional informational you would like us to know?
_____________________________________________________________________________________
_____________________________________________________________________________________](https://image.slidesharecdn.com/0f497df0-745d-4e0e-8fdd-4578098f62fe-160729035643/85/MoH-Training-Needs-Assessment-Report-August-2015-159-320.jpg)