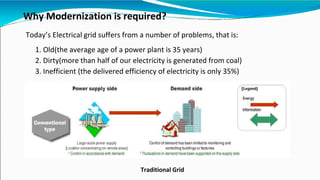
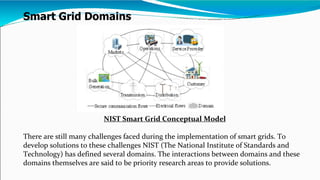
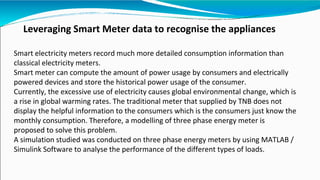
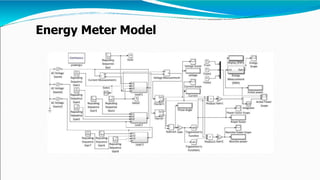
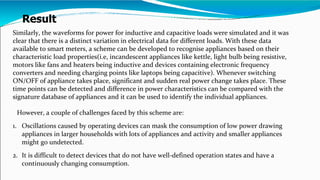
MODERN SMART GRIDS AND
LEVERAGING SMART METER DATA TO
RECOGNISE APPLIANCES
Objectives
1. Study of smart grid, which has gained relevance in the past decade as a solution to a
myriad of issues.
2. To propose a scheme that leverages metering data by automatically analysing the
recorded consumption information which provides users with an appliance-specific
consumption breakdown.
Why Modernization is required?
Today’s Electrical grid suffers from a number of problems, that is:
1. Old(the average age of a power plant is 35 years)
2. Dirty(more than half of our electricity is generated from coal)
3. Inefficient (the delivered efficiency of electricity is only 35%)
Traditional Grid
What is Smart Grid?
Smart grid
A smart grid is an electricity network based on digital technology that
is used to supply electricity to consumers via two-way digital
communication. This system allows for monitoring, analysis, control
and communication within the supply chain to help improve
efficiency, reduce energy consumption and cost, and maximize the
transparency and reliability of the energy supply chain.
Key Features of Smart Grid
•Load Handling: The sum/total of the power grid load is not stable
and it varies over time. In case of heavy load, a smart grid system
can advise consumers to temporarily minimize energy consumption.
•Demand Response Support: Provides users with an automated way
to reduce their electricity bills by guiding them into using electronic
devices according to rates and power consumption.
•Decentralization of Power Generation: A distributed or decentralized
grid system allows the individual user to generate onsite power by
employing any appropriate method at his or her discretion.
Components of Smart Grid
Smart Meter
Recognises and details the electrical consumption.
Relays information to central monitoring station.
Power outage notification and power quality monitoring.
Controller
Measure AC current waveforms which help in power quality monitoring by smart meter.
Sends information to central control station for better management.
Zigbee
-Uses IEEE802.15.4
-Low energy
-Fast start up time
-Mesh topology connection
Used for two way information transfer
Distributed Generation
Allow the connection of small scale renewable generation - Solar, wind, fuel cells etc.
Generation close to loads, improving efficiency.
Overview of Smart Grid Projects in India
Merits and Demerits of Smart Grid
Merits
• The production, installation and work,
maintenance of smart grid and
components of the smart grid bring
new jobs to the people and hence it
works for the economic development.
• Reduces the cost of blackouts.
• Helps businesses to reduce their carbon
footprint.
• Helps measure and reduce energy
consumptions and cost.
Demerits
• Expensive for consumers.
• There is a small chance of meter getting
hacked
• Advanced sensors are required.
• Not simply a single component and
contains various technology
components whose maintenance can
be difficult.
Smart Grid Domains
NIST Smart Grid Conceptual Model
There are still many challenges faced during the implementation of smart grids. To
develop solutions to these challenges NIST (The National Institute of Standards and
Technology) has defined several domains. The interactions between domains and these
domains themselves are said to be priority research areas to provide solutions.
Smart Grid Domains
Generation:
• Co-existence of various types of renewable and non-renewable generating technologies, such as coal,
hydro, nuclear, solar, biomass, geothermal, etc should be maintained.
• System operator has to coordinate the operation of the generation plants, and ensure the stable and
secure operation of the system
Transmission:
• Energy-efficient transmission network will carry the power from the bulk generation facilities to the
power distribution systems.
• The transmission network needs to be monitored in real-time, and protected against any potential
disturbance.
• The power flow and voltage on the lines need to be controlled in order to maintain stable and secure
operation of the system.
Distribution:
• Automated distribution will be the key enablers for smart distribution systems.
• Information exchange between the distribution system operator and the customers for better operation
of the distribution system should be feature of the smart distribution systems.
Customers:
• Customers can be classified into three main categories: residential, commercial, and industrial.
• Building of home automation system will monitor and control the power consumption at the consumer
premises in an intelligent way.
• Proper communication infrastructure will be required for the consumers to interact with the operators,
distribution systems, and the market.
Operations:
• Smart grid operations require communication interface with the bulk generating facilities, transmission
system, substation automation, distribution automation, consumers, and the market.
Markets:
• Smart grid power market needs to develop, keeping in mind all objectives of the smart grid with pricing
information made available for all time periods to keep customers informed of their consumption and
estimated cost.
Service Providers:
• Various service providers will emerge, as the smart grid business model matures.
• Communication interface with the operator, market, and consumers will be needed for the service
providers.
Leveraging Smart Meter data to recognise the appliances
Smart electricity meters record much more detailed consumption information than
classical electricity meters.
Smart meter can compute the amount of power usage by consumers and electrically
powered devices and store the historical power usage of the consumer.
Currently, the excessive use of electricity causes global environmental change, which is
a rise in global warming rates. The traditional meter that supplied by TNB does not
display the helpful information to the consumers which is the consumers just know the
monthly consumption. Therefore, a modelling of three phase energy meter is
proposed to solve this problem.
A simulation studied was conducted on three phase energy meters by using MATLAB /
Simulink Software to analyse the performance of the different types of loads.
Energy Meter Model
For Resistive Load
The first graph shows the comparison of current of the resistances load between 100
ohms until 1000 ohms. The results show that as the resistances increase, the current
decrease. While in the next graph shows the active power for the R load when the
resistances increase, the active power decreased.
Graph in the fig shows that the power factor is unity which is equal to 1. This can be
said that the load used in this system modelling is purely resistive.
Result
Similarly, the waveforms for power for inductive and capacitive loads were simulated and it was
clear that there is a distinct variation in electrical data for different loads. With these data
available to smart meters, a scheme can be developed to recognise appliances based on their
characteristic load properties(i.e, incandescent appliances like kettle, light bulb being resistive,
motors like fans and heaters being inductive and devices containing electronic frequency
converters and needing charging points like laptops being capacitive). Whenever switching
ON/OFF of appliance takes place, significant and sudden real power change takes place. These
time points can be detected and difference in power characteristics can be compared with the
signature database of appliances and it can be used to identify the individual appliances.
However, a couple of challenges faced by this scheme are:
1. Oscillations caused by operating devices can mask the consumption of low power drawing
appliances in larger households with lots of appliances and activity and smaller appliances
might go undetected.
2. It is difficult to detect devices that do not have well-defined operation states and have a
continuously changing consumption.

MODERN SMART GRIDS AND LEVERAGING SMART METER DATA.pptx

  • 1.
    MODERN SMART GRIDSAND LEVERAGING SMART METER DATA TO RECOGNISE APPLIANCES Objectives 1. Study of smart grid, which has gained relevance in the past decade as a solution to a myriad of issues. 2. To propose a scheme that leverages metering data by automatically analysing the recorded consumption information which provides users with an appliance-specific consumption breakdown.
  • 2.
    Why Modernization isrequired? Today’s Electrical grid suffers from a number of problems, that is: 1. Old(the average age of a power plant is 35 years) 2. Dirty(more than half of our electricity is generated from coal) 3. Inefficient (the delivered efficiency of electricity is only 35%) Traditional Grid
  • 3.
    What is SmartGrid? Smart grid A smart grid is an electricity network based on digital technology that is used to supply electricity to consumers via two-way digital communication. This system allows for monitoring, analysis, control and communication within the supply chain to help improve efficiency, reduce energy consumption and cost, and maximize the transparency and reliability of the energy supply chain.
  • 4.
    Key Features ofSmart Grid •Load Handling: The sum/total of the power grid load is not stable and it varies over time. In case of heavy load, a smart grid system can advise consumers to temporarily minimize energy consumption. •Demand Response Support: Provides users with an automated way to reduce their electricity bills by guiding them into using electronic devices according to rates and power consumption. •Decentralization of Power Generation: A distributed or decentralized grid system allows the individual user to generate onsite power by employing any appropriate method at his or her discretion.
  • 5.
  • 6.
    Components of SmartGrid Smart Meter Recognises and details the electrical consumption. Relays information to central monitoring station. Power outage notification and power quality monitoring. Controller Measure AC current waveforms which help in power quality monitoring by smart meter. Sends information to central control station for better management. Zigbee -Uses IEEE802.15.4 -Low energy -Fast start up time -Mesh topology connection Used for two way information transfer Distributed Generation Allow the connection of small scale renewable generation - Solar, wind, fuel cells etc. Generation close to loads, improving efficiency.
  • 7.
    Overview of SmartGrid Projects in India
  • 8.
    Merits and Demeritsof Smart Grid Merits • The production, installation and work, maintenance of smart grid and components of the smart grid bring new jobs to the people and hence it works for the economic development. • Reduces the cost of blackouts. • Helps businesses to reduce their carbon footprint. • Helps measure and reduce energy consumptions and cost. Demerits • Expensive for consumers. • There is a small chance of meter getting hacked • Advanced sensors are required. • Not simply a single component and contains various technology components whose maintenance can be difficult.
  • 9.
    Smart Grid Domains NISTSmart Grid Conceptual Model There are still many challenges faced during the implementation of smart grids. To develop solutions to these challenges NIST (The National Institute of Standards and Technology) has defined several domains. The interactions between domains and these domains themselves are said to be priority research areas to provide solutions.
  • 10.
    Smart Grid Domains Generation: •Co-existence of various types of renewable and non-renewable generating technologies, such as coal, hydro, nuclear, solar, biomass, geothermal, etc should be maintained. • System operator has to coordinate the operation of the generation plants, and ensure the stable and secure operation of the system Transmission: • Energy-efficient transmission network will carry the power from the bulk generation facilities to the power distribution systems. • The transmission network needs to be monitored in real-time, and protected against any potential disturbance. • The power flow and voltage on the lines need to be controlled in order to maintain stable and secure operation of the system. Distribution: • Automated distribution will be the key enablers for smart distribution systems. • Information exchange between the distribution system operator and the customers for better operation of the distribution system should be feature of the smart distribution systems.
  • 11.
    Customers: • Customers canbe classified into three main categories: residential, commercial, and industrial. • Building of home automation system will monitor and control the power consumption at the consumer premises in an intelligent way. • Proper communication infrastructure will be required for the consumers to interact with the operators, distribution systems, and the market. Operations: • Smart grid operations require communication interface with the bulk generating facilities, transmission system, substation automation, distribution automation, consumers, and the market. Markets: • Smart grid power market needs to develop, keeping in mind all objectives of the smart grid with pricing information made available for all time periods to keep customers informed of their consumption and estimated cost. Service Providers: • Various service providers will emerge, as the smart grid business model matures. • Communication interface with the operator, market, and consumers will be needed for the service providers.
  • 12.
    Leveraging Smart Meterdata to recognise the appliances Smart electricity meters record much more detailed consumption information than classical electricity meters. Smart meter can compute the amount of power usage by consumers and electrically powered devices and store the historical power usage of the consumer. Currently, the excessive use of electricity causes global environmental change, which is a rise in global warming rates. The traditional meter that supplied by TNB does not display the helpful information to the consumers which is the consumers just know the monthly consumption. Therefore, a modelling of three phase energy meter is proposed to solve this problem. A simulation studied was conducted on three phase energy meters by using MATLAB / Simulink Software to analyse the performance of the different types of loads.
  • 13.
  • 14.
  • 15.
    The first graphshows the comparison of current of the resistances load between 100 ohms until 1000 ohms. The results show that as the resistances increase, the current decrease. While in the next graph shows the active power for the R load when the resistances increase, the active power decreased. Graph in the fig shows that the power factor is unity which is equal to 1. This can be said that the load used in this system modelling is purely resistive.
  • 16.
    Result Similarly, the waveformsfor power for inductive and capacitive loads were simulated and it was clear that there is a distinct variation in electrical data for different loads. With these data available to smart meters, a scheme can be developed to recognise appliances based on their characteristic load properties(i.e, incandescent appliances like kettle, light bulb being resistive, motors like fans and heaters being inductive and devices containing electronic frequency converters and needing charging points like laptops being capacitive). Whenever switching ON/OFF of appliance takes place, significant and sudden real power change takes place. These time points can be detected and difference in power characteristics can be compared with the signature database of appliances and it can be used to identify the individual appliances. However, a couple of challenges faced by this scheme are: 1. Oscillations caused by operating devices can mask the consumption of low power drawing appliances in larger households with lots of appliances and activity and smaller appliances might go undetected. 2. It is difficult to detect devices that do not have well-defined operation states and have a continuously changing consumption.