SlideShare a Scribd company logo
1 of 4
Download to read offline
ENHANCED DYNAMIC® 1 MODERATE ACTIVE EQUITY STRATEGY Product Snapshot
Asset Class: United States-Equity
Primary Universe: eVestment US All Cap Core Equity
Marketing Contact: Hal Chappell
Title: Director of Marketing
Phone/Fax: 443-223-0172 / 410-849-3166
Email Address: hal@enhancedinvesting.com
Key Facts Displayed in Product Base Currency - US Dollar (USD)
Primary Capitalization: All Cap
Primary Style Emphasis: Other
Preferred Benchmark: S&P United States BMI
Total Product Assets: $0.0
Total Product Accounts: 0
Product Offered As: SA
Investment Focus: Long Only
Asset & Account Information Displayed In Product Base Currency - US Dollar (USD)
Current Totals Assets ($ Million) Accounts
Total in Product $--- ---
Total Taxable $--- ---
Total Tax-Exempt $--- ---
Total Institutional $--- ---
Accounts Gained Number ($ Million) % Product Assets
2017 0 $0.0 0.0 %
2016 0 $0.0 0.0 %
Assets by Vehicle Type Assets ($ Million)
Separate/Segregated Assets $---
Pooled/Commingled Assets $---
Mutual Fund/Institutional Assets $---
Mutual Fund/Retail Assets $---
Assets Lost Number ($ Million) % Product Assets
2017 0 $0.0 0.0 %
2016 0 $0.0 0.0 %
Portfolio Characteristics Displayed In Product Base Currency - US Dollar (USD)
Performance Information Displayed In Vehicle Base Currency - US Dollar (USD)
Track Record (2 Available): USA - SA - Rep Account - ENHANCED DYNAMIC® MODERATE ACTIVE U.S. EQUITY - Gross of Fees Risk Index: S&P United States BMI
Frequency: Monthly Risk-Free Index: Citigroup 3-Month T-Bill
Returns
Trailing Periods Product Benchmark Excess Std Dev Alpha Beta Trk Error Info Ratio Sharpe Ratio
1 Year 28.04 21.18 6.86 4.43 8.80 0.85 3.04 2.26 6.14
2 Year 23.89 16.82 7.08 10.68 2.64 1.22 3.79 1.87 2.18
3 Year 17.24 11.09 6.15 11.77 4.82 1.08 4.14 1.49 1.43
4 Year 16.70 11.44 5.26 11.28 3.90 1.09 3.80 1.38 1.45
5 Year 21.65 15.52 6.13 11.05 4.31 1.08 3.50 1.75 1.94
6 Year 21.68 15.67 6.01 11.01 4.27 1.07 3.24 1.85 1.95
7 Year 19.21 13.47 5.74 12.35 4.19 1.08 3.17 1.81 1.54
8 Year 20.60 13.95 6.64 13.66 4.96 1.08 3.23 2.06 1.49
9 Year 23.19 15.51 7.68 15.25 5.73 1.07 3.65 2.10 1.51
10 Year 16.27 8.66 7.61 17.07 6.87 1.04 4.96 1.53 0.93
Since Inception (1/1996) 21.23 9.30 11.92 16.09 11.28 0.99 5.95 2.00 1.18
Calendar Years MRQ YTD 2016 2015 2014 2013 2012 2011 2010
Product Returns: 6.51 28.04 19.88 4.99 15.08 43.68 21.82 5.39 30.78
Benchmark Returns: 6.33 21.18 12.61 0.47 12.49 33.39 16.44 1.09 17.42
Excess Returns: 0.18 6.86 7.27 4.52 2.58 10.30 5.37 4.30 13.37
Fee Information Displayed In Product Base Currency - US Dollar (USD) Professional Information
Vehicle Type Available Min. Size($ Mil) Minimum Fee
Separate/Segregated --- --- ---
Pooled/Commingled --- --- ---
Mutual Fund --- --- ---
Fees By Acct. Size $25M $50M $75M $100M
Separate/Segregated --- --- --- ---
--- --- --- ---
Pooled/Commingled --- --- --- ---
--- --- --- ---
Mutual Fund --- --- --- ---
--- --- --- ---
Team Description No. Avg. Yrs. Exp. Avg. Yrs. @ Firm
Portfolio Managers: --- --- ---
Research Analysts: --- --- ---
Traders: --- --- ---
Risk Portfolio/Monitoring: --- --- ---
Professional Turnover Port Mgrs. Analysts
Professionals Gained MRQ 0 0
2017 0 0
2016 0 0
Professionals Lost MRQ 0 0
2017 0 0
2016 0 0
Strategy Snapshot
Primary Capitalization: All Cap
Primary Style Emphasis: Other
Preferred Benchmark: S&P United States BMI
Secondary Style Emphasis: ---
Current Number Of Holdings: ---
Foreign Securities Utilized: ---
Approach Towards Currency Hedging: ---
% Hedged Back to Local Currency: ---
% Max Allowed In Emerging Markets: ---
Derivatives Utilized: ---
Available Under Social Restrictions: ---
Fundamental Characteristics
Current Cash Position: ---
Annual Turnover (LTM): ---
Current P/E (12-mo Trailing): ---
Current P/B (12-mo Trailing): ---
Current P/S (12-mo Trailing): ---
Earnings Growth (Past 5 Yrs): ---
Weighted Avg. Mkt Cap (Mil): $0
Median Market Cap (Mil): $0
Market Capitalization Breakdown
>$50 Billion: ---
$15-50 Billion: ---
$7.5-15 Billion: ---
$1.5-7.5 Billion: ---
$750 Million-1.5 Billion: ---
$400 Million-750 Million: ---
<$400 Million: ---
*Note: Performance includes simulated returns from 1/1/1996 to 1/1/2016.
Enhanced Investment Partners LLC December 31, 2017
eVestment Alliance, LLC and its affiliated entities (collectively, “eVestment”) collect information directly from investment management firms and other sources believed to be reliable, however, eVestment does not
guarantee or warrant the accuracy, timeliness, or completeness of the information provided and is not responsible for any errors or omissions. Performance results may be provided with additional disclosures available on
eVestment’s systems and other important considerations such as fees that may be applicable. Not for general distribution and limited distribution may only be made pursuant to client’s agreement terms. * All categories
not necessarily included, Totals may not equal 100%. Copyright 2012-2018 eVestment Alliance, LLC. All Rights Reserved.
ENHANCED DYNAMIC® 1 MODERATE ACTIVE EQUITY STRATEGY Product Trends
Key Facts Displayed in Product Base Currency - US Dollar (USD)
Primary Capitalization: All Cap
Primary Style Emphasis: Other
Preferred Benchmark: S&P United States BMI
Total Product Assets: $0.0
Total Product Accounts: 0
Product Offered As: SA
Investment Focus: Long Only
Asset Class: United States-Equity
Primary Universe: eVestment US All Cap Core Equity
Marketing Contact: Hal Chappell
Title: Director of Marketing
Phone/Fax: 443-223-0172 / 410-849-3166
Email Address: hal@enhancedinvesting.com
Key:
Quartiles
1st
2nd
3rd
4th
Historical Product Assets Displayed In Product Base Currency - US Dollar (USD)
Category 2017 2016 2015 2014 2013
Total $--- $0.0 $--- $--- $---
Institutional $--- $0.0 $--- $--- $---
Taxable $--- $0.0 $--- $--- $---
Tax-Exempt $--- $0.0 $--- $--- $---
Universe Ranking Analysis vs eVestment US All Cap Core Equity Displayed In Vehicle Base Currency - US Dollar (USD)
Annualized Returns (Periods Ending December 31, 2017)
Percentile MRQ YTD 1 Yr 3 Yrs 5 Yrs 7 Yrs 10 Yrs
5th 8.76 29.75 29.75 13.28 18.32 15.61 11.34
25th 6.98 23.90 23.90 11.83 16.28 13.90 9.33
Median 6.13 20.51 20.51 10.09 14.97 12.66 8.56
75th 4.96 16.77 16.77 8.19 12.99 10.97 7.54
95th 2.89 9.35 9.35 4.14 9.42 8.47 5.84
Product 6.51 28.04 28.04 17.24 21.65 19.21 16.27
Rank 43 8 8 1 1 1 1
Calendar Year Returns
2017 2016 2015 2014 2013
Median 20.51 10.59 -0.60 11.28 34.80
Product 28.04 19.88 4.99 15.08 43.68
Rank 8 8 9 18 13
2012 2011 2010 2009 2008
Median 15.53 0.05 16.63 28.65 -36.45
Product 21.82 5.39 30.78 46.07 -30.92
Rank 12 13 2 9 16
Rolling 3-Year Returns (Periods Ending)
12/17 9/17 6/17 3/17 12/16
Median 10.09 9.59 7.90 8.31 7.07
Product 17.24 17.49 14.67 14.50 13.14
Rank 1 1 1 1 1
9/16 6/16 3/16 12/15 9/15
Median 8.86 9.93 10.49 14.40 13.03
Product 14.87 15.17 15.42 20.18 18.87
Rank 1 1 3 2 2
*Note: Performance includes simulated returns from 1/1/1996 to 1/1/2016.
Enhanced Investment Partners LLC December 31, 2017
eVestment Alliance, LLC and its affiliated entities (collectively, “eVestment”) collect information directly from investment management firms and other sources believed to be reliable, however, eVestment does not
guarantee or warrant the accuracy, timeliness, or completeness of the information provided and is not responsible for any errors or omissions. Performance results may be provided with additional disclosures available on
eVestment’s systems and other important considerations such as fees that may be applicable. Not for general distribution and limited distribution may only be made pursuant to client’s agreement terms. * All categories
not necessarily included, Totals may not equal 100%. Copyright 2012-2018 eVestment Alliance, LLC. All Rights Reserved.
ENHANCED DYNAMIC® 1 MODERATE ACTIVE EQUITY STRATEGY Universe Rank
Asset Class: United States-Equity
Primary Universe: eVestment US All Cap Core Equity
Marketing Contact: Hal Chappell
Title: Director of Marketing
Phone/Fax: 443-223-0172 / 410-849-3166
Email Address: hal@enhancedinvesting.com
Key Facts Displayed in Product Base Currency - US Dollar (USD)
Primary Capitalization: All Cap
Primary Style Emphasis: Other
Preferred Benchmark: S&P United States BMI
Total Product Assets: $0.0
Total Product Accounts: 0
Product Offered As: SA
Investment Focus: Long Only
Peer Group Statistics And Ranking vs. eVestment US All Cap Core Equity Displayed In Vehicle Base Currency - US Dollar (USD)
Three Year Statistics vs. eVestment US All Cap Core Equity vs. S&P United States BMI Displayed In Vehicle Base Currency - US Dollar (USD)
*Note: Performance includes simulated returns from 1/1/1996 to 1/1/2016.
Firm/Product
MRQ YTD 1 Yr 3 Yrs 5 Yrs 10 Yrs
Return Rank Return Rank Return Rank Return Rank Return Rank Return Rank
Enhanced Investment Partners LLC 6.51 43 28.04 8 28.04 8 17.24 1 21.65 1 16.27 1
S&P United States BMI 6.33 47 21.18 48 21.18 48 11.09 34 15.52 41 8.66 46
Universe Median 6.13 --- 20.51 --- 20.51 --- 10.09 --- 14.97 --- 8.56 ---
*Note: Performance includes simulated returns from 1/1/1996 to 1/1/2016.
Information Ratio Sharpe Ratio Annualized Alpha Standard Deviation Batting Average Excess Returns
Median -0.25 0.88 -0.86 10.69 0.47 -1.00
Product 1.49 1.43 4.82 11.77 0.64 6.15
Rank 1 1 1 23 2 1
Enhanced Investment Partners LLC December 31, 2017
eVestment Alliance, LLC and its affiliated entities (collectively, “eVestment”) collect information directly from investment management firms and other sources believed to be reliable, however, eVestment does not
guarantee or warrant the accuracy, timeliness, or completeness of the information provided and is not responsible for any errors or omissions. Performance results may be provided with additional disclosures available on
eVestment’s systems and other important considerations such as fees that may be applicable. Not for general distribution and limited distribution may only be made pursuant to client’s agreement terms. * All categories
not necessarily included, Totals may not equal 100%. Copyright 2012-2018 eVestment Alliance, LLC. All Rights Reserved.
ENHANCED DYNAMIC® 1 MODERATE ACTIVE EQUITY STRATEGY Risk vs. Reward
Asset Class: United States-Equity
Primary Universe: eVestment US All Cap Core Equity
Marketing Contact: Hal Chappell
Title: Director of Marketing
Phone/Fax: 443-223-0172 / 410-849-3166
Email Address: hal@enhancedinvesting.com
Key Facts Displayed in Product Base Currency - US Dollar (USD)
Primary Capitalization: All Cap
Primary Style Emphasis: Other
Preferred Benchmark: S&P United States BMI
Total Product Assets: $0.0
Total Product Accounts: 0
Product Offered As: SA
Investment Focus: Long Only
Risk Vs Reward And Market Capture Analysis: 3 Years vs. eVestment US All Cap Core Equity Displayed In Vehicle Base Currency - US Dollar (USD)
RISK VS REWARD
Returns Standard Deviation
Product 17.24 11.77
Benchmark 11.09 10.23
UP VS DOWN MARKET CAPTURE
Product
Up Market Capture 132.72 # of Up Periods 27
Down Market Capture 98.66 # of Down Periods 9
MARKET CAPTURE ANALYSIS: 3 YEARS
Up Market Capture Down Market Capture
Median 95.37 100.66
Product 132.72 98.66
Rank 3 55
*Note: Performance includes simulated returns from 1/1/1996 to 1/1/2016.
TRACKING ERROR: ROLLING 3-YEAR PERIODS
End Trk Error End Trk Error End Trk Error
4q17 4.14 3q16 3.48 2q15 2.76
3q17 4.15 2q16 3.40 1q15 2.28
2q17 4.05 1q16 3.50 4q14 2.04
1q17 4.10 4q15 3.34 3q14 2.07
4q16 4.06 3q15 2.90 2q14 2.04
Enhanced Investment Partners LLC December 31, 2017
eVestment Alliance, LLC and its affiliated entities (collectively, “eVestment”) collect information directly from investment management firms and other sources believed to be reliable, however, eVestment does not
guarantee or warrant the accuracy, timeliness, or completeness of the information provided and is not responsible for any errors or omissions. Performance results may be provided with additional disclosures available on
eVestment’s systems and other important considerations such as fees that may be applicable. Not for general distribution and limited distribution may only be made pursuant to client’s agreement terms. * All categories
not necessarily included, Totals may not equal 100%. Copyright 2012-2018 eVestment Alliance, LLC. All Rights Reserved.

More Related Content

What's hot

Volaris corporate presentation may 2017
Volaris corporate presentation may 2017Volaris corporate presentation may 2017
Volaris corporate presentation may 2017irvolaris
 
Investor update march 2016 website
Investor update march 2016 websiteInvestor update march 2016 website
Investor update march 2016 websiteinvestor_phillips66
 
Tricumen 4Q17/FY17 wholesale Banking results_open 260218
Tricumen 4Q17/FY17 wholesale Banking results_open 260218Tricumen 4Q17/FY17 wholesale Banking results_open 260218
Tricumen 4Q17/FY17 wholesale Banking results_open 260218Tricumen Ltd
 
Planning Strategies Q410
Planning Strategies Q410Planning Strategies Q410
Planning Strategies Q410Barry Mendelson
 
Tricumen_3Q16 Wholesale Banking Results Review_OPEN 051216
Tricumen_3Q16 Wholesale Banking Results Review_OPEN 051216Tricumen_3Q16 Wholesale Banking Results Review_OPEN 051216
Tricumen_3Q16 Wholesale Banking Results Review_OPEN 051216Tricumen Ltd
 
Q2 2017 Manitowoc Earnings Conference Call
Q2 2017 Manitowoc Earnings Conference CallQ2 2017 Manitowoc Earnings Conference Call
Q2 2017 Manitowoc Earnings Conference CallManitowocCompany
 
emerson electricl 2009 Annual Investor Conference_Farr
emerson electricl 	2009 Annual Investor Conference_Farremerson electricl 	2009 Annual Investor Conference_Farr
emerson electricl 2009 Annual Investor Conference_Farrfinance12
 
Financial services sector - implications of FOFA, possible acquires of SFW, S...
Financial services sector - implications of FOFA, possible acquires of SFW, S...Financial services sector - implications of FOFA, possible acquires of SFW, S...
Financial services sector - implications of FOFA, possible acquires of SFW, S...George Gabriel
 
Q2 2017 investor deck final
Q2 2017 investor deck finalQ2 2017 investor deck final
Q2 2017 investor deck finalADAESIR
 
Tsn investor presentation september 2017
Tsn investor presentation september 2017Tsn investor presentation september 2017
Tsn investor presentation september 2017investortyson
 
Bajaj Finance Q1FY15: AUM growth remained strong at Rs269.4 bn, buy
Bajaj Finance Q1FY15: AUM growth remained strong at Rs269.4 bn, buyBajaj Finance Q1FY15: AUM growth remained strong at Rs269.4 bn, buy
Bajaj Finance Q1FY15: AUM growth remained strong at Rs269.4 bn, buyIndiaNotes.com
 
Before the Open May 10 2017
Before the Open May 10 2017Before the Open May 10 2017
Before the Open May 10 2017John Pendrith
 

What's hot (20)

Long Island Iced Tea Cor (OTCQB:LTEA)
Long Island Iced Tea Cor (OTCQB:LTEA)Long Island Iced Tea Cor (OTCQB:LTEA)
Long Island Iced Tea Cor (OTCQB:LTEA)
 
Volaris corporate presentation may 2017
Volaris corporate presentation may 2017Volaris corporate presentation may 2017
Volaris corporate presentation may 2017
 
Investor update march 2016 website
Investor update march 2016 websiteInvestor update march 2016 website
Investor update march 2016 website
 
Tricumen 4Q17/FY17 wholesale Banking results_open 260218
Tricumen 4Q17/FY17 wholesale Banking results_open 260218Tricumen 4Q17/FY17 wholesale Banking results_open 260218
Tricumen 4Q17/FY17 wholesale Banking results_open 260218
 
Planning Strategies Q410
Planning Strategies Q410Planning Strategies Q410
Planning Strategies Q410
 
Tricumen_3Q16 Wholesale Banking Results Review_OPEN 051216
Tricumen_3Q16 Wholesale Banking Results Review_OPEN 051216Tricumen_3Q16 Wholesale Banking Results Review_OPEN 051216
Tricumen_3Q16 Wholesale Banking Results Review_OPEN 051216
 
Q2 2017 Manitowoc Earnings Conference Call
Q2 2017 Manitowoc Earnings Conference CallQ2 2017 Manitowoc Earnings Conference Call
Q2 2017 Manitowoc Earnings Conference Call
 
Sack Lunch Productions (OTC:SAKL)
Sack Lunch Productions (OTC:SAKL)Sack Lunch Productions (OTC:SAKL)
Sack Lunch Productions (OTC:SAKL)
 
emerson electricl 2009 Annual Investor Conference_Farr
emerson electricl 	2009 Annual Investor Conference_Farremerson electricl 	2009 Annual Investor Conference_Farr
emerson electricl 2009 Annual Investor Conference_Farr
 
Financial services sector - implications of FOFA, possible acquires of SFW, S...
Financial services sector - implications of FOFA, possible acquires of SFW, S...Financial services sector - implications of FOFA, possible acquires of SFW, S...
Financial services sector - implications of FOFA, possible acquires of SFW, S...
 
BCI Senate Group presentation
BCI Senate Group presentationBCI Senate Group presentation
BCI Senate Group presentation
 
Q2 2017 investor deck final
Q2 2017 investor deck finalQ2 2017 investor deck final
Q2 2017 investor deck final
 
Tsn investor presentation september 2017
Tsn investor presentation september 2017Tsn investor presentation september 2017
Tsn investor presentation september 2017
 
John Kamm, Financial Advisor
John Kamm, Financial AdvisorJohn Kamm, Financial Advisor
John Kamm, Financial Advisor
 
2 q17 earnings presentation
2 q17 earnings presentation2 q17 earnings presentation
2 q17 earnings presentation
 
Nielsen Q2 2016 Results
Nielsen Q2 2016 ResultsNielsen Q2 2016 Results
Nielsen Q2 2016 Results
 
Bajaj Finance Q1FY15: AUM growth remained strong at Rs269.4 bn, buy
Bajaj Finance Q1FY15: AUM growth remained strong at Rs269.4 bn, buyBajaj Finance Q1FY15: AUM growth remained strong at Rs269.4 bn, buy
Bajaj Finance Q1FY15: AUM growth remained strong at Rs269.4 bn, buy
 
2 q 2017 operating results final
2 q 2017 operating results final2 q 2017 operating results final
2 q 2017 operating results final
 
Investor Presentation - June 2013
Investor Presentation - June 2013Investor Presentation - June 2013
Investor Presentation - June 2013
 
Before the Open May 10 2017
Before the Open May 10 2017Before the Open May 10 2017
Before the Open May 10 2017
 

Similar to Moderate Active Strategy Snapshot Report 20171231 on 20180226 Gross 4 p ev

Procter and Gamble Financial Report
Procter and Gamble Financial ReportProcter and Gamble Financial Report
Procter and Gamble Financial ReportElisa Reyes
 
Financial statement or ratio analysis
Financial statement  or ratio  analysisFinancial statement  or ratio  analysis
Financial statement or ratio analysisAmeenababs
 
Q4 2016 - Management Investor Presentation
Q4 2016 - Management Investor PresentationQ4 2016 - Management Investor Presentation
Q4 2016 - Management Investor PresentationRioCan
 
ComparisonInvestment$ 100,000.00Shares1,84820132014201520162017F.docx
ComparisonInvestment$   100,000.00Shares1,84820132014201520162017F.docxComparisonInvestment$   100,000.00Shares1,84820132014201520162017F.docx
ComparisonInvestment$ 100,000.00Shares1,84820132014201520162017F.docxdonnajames55
 
P&g presentation
P&g presentationP&g presentation
P&g presentationElisa Reyes
 
[Type text][Type text][Type text]Part 1 Native American’s.docx
[Type text][Type text][Type text]Part 1 Native American’s.docx[Type text][Type text][Type text]Part 1 Native American’s.docx
[Type text][Type text][Type text]Part 1 Native American’s.docxgerardkortney
 
Q4 2017 earnings slides
Q4 2017 earnings slidesQ4 2017 earnings slides
Q4 2017 earnings slidesmolsoncoorsir
 
ENHANCED DYNAMIC® 1 MODERATE ACTIVE EQUITY
ENHANCED DYNAMIC® 1 MODERATE ACTIVE EQUITYENHANCED DYNAMIC® 1 MODERATE ACTIVE EQUITY
ENHANCED DYNAMIC® 1 MODERATE ACTIVE EQUITYChristy Vailoces
 
Released Nov.16 2016 - Fundamental Research Corp. eXp World Holdings, Inc. (O...
Released Nov.16 2016 - Fundamental Research Corp. eXp World Holdings, Inc. (O...Released Nov.16 2016 - Fundamental Research Corp. eXp World Holdings, Inc. (O...
Released Nov.16 2016 - Fundamental Research Corp. eXp World Holdings, Inc. (O...Follow me on Twitter @Stockshaman
 
2 Enhanced Dynamic 1 Moderate Active Strategy Investment Performance Report 2...
2 Enhanced Dynamic 1 Moderate Active Strategy Investment Performance Report 2...2 Enhanced Dynamic 1 Moderate Active Strategy Investment Performance Report 2...
2 Enhanced Dynamic 1 Moderate Active Strategy Investment Performance Report 2...Christy Vailoces
 
Enhanced Dynamic 1 Moderate Active Strategy Investment Performance Report 201...
Enhanced Dynamic 1 Moderate Active Strategy Investment Performance Report 201...Enhanced Dynamic 1 Moderate Active Strategy Investment Performance Report 201...
Enhanced Dynamic 1 Moderate Active Strategy Investment Performance Report 201...Christy Vailoces
 
Hong Kong Stock Research. What Drives Hong Kong Stock Price Out Performance. ...
Hong Kong Stock Research. What Drives Hong Kong Stock Price Out Performance. ...Hong Kong Stock Research. What Drives Hong Kong Stock Price Out Performance. ...
Hong Kong Stock Research. What Drives Hong Kong Stock Price Out Performance. ...lvxresearch
 
Ifc investor presentation (march 6 2017)
Ifc investor presentation (march 6 2017)Ifc investor presentation (march 6 2017)
Ifc investor presentation (march 6 2017)Intact
 
Financial Analysis
Financial AnalysisFinancial Analysis
Financial AnalysisAmber White
 
Trnc q1 17-earnings_presslides_draft_vf
Trnc q1 17-earnings_presslides_draft_vfTrnc q1 17-earnings_presslides_draft_vf
Trnc q1 17-earnings_presslides_draft_vftribuneIR
 
Credit Suisse Industrial and Environmental Services Conference 2013
Credit Suisse Industrial and Environmental Services Conference 2013Credit Suisse Industrial and Environmental Services Conference 2013
Credit Suisse Industrial and Environmental Services Conference 2013ProgressiveWaste
 
Enhanced Dynamic* Moderate Active with S & P index
Enhanced Dynamic* Moderate  Active with S & P indexEnhanced Dynamic* Moderate  Active with S & P index
Enhanced Dynamic* Moderate Active with S & P indexChristy Vailoces
 

Similar to Moderate Active Strategy Snapshot Report 20171231 on 20180226 Gross 4 p ev (20)

Procter and Gamble Financial Report
Procter and Gamble Financial ReportProcter and Gamble Financial Report
Procter and Gamble Financial Report
 
Financial statement or ratio analysis
Financial statement  or ratio  analysisFinancial statement  or ratio  analysis
Financial statement or ratio analysis
 
Q4 2016 - Management Investor Presentation
Q4 2016 - Management Investor PresentationQ4 2016 - Management Investor Presentation
Q4 2016 - Management Investor Presentation
 
IFM - optionality
IFM - optionality IFM - optionality
IFM - optionality
 
ComparisonInvestment$ 100,000.00Shares1,84820132014201520162017F.docx
ComparisonInvestment$   100,000.00Shares1,84820132014201520162017F.docxComparisonInvestment$   100,000.00Shares1,84820132014201520162017F.docx
ComparisonInvestment$ 100,000.00Shares1,84820132014201520162017F.docx
 
P&g presentation
P&g presentationP&g presentation
P&g presentation
 
[Type text][Type text][Type text]Part 1 Native American’s.docx
[Type text][Type text][Type text]Part 1 Native American’s.docx[Type text][Type text][Type text]Part 1 Native American’s.docx
[Type text][Type text][Type text]Part 1 Native American’s.docx
 
Q4 2017 earnings slides
Q4 2017 earnings slidesQ4 2017 earnings slides
Q4 2017 earnings slides
 
ENHANCED DYNAMIC® 1 MODERATE ACTIVE EQUITY
ENHANCED DYNAMIC® 1 MODERATE ACTIVE EQUITYENHANCED DYNAMIC® 1 MODERATE ACTIVE EQUITY
ENHANCED DYNAMIC® 1 MODERATE ACTIVE EQUITY
 
Released Nov.16 2016 - Fundamental Research Corp. eXp World Holdings, Inc. (O...
Released Nov.16 2016 - Fundamental Research Corp. eXp World Holdings, Inc. (O...Released Nov.16 2016 - Fundamental Research Corp. eXp World Holdings, Inc. (O...
Released Nov.16 2016 - Fundamental Research Corp. eXp World Holdings, Inc. (O...
 
2 Enhanced Dynamic 1 Moderate Active Strategy Investment Performance Report 2...
2 Enhanced Dynamic 1 Moderate Active Strategy Investment Performance Report 2...2 Enhanced Dynamic 1 Moderate Active Strategy Investment Performance Report 2...
2 Enhanced Dynamic 1 Moderate Active Strategy Investment Performance Report 2...
 
Enhanced Dynamic 1 Moderate Active Strategy Investment Performance Report 201...
Enhanced Dynamic 1 Moderate Active Strategy Investment Performance Report 201...Enhanced Dynamic 1 Moderate Active Strategy Investment Performance Report 201...
Enhanced Dynamic 1 Moderate Active Strategy Investment Performance Report 201...
 
Hong Kong Stock Research. What Drives Hong Kong Stock Price Out Performance. ...
Hong Kong Stock Research. What Drives Hong Kong Stock Price Out Performance. ...Hong Kong Stock Research. What Drives Hong Kong Stock Price Out Performance. ...
Hong Kong Stock Research. What Drives Hong Kong Stock Price Out Performance. ...
 
Ifc investor presentation (march 6 2017)
Ifc investor presentation (march 6 2017)Ifc investor presentation (march 6 2017)
Ifc investor presentation (march 6 2017)
 
Investor Day 2017
Investor Day 2017Investor Day 2017
Investor Day 2017
 
Financial Analysis
Financial AnalysisFinancial Analysis
Financial Analysis
 
Trnc q1 17-earnings_presslides_draft_vf
Trnc q1 17-earnings_presslides_draft_vfTrnc q1 17-earnings_presslides_draft_vf
Trnc q1 17-earnings_presslides_draft_vf
 
Credit Suisse Industrial and Environmental Services Conference 2013
Credit Suisse Industrial and Environmental Services Conference 2013Credit Suisse Industrial and Environmental Services Conference 2013
Credit Suisse Industrial and Environmental Services Conference 2013
 
Anchor capital
Anchor capitalAnchor capital
Anchor capital
 
Enhanced Dynamic* Moderate Active with S & P index
Enhanced Dynamic* Moderate  Active with S & P indexEnhanced Dynamic* Moderate  Active with S & P index
Enhanced Dynamic* Moderate Active with S & P index
 

More from Christy Vailoces

Enhanced Dynamic® Moderate Active Deck
Enhanced Dynamic® Moderate Active DeckEnhanced Dynamic® Moderate Active Deck
Enhanced Dynamic® Moderate Active DeckChristy Vailoces
 
Enhanced Dynamic 5 Maximum Passive S&P Strategy 20170630 on 20170801Performa...
Enhanced Dynamic 5 Maximum Passive S&P Strategy 20170630 on  20170801Performa...Enhanced Dynamic 5 Maximum Passive S&P Strategy 20170630 on  20170801Performa...
Enhanced Dynamic 5 Maximum Passive S&P Strategy 20170630 on 20170801Performa...Christy Vailoces
 
Enhanced Dynamic 3 Moderate Passive S&P Strategy 20170630 on 20170801 Perfor...
Enhanced Dynamic 3 Moderate Passive S&P Strategy 20170630 on  20170801 Perfor...Enhanced Dynamic 3 Moderate Passive S&P Strategy 20170630 on  20170801 Perfor...
Enhanced Dynamic 3 Moderate Passive S&P Strategy 20170630 on 20170801 Perfor...Christy Vailoces
 
Enhanced Dynamic 1 Moderate Active Strategy 20170630 on 20170801 Performance...
Enhanced Dynamic 1 Moderate Active Strategy 20170630 on 20170801  Performance...Enhanced Dynamic 1 Moderate Active Strategy 20170630 on 20170801  Performance...
Enhanced Dynamic 1 Moderate Active Strategy 20170630 on 20170801 Performance...Christy Vailoces
 
AAP PERFORMANCE ANALYSIS EIP EIR EAIP EAIF EVESTMENT UPDATES 19960101 - 2017...
AAP PERFORMANCE ANALYSIS EIP EIR EAIP EAIF EVESTMENT UPDATES  19960101 - 2017...AAP PERFORMANCE ANALYSIS EIP EIR EAIP EAIF EVESTMENT UPDATES  19960101 - 2017...
AAP PERFORMANCE ANALYSIS EIP EIR EAIP EAIF EVESTMENT UPDATES 19960101 - 2017...Christy Vailoces
 
Enhanced Dynamic Moderate Active vs S&amp;P BMI Gross
Enhanced Dynamic Moderate Active  vs S&amp;P BMI  GrossEnhanced Dynamic Moderate Active  vs S&amp;P BMI  Gross
Enhanced Dynamic Moderate Active vs S&amp;P BMI GrossChristy Vailoces
 
Enhanced Dynamic Maximum Russell Indices
Enhanced Dynamic  Maximum Russell IndicesEnhanced Dynamic  Maximum Russell Indices
Enhanced Dynamic Maximum Russell IndicesChristy Vailoces
 
Enhanced Dynamic Maximum S&P Strategy
Enhanced Dynamic Maximum S&P StrategyEnhanced Dynamic Maximum S&P Strategy
Enhanced Dynamic Maximum S&P StrategyChristy Vailoces
 
Enhanced Dynamic 4 Moderate Russell Indices
Enhanced Dynamic 4 Moderate Russell IndicesEnhanced Dynamic 4 Moderate Russell Indices
Enhanced Dynamic 4 Moderate Russell IndicesChristy Vailoces
 
Enhanced Dynamics Moderate S & P Indices
Enhanced Dynamics  Moderate  S & P IndicesEnhanced Dynamics  Moderate  S & P Indices
Enhanced Dynamics Moderate S & P IndicesChristy Vailoces
 
Enhanced Dynamic 2 Moderate Passive Indices with Russell 3000 Index
Enhanced Dynamic 2 Moderate Passive Indices with Russell 3000 IndexEnhanced Dynamic 2 Moderate Passive Indices with Russell 3000 Index
Enhanced Dynamic 2 Moderate Passive Indices with Russell 3000 IndexChristy Vailoces
 

More from Christy Vailoces (12)

Enhanced Dynamic® Moderate Active Deck
Enhanced Dynamic® Moderate Active DeckEnhanced Dynamic® Moderate Active Deck
Enhanced Dynamic® Moderate Active Deck
 
Enhanced Dynamic 5 Maximum Passive S&P Strategy 20170630 on 20170801Performa...
Enhanced Dynamic 5 Maximum Passive S&P Strategy 20170630 on  20170801Performa...Enhanced Dynamic 5 Maximum Passive S&P Strategy 20170630 on  20170801Performa...
Enhanced Dynamic 5 Maximum Passive S&P Strategy 20170630 on 20170801Performa...
 
Enhanced Dynamic 3 Moderate Passive S&P Strategy 20170630 on 20170801 Perfor...
Enhanced Dynamic 3 Moderate Passive S&P Strategy 20170630 on  20170801 Perfor...Enhanced Dynamic 3 Moderate Passive S&P Strategy 20170630 on  20170801 Perfor...
Enhanced Dynamic 3 Moderate Passive S&P Strategy 20170630 on 20170801 Perfor...
 
Enhanced Dynamic 1 Moderate Active Strategy 20170630 on 20170801 Performance...
Enhanced Dynamic 1 Moderate Active Strategy 20170630 on 20170801  Performance...Enhanced Dynamic 1 Moderate Active Strategy 20170630 on 20170801  Performance...
Enhanced Dynamic 1 Moderate Active Strategy 20170630 on 20170801 Performance...
 
Enhanced Dynamic 1 Moderate Active Strategy 20170630 on 20170801 Performance...
Enhanced Dynamic 1 Moderate Active Strategy 20170630 on 20170801  Performance...Enhanced Dynamic 1 Moderate Active Strategy 20170630 on 20170801  Performance...
Enhanced Dynamic 1 Moderate Active Strategy 20170630 on 20170801 Performance...
 
AAP PERFORMANCE ANALYSIS EIP EIR EAIP EAIF EVESTMENT UPDATES 19960101 - 2017...
AAP PERFORMANCE ANALYSIS EIP EIR EAIP EAIF EVESTMENT UPDATES  19960101 - 2017...AAP PERFORMANCE ANALYSIS EIP EIR EAIP EAIF EVESTMENT UPDATES  19960101 - 2017...
AAP PERFORMANCE ANALYSIS EIP EIR EAIP EAIF EVESTMENT UPDATES 19960101 - 2017...
 
Enhanced Dynamic Moderate Active vs S&amp;P BMI Gross
Enhanced Dynamic Moderate Active  vs S&amp;P BMI  GrossEnhanced Dynamic Moderate Active  vs S&amp;P BMI  Gross
Enhanced Dynamic Moderate Active vs S&amp;P BMI Gross
 
Enhanced Dynamic Maximum Russell Indices
Enhanced Dynamic  Maximum Russell IndicesEnhanced Dynamic  Maximum Russell Indices
Enhanced Dynamic Maximum Russell Indices
 
Enhanced Dynamic Maximum S&P Strategy
Enhanced Dynamic Maximum S&P StrategyEnhanced Dynamic Maximum S&P Strategy
Enhanced Dynamic Maximum S&P Strategy
 
Enhanced Dynamic 4 Moderate Russell Indices
Enhanced Dynamic 4 Moderate Russell IndicesEnhanced Dynamic 4 Moderate Russell Indices
Enhanced Dynamic 4 Moderate Russell Indices
 
Enhanced Dynamics Moderate S & P Indices
Enhanced Dynamics  Moderate  S & P IndicesEnhanced Dynamics  Moderate  S & P Indices
Enhanced Dynamics Moderate S & P Indices
 
Enhanced Dynamic 2 Moderate Passive Indices with Russell 3000 Index
Enhanced Dynamic 2 Moderate Passive Indices with Russell 3000 IndexEnhanced Dynamic 2 Moderate Passive Indices with Russell 3000 Index
Enhanced Dynamic 2 Moderate Passive Indices with Russell 3000 Index
 

Recently uploaded

Kala jadu for love marriage | Real amil baba | Famous amil baba | kala jadu n...
Kala jadu for love marriage | Real amil baba | Famous amil baba | kala jadu n...Kala jadu for love marriage | Real amil baba | Famous amil baba | kala jadu n...
Kala jadu for love marriage | Real amil baba | Famous amil baba | kala jadu n...babafaisel
 
VVIP Pune Call Girls Hadapsar (7001035870) Pune Escorts Nearby with Complete ...
VVIP Pune Call Girls Hadapsar (7001035870) Pune Escorts Nearby with Complete ...VVIP Pune Call Girls Hadapsar (7001035870) Pune Escorts Nearby with Complete ...
VVIP Pune Call Girls Hadapsar (7001035870) Pune Escorts Nearby with Complete ...Call Girls in Nagpur High Profile
 
(AISHA) Ambegaon Khurd Call Girls Just Call 7001035870 [ Cash on Delivery ] P...
(AISHA) Ambegaon Khurd Call Girls Just Call 7001035870 [ Cash on Delivery ] P...(AISHA) Ambegaon Khurd Call Girls Just Call 7001035870 [ Cash on Delivery ] P...
(AISHA) Ambegaon Khurd Call Girls Just Call 7001035870 [ Cash on Delivery ] P...ranjana rawat
 
The_Canvas_of_Creative_Mastery_Newsletter_April_2024_Version.pdf
The_Canvas_of_Creative_Mastery_Newsletter_April_2024_Version.pdfThe_Canvas_of_Creative_Mastery_Newsletter_April_2024_Version.pdf
The_Canvas_of_Creative_Mastery_Newsletter_April_2024_Version.pdfAmirYakdi
 
call girls in Dakshinpuri (DELHI) 🔝 >༒9953056974 🔝 genuine Escort Service 🔝✔️✔️
call girls in Dakshinpuri  (DELHI) 🔝 >༒9953056974 🔝 genuine Escort Service 🔝✔️✔️call girls in Dakshinpuri  (DELHI) 🔝 >༒9953056974 🔝 genuine Escort Service 🔝✔️✔️
call girls in Dakshinpuri (DELHI) 🔝 >༒9953056974 🔝 genuine Escort Service 🔝✔️✔️9953056974 Low Rate Call Girls In Saket, Delhi NCR
 
Recommendable # 971589162217 # philippine Young Call Girls in Dubai By Marina...
Recommendable # 971589162217 # philippine Young Call Girls in Dubai By Marina...Recommendable # 971589162217 # philippine Young Call Girls in Dubai By Marina...
Recommendable # 971589162217 # philippine Young Call Girls in Dubai By Marina...home
 
Verified Trusted Call Girls Adugodi💘 9352852248 Good Looking standard Profil...
Verified Trusted Call Girls Adugodi💘 9352852248  Good Looking standard Profil...Verified Trusted Call Girls Adugodi💘 9352852248  Good Looking standard Profil...
Verified Trusted Call Girls Adugodi💘 9352852248 Good Looking standard Profil...kumaririma588
 
Peaches App development presentation deck
Peaches App development presentation deckPeaches App development presentation deck
Peaches App development presentation decktbatkhuu1
 
Case Study of Hotel Taj Vivanta, Pune
Case Study of Hotel Taj Vivanta, PuneCase Study of Hotel Taj Vivanta, Pune
Case Study of Hotel Taj Vivanta, PuneLukeKholes
 
SD_The MATATAG Curriculum Training Design.pptx
SD_The MATATAG Curriculum Training Design.pptxSD_The MATATAG Curriculum Training Design.pptx
SD_The MATATAG Curriculum Training Design.pptxjanettecruzeiro1
 
Best VIP Call Girls Noida Sector 44 Call Me: 8448380779
Best VIP Call Girls Noida Sector 44 Call Me: 8448380779Best VIP Call Girls Noida Sector 44 Call Me: 8448380779
Best VIP Call Girls Noida Sector 44 Call Me: 8448380779Delhi Call girls
 
Chapter 19_DDA_TOD Policy_First Draft 2012.pdf
Chapter 19_DDA_TOD Policy_First Draft 2012.pdfChapter 19_DDA_TOD Policy_First Draft 2012.pdf
Chapter 19_DDA_TOD Policy_First Draft 2012.pdfParomita Roy
 
call girls in Vasundhra (Ghaziabad) 🔝 >༒8448380779 🔝 genuine Escort Service 🔝...
call girls in Vasundhra (Ghaziabad) 🔝 >༒8448380779 🔝 genuine Escort Service 🔝...call girls in Vasundhra (Ghaziabad) 🔝 >༒8448380779 🔝 genuine Escort Service 🔝...
call girls in Vasundhra (Ghaziabad) 🔝 >༒8448380779 🔝 genuine Escort Service 🔝...Delhi Call girls
 
Editorial design Magazine design project.pdf
Editorial design Magazine design project.pdfEditorial design Magazine design project.pdf
Editorial design Magazine design project.pdftbatkhuu1
 
VVIP CALL GIRLS Lucknow 💓 Lucknow < Renuka Sharma > 7877925207 Escorts Service
VVIP CALL GIRLS Lucknow 💓 Lucknow < Renuka Sharma > 7877925207 Escorts ServiceVVIP CALL GIRLS Lucknow 💓 Lucknow < Renuka Sharma > 7877925207 Escorts Service
VVIP CALL GIRLS Lucknow 💓 Lucknow < Renuka Sharma > 7877925207 Escorts Servicearoranaina404
 
infant assessment fdbbdbdddinal ppt.pptx
infant assessment fdbbdbdddinal ppt.pptxinfant assessment fdbbdbdddinal ppt.pptx
infant assessment fdbbdbdddinal ppt.pptxsuhanimunjal27
 
Booking open Available Pune Call Girls Kirkatwadi 6297143586 Call Hot Indian...
Booking open Available Pune Call Girls Kirkatwadi  6297143586 Call Hot Indian...Booking open Available Pune Call Girls Kirkatwadi  6297143586 Call Hot Indian...
Booking open Available Pune Call Girls Kirkatwadi 6297143586 Call Hot Indian...Call Girls in Nagpur High Profile
 

Recently uploaded (20)

Kala jadu for love marriage | Real amil baba | Famous amil baba | kala jadu n...
Kala jadu for love marriage | Real amil baba | Famous amil baba | kala jadu n...Kala jadu for love marriage | Real amil baba | Famous amil baba | kala jadu n...
Kala jadu for love marriage | Real amil baba | Famous amil baba | kala jadu n...
 
VVIP Pune Call Girls Hadapsar (7001035870) Pune Escorts Nearby with Complete ...
VVIP Pune Call Girls Hadapsar (7001035870) Pune Escorts Nearby with Complete ...VVIP Pune Call Girls Hadapsar (7001035870) Pune Escorts Nearby with Complete ...
VVIP Pune Call Girls Hadapsar (7001035870) Pune Escorts Nearby with Complete ...
 
(AISHA) Ambegaon Khurd Call Girls Just Call 7001035870 [ Cash on Delivery ] P...
(AISHA) Ambegaon Khurd Call Girls Just Call 7001035870 [ Cash on Delivery ] P...(AISHA) Ambegaon Khurd Call Girls Just Call 7001035870 [ Cash on Delivery ] P...
(AISHA) Ambegaon Khurd Call Girls Just Call 7001035870 [ Cash on Delivery ] P...
 
The_Canvas_of_Creative_Mastery_Newsletter_April_2024_Version.pdf
The_Canvas_of_Creative_Mastery_Newsletter_April_2024_Version.pdfThe_Canvas_of_Creative_Mastery_Newsletter_April_2024_Version.pdf
The_Canvas_of_Creative_Mastery_Newsletter_April_2024_Version.pdf
 
call girls in Dakshinpuri (DELHI) 🔝 >༒9953056974 🔝 genuine Escort Service 🔝✔️✔️
call girls in Dakshinpuri  (DELHI) 🔝 >༒9953056974 🔝 genuine Escort Service 🔝✔️✔️call girls in Dakshinpuri  (DELHI) 🔝 >༒9953056974 🔝 genuine Escort Service 🔝✔️✔️
call girls in Dakshinpuri (DELHI) 🔝 >༒9953056974 🔝 genuine Escort Service 🔝✔️✔️
 
B. Smith. (Architectural Portfolio.).pdf
B. Smith. (Architectural Portfolio.).pdfB. Smith. (Architectural Portfolio.).pdf
B. Smith. (Architectural Portfolio.).pdf
 
Recommendable # 971589162217 # philippine Young Call Girls in Dubai By Marina...
Recommendable # 971589162217 # philippine Young Call Girls in Dubai By Marina...Recommendable # 971589162217 # philippine Young Call Girls in Dubai By Marina...
Recommendable # 971589162217 # philippine Young Call Girls in Dubai By Marina...
 
Verified Trusted Call Girls Adugodi💘 9352852248 Good Looking standard Profil...
Verified Trusted Call Girls Adugodi💘 9352852248  Good Looking standard Profil...Verified Trusted Call Girls Adugodi💘 9352852248  Good Looking standard Profil...
Verified Trusted Call Girls Adugodi💘 9352852248 Good Looking standard Profil...
 
Peaches App development presentation deck
Peaches App development presentation deckPeaches App development presentation deck
Peaches App development presentation deck
 
Case Study of Hotel Taj Vivanta, Pune
Case Study of Hotel Taj Vivanta, PuneCase Study of Hotel Taj Vivanta, Pune
Case Study of Hotel Taj Vivanta, Pune
 
SD_The MATATAG Curriculum Training Design.pptx
SD_The MATATAG Curriculum Training Design.pptxSD_The MATATAG Curriculum Training Design.pptx
SD_The MATATAG Curriculum Training Design.pptx
 
Best VIP Call Girls Noida Sector 44 Call Me: 8448380779
Best VIP Call Girls Noida Sector 44 Call Me: 8448380779Best VIP Call Girls Noida Sector 44 Call Me: 8448380779
Best VIP Call Girls Noida Sector 44 Call Me: 8448380779
 
Chapter 19_DDA_TOD Policy_First Draft 2012.pdf
Chapter 19_DDA_TOD Policy_First Draft 2012.pdfChapter 19_DDA_TOD Policy_First Draft 2012.pdf
Chapter 19_DDA_TOD Policy_First Draft 2012.pdf
 
young call girls in Pandav nagar 🔝 9953056974 🔝 Delhi escort Service
young call girls in Pandav nagar 🔝 9953056974 🔝 Delhi escort Serviceyoung call girls in Pandav nagar 🔝 9953056974 🔝 Delhi escort Service
young call girls in Pandav nagar 🔝 9953056974 🔝 Delhi escort Service
 
young call girls in Vivek Vihar🔝 9953056974 🔝 Delhi escort Service
young call girls in Vivek Vihar🔝 9953056974 🔝 Delhi escort Serviceyoung call girls in Vivek Vihar🔝 9953056974 🔝 Delhi escort Service
young call girls in Vivek Vihar🔝 9953056974 🔝 Delhi escort Service
 
call girls in Vasundhra (Ghaziabad) 🔝 >༒8448380779 🔝 genuine Escort Service 🔝...
call girls in Vasundhra (Ghaziabad) 🔝 >༒8448380779 🔝 genuine Escort Service 🔝...call girls in Vasundhra (Ghaziabad) 🔝 >༒8448380779 🔝 genuine Escort Service 🔝...
call girls in Vasundhra (Ghaziabad) 🔝 >༒8448380779 🔝 genuine Escort Service 🔝...
 
Editorial design Magazine design project.pdf
Editorial design Magazine design project.pdfEditorial design Magazine design project.pdf
Editorial design Magazine design project.pdf
 
VVIP CALL GIRLS Lucknow 💓 Lucknow < Renuka Sharma > 7877925207 Escorts Service
VVIP CALL GIRLS Lucknow 💓 Lucknow < Renuka Sharma > 7877925207 Escorts ServiceVVIP CALL GIRLS Lucknow 💓 Lucknow < Renuka Sharma > 7877925207 Escorts Service
VVIP CALL GIRLS Lucknow 💓 Lucknow < Renuka Sharma > 7877925207 Escorts Service
 
infant assessment fdbbdbdddinal ppt.pptx
infant assessment fdbbdbdddinal ppt.pptxinfant assessment fdbbdbdddinal ppt.pptx
infant assessment fdbbdbdddinal ppt.pptx
 
Booking open Available Pune Call Girls Kirkatwadi 6297143586 Call Hot Indian...
Booking open Available Pune Call Girls Kirkatwadi  6297143586 Call Hot Indian...Booking open Available Pune Call Girls Kirkatwadi  6297143586 Call Hot Indian...
Booking open Available Pune Call Girls Kirkatwadi 6297143586 Call Hot Indian...
 

Moderate Active Strategy Snapshot Report 20171231 on 20180226 Gross 4 p ev

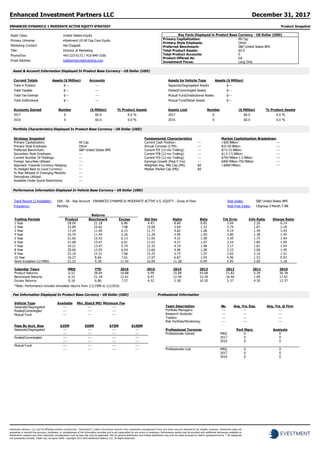
  • 1. ENHANCED DYNAMIC® 1 MODERATE ACTIVE EQUITY STRATEGY Product Snapshot Asset Class: United States-Equity Primary Universe: eVestment US All Cap Core Equity Marketing Contact: Hal Chappell Title: Director of Marketing Phone/Fax: 443-223-0172 / 410-849-3166 Email Address: hal@enhancedinvesting.com Key Facts Displayed in Product Base Currency - US Dollar (USD) Primary Capitalization: All Cap Primary Style Emphasis: Other Preferred Benchmark: S&P United States BMI Total Product Assets: $0.0 Total Product Accounts: 0 Product Offered As: SA Investment Focus: Long Only Asset & Account Information Displayed In Product Base Currency - US Dollar (USD) Current Totals Assets ($ Million) Accounts Total in Product $--- --- Total Taxable $--- --- Total Tax-Exempt $--- --- Total Institutional $--- --- Accounts Gained Number ($ Million) % Product Assets 2017 0 $0.0 0.0 % 2016 0 $0.0 0.0 % Assets by Vehicle Type Assets ($ Million) Separate/Segregated Assets $--- Pooled/Commingled Assets $--- Mutual Fund/Institutional Assets $--- Mutual Fund/Retail Assets $--- Assets Lost Number ($ Million) % Product Assets 2017 0 $0.0 0.0 % 2016 0 $0.0 0.0 % Portfolio Characteristics Displayed In Product Base Currency - US Dollar (USD) Performance Information Displayed In Vehicle Base Currency - US Dollar (USD) Track Record (2 Available): USA - SA - Rep Account - ENHANCED DYNAMIC® MODERATE ACTIVE U.S. EQUITY - Gross of Fees Risk Index: S&P United States BMI Frequency: Monthly Risk-Free Index: Citigroup 3-Month T-Bill Returns Trailing Periods Product Benchmark Excess Std Dev Alpha Beta Trk Error Info Ratio Sharpe Ratio 1 Year 28.04 21.18 6.86 4.43 8.80 0.85 3.04 2.26 6.14 2 Year 23.89 16.82 7.08 10.68 2.64 1.22 3.79 1.87 2.18 3 Year 17.24 11.09 6.15 11.77 4.82 1.08 4.14 1.49 1.43 4 Year 16.70 11.44 5.26 11.28 3.90 1.09 3.80 1.38 1.45 5 Year 21.65 15.52 6.13 11.05 4.31 1.08 3.50 1.75 1.94 6 Year 21.68 15.67 6.01 11.01 4.27 1.07 3.24 1.85 1.95 7 Year 19.21 13.47 5.74 12.35 4.19 1.08 3.17 1.81 1.54 8 Year 20.60 13.95 6.64 13.66 4.96 1.08 3.23 2.06 1.49 9 Year 23.19 15.51 7.68 15.25 5.73 1.07 3.65 2.10 1.51 10 Year 16.27 8.66 7.61 17.07 6.87 1.04 4.96 1.53 0.93 Since Inception (1/1996) 21.23 9.30 11.92 16.09 11.28 0.99 5.95 2.00 1.18 Calendar Years MRQ YTD 2016 2015 2014 2013 2012 2011 2010 Product Returns: 6.51 28.04 19.88 4.99 15.08 43.68 21.82 5.39 30.78 Benchmark Returns: 6.33 21.18 12.61 0.47 12.49 33.39 16.44 1.09 17.42 Excess Returns: 0.18 6.86 7.27 4.52 2.58 10.30 5.37 4.30 13.37 Fee Information Displayed In Product Base Currency - US Dollar (USD) Professional Information Vehicle Type Available Min. Size($ Mil) Minimum Fee Separate/Segregated --- --- --- Pooled/Commingled --- --- --- Mutual Fund --- --- --- Fees By Acct. Size $25M $50M $75M $100M Separate/Segregated --- --- --- --- --- --- --- --- Pooled/Commingled --- --- --- --- --- --- --- --- Mutual Fund --- --- --- --- --- --- --- --- Team Description No. Avg. Yrs. Exp. Avg. Yrs. @ Firm Portfolio Managers: --- --- --- Research Analysts: --- --- --- Traders: --- --- --- Risk Portfolio/Monitoring: --- --- --- Professional Turnover Port Mgrs. Analysts Professionals Gained MRQ 0 0 2017 0 0 2016 0 0 Professionals Lost MRQ 0 0 2017 0 0 2016 0 0 Strategy Snapshot Primary Capitalization: All Cap Primary Style Emphasis: Other Preferred Benchmark: S&P United States BMI Secondary Style Emphasis: --- Current Number Of Holdings: --- Foreign Securities Utilized: --- Approach Towards Currency Hedging: --- % Hedged Back to Local Currency: --- % Max Allowed In Emerging Markets: --- Derivatives Utilized: --- Available Under Social Restrictions: --- Fundamental Characteristics Current Cash Position: --- Annual Turnover (LTM): --- Current P/E (12-mo Trailing): --- Current P/B (12-mo Trailing): --- Current P/S (12-mo Trailing): --- Earnings Growth (Past 5 Yrs): --- Weighted Avg. Mkt Cap (Mil): $0 Median Market Cap (Mil): $0 Market Capitalization Breakdown >$50 Billion: --- $15-50 Billion: --- $7.5-15 Billion: --- $1.5-7.5 Billion: --- $750 Million-1.5 Billion: --- $400 Million-750 Million: --- <$400 Million: --- *Note: Performance includes simulated returns from 1/1/1996 to 1/1/2016. Enhanced Investment Partners LLC December 31, 2017 eVestment Alliance, LLC and its affiliated entities (collectively, “eVestment”) collect information directly from investment management firms and other sources believed to be reliable, however, eVestment does not guarantee or warrant the accuracy, timeliness, or completeness of the information provided and is not responsible for any errors or omissions. Performance results may be provided with additional disclosures available on eVestment’s systems and other important considerations such as fees that may be applicable. Not for general distribution and limited distribution may only be made pursuant to client’s agreement terms. * All categories not necessarily included, Totals may not equal 100%. Copyright 2012-2018 eVestment Alliance, LLC. All Rights Reserved.
  • 2. ENHANCED DYNAMIC® 1 MODERATE ACTIVE EQUITY STRATEGY Product Trends Key Facts Displayed in Product Base Currency - US Dollar (USD) Primary Capitalization: All Cap Primary Style Emphasis: Other Preferred Benchmark: S&P United States BMI Total Product Assets: $0.0 Total Product Accounts: 0 Product Offered As: SA Investment Focus: Long Only Asset Class: United States-Equity Primary Universe: eVestment US All Cap Core Equity Marketing Contact: Hal Chappell Title: Director of Marketing Phone/Fax: 443-223-0172 / 410-849-3166 Email Address: hal@enhancedinvesting.com Key: Quartiles 1st 2nd 3rd 4th Historical Product Assets Displayed In Product Base Currency - US Dollar (USD) Category 2017 2016 2015 2014 2013 Total $--- $0.0 $--- $--- $--- Institutional $--- $0.0 $--- $--- $--- Taxable $--- $0.0 $--- $--- $--- Tax-Exempt $--- $0.0 $--- $--- $--- Universe Ranking Analysis vs eVestment US All Cap Core Equity Displayed In Vehicle Base Currency - US Dollar (USD) Annualized Returns (Periods Ending December 31, 2017) Percentile MRQ YTD 1 Yr 3 Yrs 5 Yrs 7 Yrs 10 Yrs 5th 8.76 29.75 29.75 13.28 18.32 15.61 11.34 25th 6.98 23.90 23.90 11.83 16.28 13.90 9.33 Median 6.13 20.51 20.51 10.09 14.97 12.66 8.56 75th 4.96 16.77 16.77 8.19 12.99 10.97 7.54 95th 2.89 9.35 9.35 4.14 9.42 8.47 5.84 Product 6.51 28.04 28.04 17.24 21.65 19.21 16.27 Rank 43 8 8 1 1 1 1 Calendar Year Returns 2017 2016 2015 2014 2013 Median 20.51 10.59 -0.60 11.28 34.80 Product 28.04 19.88 4.99 15.08 43.68 Rank 8 8 9 18 13 2012 2011 2010 2009 2008 Median 15.53 0.05 16.63 28.65 -36.45 Product 21.82 5.39 30.78 46.07 -30.92 Rank 12 13 2 9 16 Rolling 3-Year Returns (Periods Ending) 12/17 9/17 6/17 3/17 12/16 Median 10.09 9.59 7.90 8.31 7.07 Product 17.24 17.49 14.67 14.50 13.14 Rank 1 1 1 1 1 9/16 6/16 3/16 12/15 9/15 Median 8.86 9.93 10.49 14.40 13.03 Product 14.87 15.17 15.42 20.18 18.87 Rank 1 1 3 2 2 *Note: Performance includes simulated returns from 1/1/1996 to 1/1/2016. Enhanced Investment Partners LLC December 31, 2017 eVestment Alliance, LLC and its affiliated entities (collectively, “eVestment”) collect information directly from investment management firms and other sources believed to be reliable, however, eVestment does not guarantee or warrant the accuracy, timeliness, or completeness of the information provided and is not responsible for any errors or omissions. Performance results may be provided with additional disclosures available on eVestment’s systems and other important considerations such as fees that may be applicable. Not for general distribution and limited distribution may only be made pursuant to client’s agreement terms. * All categories not necessarily included, Totals may not equal 100%. Copyright 2012-2018 eVestment Alliance, LLC. All Rights Reserved.
  • 3. ENHANCED DYNAMIC® 1 MODERATE ACTIVE EQUITY STRATEGY Universe Rank Asset Class: United States-Equity Primary Universe: eVestment US All Cap Core Equity Marketing Contact: Hal Chappell Title: Director of Marketing Phone/Fax: 443-223-0172 / 410-849-3166 Email Address: hal@enhancedinvesting.com Key Facts Displayed in Product Base Currency - US Dollar (USD) Primary Capitalization: All Cap Primary Style Emphasis: Other Preferred Benchmark: S&P United States BMI Total Product Assets: $0.0 Total Product Accounts: 0 Product Offered As: SA Investment Focus: Long Only Peer Group Statistics And Ranking vs. eVestment US All Cap Core Equity Displayed In Vehicle Base Currency - US Dollar (USD) Three Year Statistics vs. eVestment US All Cap Core Equity vs. S&P United States BMI Displayed In Vehicle Base Currency - US Dollar (USD) *Note: Performance includes simulated returns from 1/1/1996 to 1/1/2016. Firm/Product MRQ YTD 1 Yr 3 Yrs 5 Yrs 10 Yrs Return Rank Return Rank Return Rank Return Rank Return Rank Return Rank Enhanced Investment Partners LLC 6.51 43 28.04 8 28.04 8 17.24 1 21.65 1 16.27 1 S&P United States BMI 6.33 47 21.18 48 21.18 48 11.09 34 15.52 41 8.66 46 Universe Median 6.13 --- 20.51 --- 20.51 --- 10.09 --- 14.97 --- 8.56 --- *Note: Performance includes simulated returns from 1/1/1996 to 1/1/2016. Information Ratio Sharpe Ratio Annualized Alpha Standard Deviation Batting Average Excess Returns Median -0.25 0.88 -0.86 10.69 0.47 -1.00 Product 1.49 1.43 4.82 11.77 0.64 6.15 Rank 1 1 1 23 2 1 Enhanced Investment Partners LLC December 31, 2017 eVestment Alliance, LLC and its affiliated entities (collectively, “eVestment”) collect information directly from investment management firms and other sources believed to be reliable, however, eVestment does not guarantee or warrant the accuracy, timeliness, or completeness of the information provided and is not responsible for any errors or omissions. Performance results may be provided with additional disclosures available on eVestment’s systems and other important considerations such as fees that may be applicable. Not for general distribution and limited distribution may only be made pursuant to client’s agreement terms. * All categories not necessarily included, Totals may not equal 100%. Copyright 2012-2018 eVestment Alliance, LLC. All Rights Reserved.
  • 4. ENHANCED DYNAMIC® 1 MODERATE ACTIVE EQUITY STRATEGY Risk vs. Reward Asset Class: United States-Equity Primary Universe: eVestment US All Cap Core Equity Marketing Contact: Hal Chappell Title: Director of Marketing Phone/Fax: 443-223-0172 / 410-849-3166 Email Address: hal@enhancedinvesting.com Key Facts Displayed in Product Base Currency - US Dollar (USD) Primary Capitalization: All Cap Primary Style Emphasis: Other Preferred Benchmark: S&P United States BMI Total Product Assets: $0.0 Total Product Accounts: 0 Product Offered As: SA Investment Focus: Long Only Risk Vs Reward And Market Capture Analysis: 3 Years vs. eVestment US All Cap Core Equity Displayed In Vehicle Base Currency - US Dollar (USD) RISK VS REWARD Returns Standard Deviation Product 17.24 11.77 Benchmark 11.09 10.23 UP VS DOWN MARKET CAPTURE Product Up Market Capture 132.72 # of Up Periods 27 Down Market Capture 98.66 # of Down Periods 9 MARKET CAPTURE ANALYSIS: 3 YEARS Up Market Capture Down Market Capture Median 95.37 100.66 Product 132.72 98.66 Rank 3 55 *Note: Performance includes simulated returns from 1/1/1996 to 1/1/2016. TRACKING ERROR: ROLLING 3-YEAR PERIODS End Trk Error End Trk Error End Trk Error 4q17 4.14 3q16 3.48 2q15 2.76 3q17 4.15 2q16 3.40 1q15 2.28 2q17 4.05 1q16 3.50 4q14 2.04 1q17 4.10 4q15 3.34 3q14 2.07 4q16 4.06 3q15 2.90 2q14 2.04 Enhanced Investment Partners LLC December 31, 2017 eVestment Alliance, LLC and its affiliated entities (collectively, “eVestment”) collect information directly from investment management firms and other sources believed to be reliable, however, eVestment does not guarantee or warrant the accuracy, timeliness, or completeness of the information provided and is not responsible for any errors or omissions. Performance results may be provided with additional disclosures available on eVestment’s systems and other important considerations such as fees that may be applicable. Not for general distribution and limited distribution may only be made pursuant to client’s agreement terms. * All categories not necessarily included, Totals may not equal 100%. Copyright 2012-2018 eVestment Alliance, LLC. All Rights Reserved.