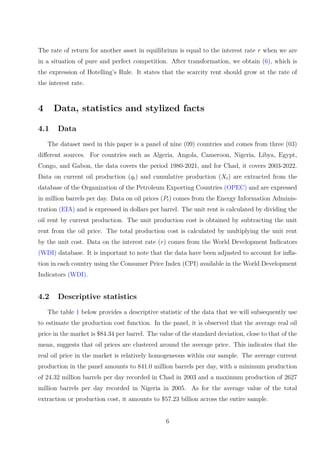
This research paper analyzes oil exploitation dynamics in nine African countries to assess adherence to the optimal extraction trajectory proposed by the Hotelling model. Using data from 1980 to 2021, the study classified the countries into three groups based on extraction behavior, leading to varied results regarding the validity of the Hotelling model and recommendations for enhancing resource management. The findings underscore the significance of environmental and economic policies for the sustainable management of non-renewable resources.
![tainty about reserve size, technological effects, taxation, and exploration.
Nevertheless, in the literature regarding testing the Hotelling model, other authors have
found results that invalidate the Hotelling rule. Farrow (1985) examined a basic model of
mining extraction using monthly data from 1975 to 1981. The estimation results showed a
negative and significant discount rate, thereby rejecting the empirical validity of the Hotelling
model. Chermak and Patrick (1995) utilized a dataset of time series from 29 natural gas wells
to estimate a production cost function. Their results highlighted increasing production costs
with the depletion of the resource stock, revealing a stock effect. Moreover, the temporal trend
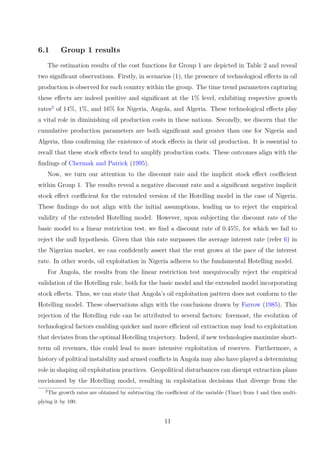
parameter displayed a negative and significant value, indicating that marginal costs decrease
over time.
3 Hotelling model
An exhaustible resource stock can be regarded as a distinct asset yielding income over
time. The extraction and subsequent consumption of a unit of resource imply the impossibility
of extracting and consuming that unit at a later time, as the stock1
is depleted following this
decision. Extracting today thus entails the loss of future income that could have been generated
from the unit just extracted. Hotelling (1931) posits that the depletion of non-renewable
natural resources is driven by the low prices they command, leading to an acceleration in their
extraction. Therefore, in order to decelerate this process, higher prices are necessary, further
compounded by their escalation over the years. In this manner, mine or deposit owners can
weigh the profits from present extraction against those from future extraction. In a perfectly
competitive market, the fundamental economic model assumes that the objective of the operator
is to maximize the present value of benefits from the extraction of a known resource stock. The
profit function of the operator is given by the following equation:
Max π =
T
X
t=0
δt
[P(t)q(t) − C(q(t), X(t), t)] S/C R(t + 1) = R(t) − q(t) (1)
In (1), P(t) represents the price of the resource in the market, q(t) the current production, X(t)
the cumulative production, t the time trend, R(t) the remaining reserve, and δ is the discount
rate of the firm exploiting the resource. We employ the Lagrange method to solve the profit
maximization problem.
1
The stock in this context is assumed to be finite and accurately known.
4](https://image.slidesharecdn.com/mitacscanadaabdoullatifproject31606-240317015904-53394c6e/85/MitacsCanada_AbdoulLatif_Project31606-pdf-5-320.jpg)
![L(q(t), R(t + 1), λ(t)) =
T
X
t=0
δt
[P(t)q(t) − C(q(t), X(t), t) + λ(t)(R(t) − q(t) − R(t + 1))] (2)
We have chosen to derive the parameters that we will need in our paper. To this effect, the
first-order conditions are as follows:
∂L
∂q(t)
= 0 ⇒ δt
[P(t) − C′
q(t) − λ(t)] = 0 ⇒ P(t) − C′
q(t) = λ(t) (3)
∂L
∂R(t + 1)
= 0 ⇒ δt
[−λ(t) + δt+1
λ(t + 1)] = 0 ⇒ λ(t + 1) = (1 + r)λ(t) (4)
Let’s assume that: m(t) = λ(t) and m(t + 1) = λ(t + 1). After changing variables, (3) and (4)
become:
m(t) = P(t) − Cq(t) (5)
m(t + 1) = (1 + r) [P(t) − Cq(t)] (6)
(5) and (6) respectively represent the static and dynamic models of Hotelling. A firm aiming to
maximize the present value of its profits faces an opportunity cost, a consequence of the trade-
off between extracting and selling today versus losing the future income it could have derived
from the resource if it had not been extracted. If the firm or operator decides to extract one
unit, the value of that extracted unit equals its market sale price minus the extraction cost. If it
chooses not to extract, it means that the value of the resource in the ground is more significant
to it than the extraction value. This non-extraction value is the opportunity cost of resource
depletion (Chavy, 2007). In the literature, authors use various terms to identify it: shadow
price, in-situ value, ground value, or scarcity rent, because we have just seen that it’s equal to
the difference between the resource’s market price and its extraction cost. In our paper, this
scarcity rent is represented by m(t), as observed in (5).
When the firm or operator decides not to extract (5) at time t, it implies that the resource
will have a value of m(t+1) in the following period, yielding a rate of return of m(t+1)− m(t)
m(t)
.
5](https://image.slidesharecdn.com/mitacscanadaabdoullatifproject31606-240317015904-53394c6e/85/MitacsCanada_AbdoulLatif_Project31606-pdf-6-320.jpg)