
More Related Content
More from priteeg
More from priteeg (20)
Recently uploaded
Recently uploaded (20)
Mini Mada Population
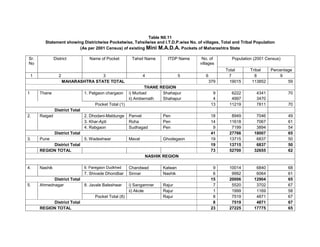
- 1. Table N0.11 Statement showing Districtwise Pocketwise, Tahsilwise and I.T.D.P.wise No. of villages, Total and Tribal Population (As per 2001 Census) of existing Mini M.A.D.A. Pockets of Maharashtra State Sr. District Name of Pocket Tahsil Name ITDP Name No. of Population (2001 Census) No villages Total Tribal Percentage 1 2 3 4 5 6 7 8 9 MAHARASHTRA STATE TOTAL 379 19015 113852 59 THANE REGION 1 Thane 1. Patgaon chargaon i) Murbad Shahapur 9 6222 4341 70 ii) Ambernath Shahapur 4 4997 3470 Pocket Total (1) 13 11219 7811 70 District Total 2. Raigad 2. Dhodani-Maldunge Panvel Pen 18 8949 7046 49 3. Khar-Apti Roha Pen 14 11618 7067 61 4. Rabgaon Sudhagad Pen 9 7199 3894 54 District Total 41 27766 18007 65 3. Pune 5. Wadeshwar Maval Ghodegaon 19 13715 6837 50 District Total 19 13715 6837 50 REGION TOTAL 73 52700 32655 62 NASHIK REGION 4. Nashik 6. Paregaon Dudkhed Chandwad Kalwan 9 10014 6840 68 7. Shivade Dhondbar Sinnar Nashik 6 9992 6064 61 District Total 15 20006 12904 65 5. Ahmednagar 8. Javale Baleshwar i) Sangamner Rajur 7 5520 3702 67 ii) Akole Rajur 1 1999 1169 58 Pocket Total (8) Rajur 8 7519 4871 67 District Total 8 7519 4871 67 REGION TOTAL 23 27225 17775 65
- 2. Sr. District Name of Pocket Tahsil Name ITDP Name No. of Population (2001 Census) No villages Total Tribal Percentage 1 2 3 4 5 6 7 8 9 AMRAVATI REGION 6. Nanded 9. Wakad Amdari Bhokar Kinwat 11 11049 7296 66 10. Pawana Himayatnagar Kinwat 10 10575 6343 60 Daresarsam District Total 21 21624 13639 63 7. Hingoli 11. Nageshwadi i) Aundha Kinwat 9 8731 5308 61 Nagnath Pocket Total (11) 9 8731 5308 61 12. Jambhrun i) Aundha Kinwat 7 9188 4887 53 Aundha Bhosi Nagnath 10 ii) Hingoli Kinwat 3 Pocket Total (12) Kinwat 9188 4887 53 District Total 19 17919 10195 57 8. Amravati 13. Belkheda Achalpur Dharni 21 12902 7976 62 Pandhari District Total 21 12902 7976 62 9. Buldhana 14. Bhosa-Drugbori Mehekar Akola 15 8207 4898 60 District Total 15 8207 4898 60 10. Washim 15. Dhoni Manora Akola 12 11255 6944 62 District Total 12 11255 6944 62 11. Yavatmal 16. Both-Bodan i) Yavatmal Pandharkawada 12 8981 4542 51 ii) Darwha Pandharkawada 2 15 iii) Ner Pandharkawada 1 Pocket Total (16) 8981 4542 51
- 3. Sr. District Name of Pocket Tahsil Name ITDP Name No. of Population (2001 Census) No villages Total Tribal Percentage 1 2 3 4 5 6 7 8 9 Yavatmal (contd.) 17. Chikhali-Kopra Digras Pandharkawada 3 7092 4428 62 Arni Pandharkawada 8 11 62 Pocket Total (17) Pandharkawada 7092 4428 56 District Total Pandharkawada 26 16073 8970 56 REGION TOTAL 114 48537 28758 59 NAGPUR REGION 12. Nagpur 18. Salairani Umred Nagpur 26 6861 3254 47 District Total 26 6861 3254 47 13. Wardha 19. Faridpur i) Samurdapur Nagpur 30 8259 4294 52 ii) Karanja Nagpur 1 803 144 18 Pocket Total (19) Nagpur 31 9062 4438 49 20. Bori-salai Selu Nagpur 33 10459 4452 43 District Total Nagpur 64 19521 9090 46 14. Chandrapur 21. Panjrepar Nagbhir Chimur 14 10979 2927 27 22. Zankapur i) Brahampuri Chimur 16 5002 2384 48 ii) Sawali Chandrapur 9 4759 2866 60 Pocket Total (22) 25 9761 5250 54 23. Murpar Tukum Chimur Chimur 29 11168 6721 60 24. Kawadjal i) Chandrapur Chandrapur 2 3206 1053 33 ii) Ballarpur Chandrapur 9 5175 3285 63 Pocket Total (24) 11 8381 4338 52 District Total 79 40289 19236 66 REGION TOTAL 169 62553 34634 55
- 4. Region Village Total Tribal Percentage Thane 73 52700 32655 62 Nashik 23 27225 17775 65 Amravati 114 48537 28758 59 Nagpur 169 62553 34634 55 Total 379 191015 113822 60